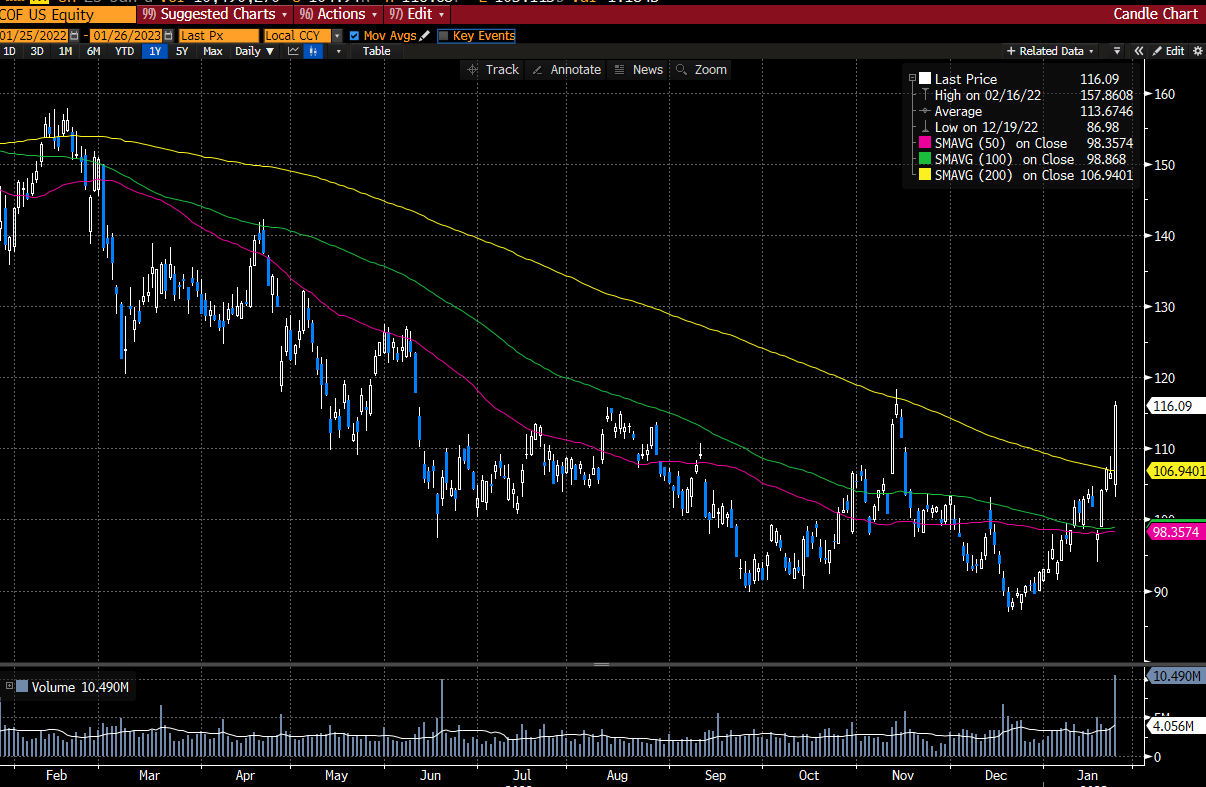
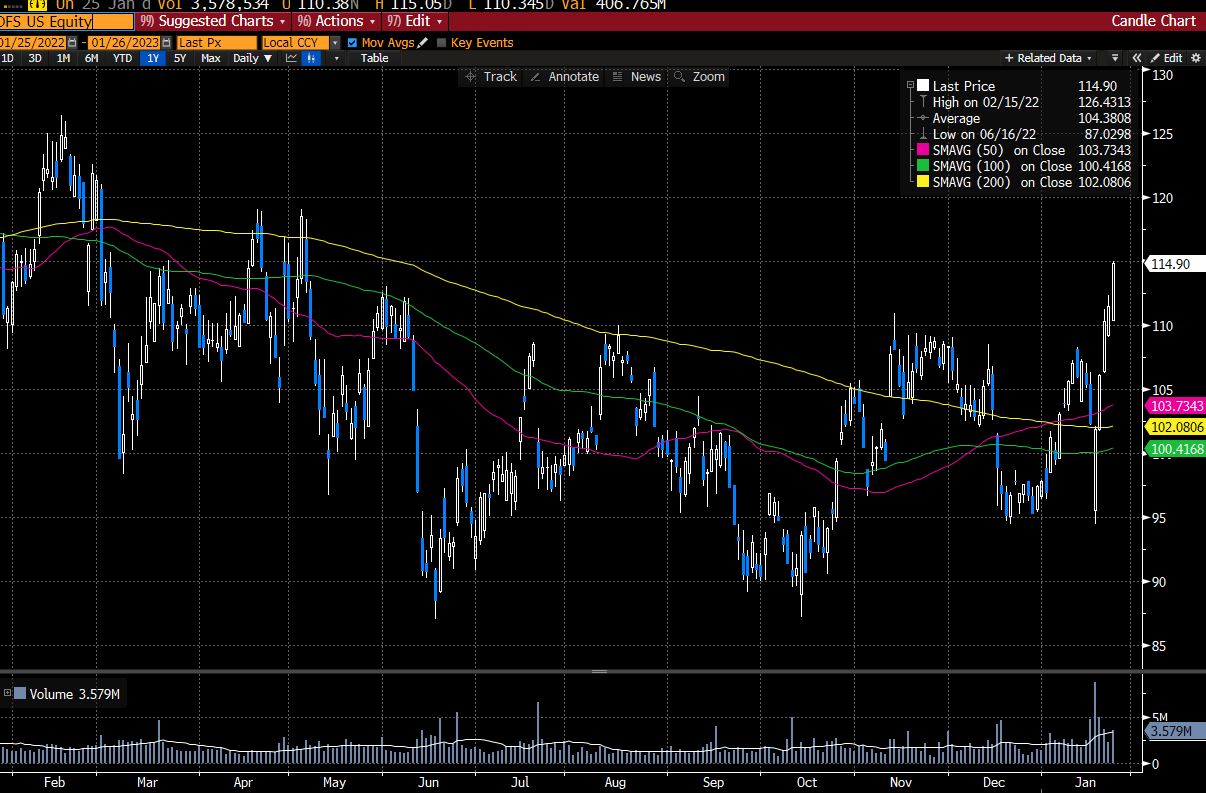
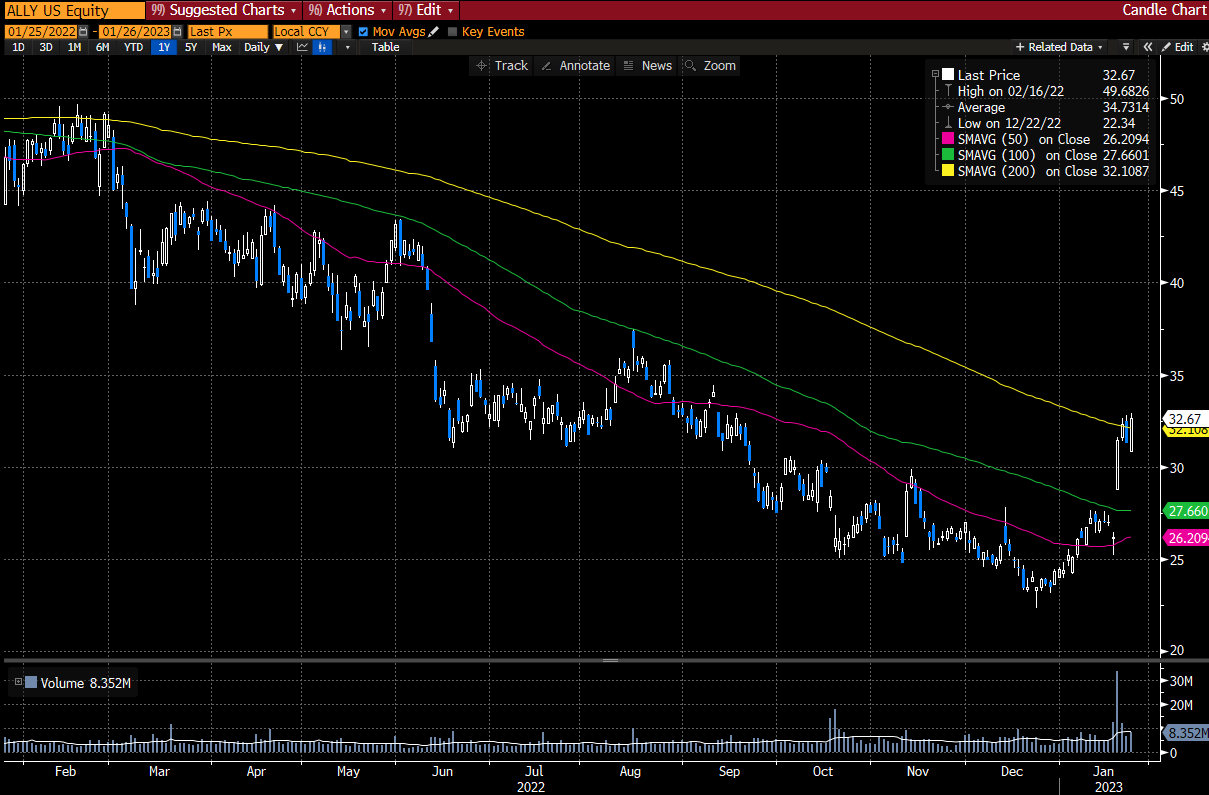
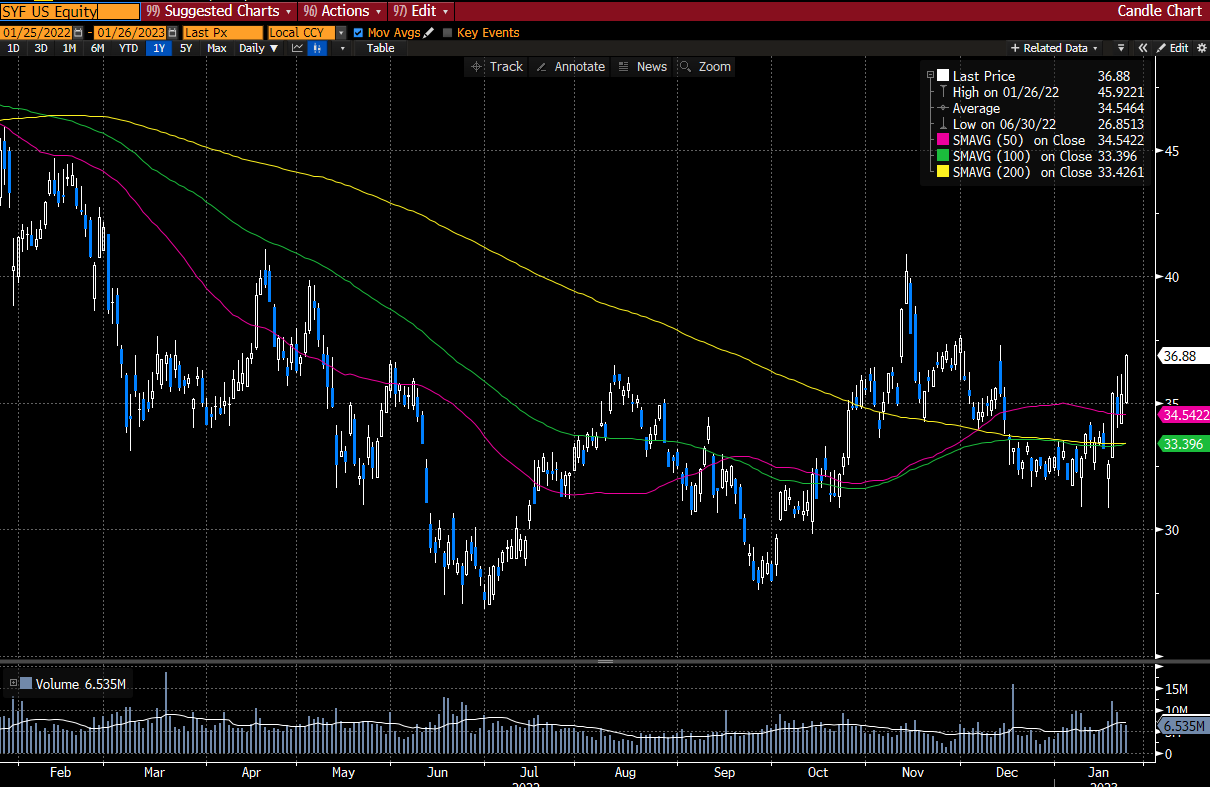
Have you noticed the performance of COF DFS ALLY SYF post earnings???
Let’s look at the charts of each
COF - Capital One
Capital One Financial Corporation provides commercial banking services. The Bank accepts deposits and offers personal credit cards, investment products, loans, and online banking services. Capital One serves customers in the State of Virginia.
DFS - Discover Financial Services
Discover Financial Services operates as a credit card issuer and electronic payment services company. The Company issues credit cards and offers student and personal loans, as well as savings products such as certificates of deposit and money market accounts. Discover Financial Services manages automated teller machine networks.
ALLY - Ally Financial Inc.
Ally Financial Inc. operates as a financial holding company. The Company offers automotive financial services. Ally Financial serves clients in the United States.
SYF - Synchrony Financial
Synchrony Financial operates as a consumer financial services company. The Company provides a range of credit products through programs we have established with a diverse group of national and regional retailers, local merchants, manufacturers, buying groups, industry associations, and healthcare service providers.
They have all recently released earnings and have rallied. Why? Well, many of them have announced increase customer charge offs. Normally a bad thing. For example, Capital One’s Credit card delinquency rate of 3.43% rose from 3.32% in November and from 2.22% in December 2021. The latest report, though, is still below the 3.93% rate in the prepandemic month of December 2019.
However, the credit fears were already priced into these stocks and doom and gloom expectations were too high.
So, what to watch next? The heavy hitters in the group report next Visa, Masrtercard, and American Express.
I think these stocks could really move on better than expected results.
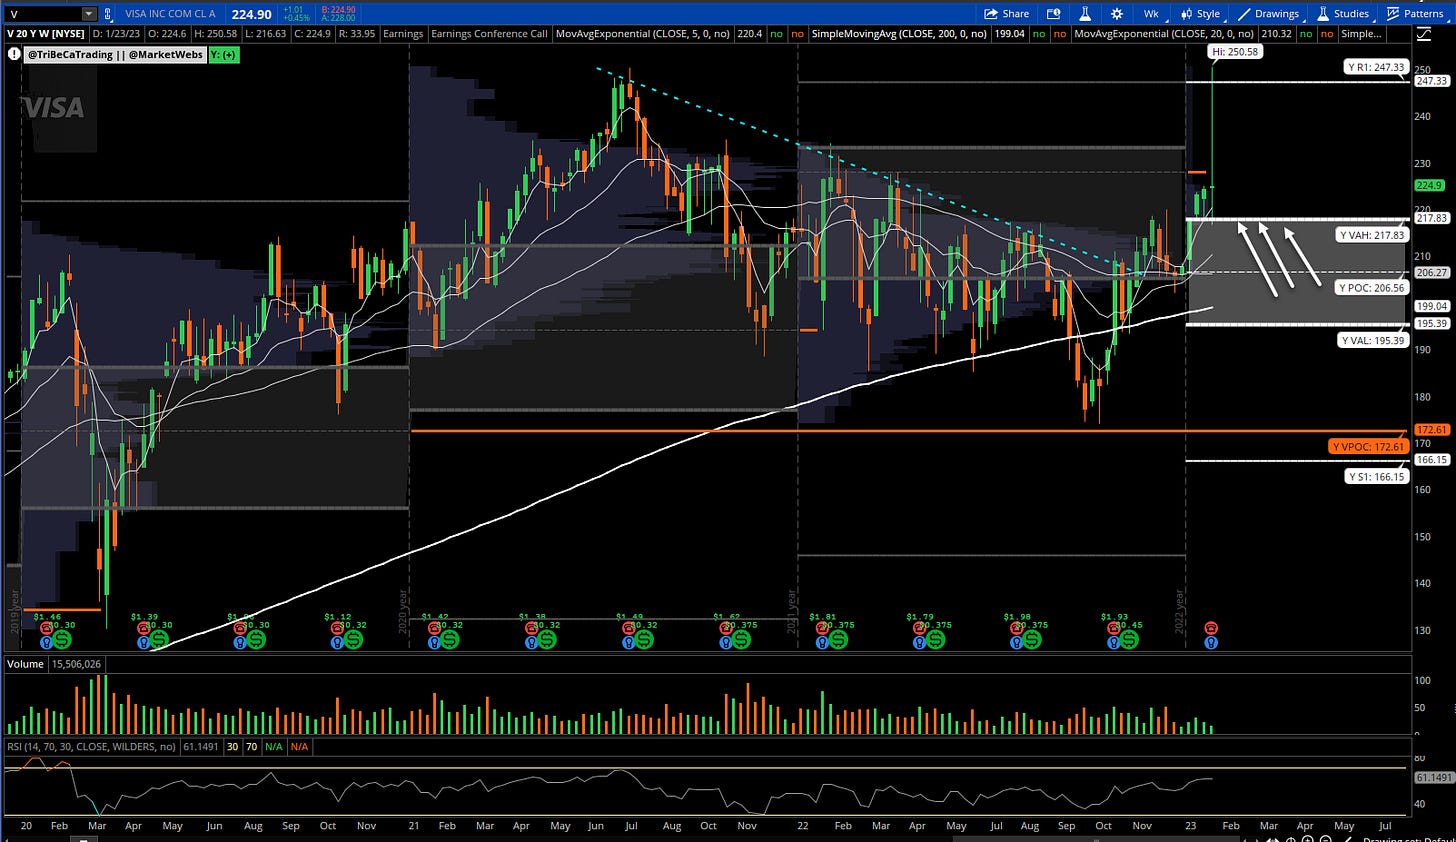
V - Visa, Weekly Chart
-I like a long above $217.83 yearly Value Area using Volume At Price. Note V reports 1/26 and I currently have a long option position.
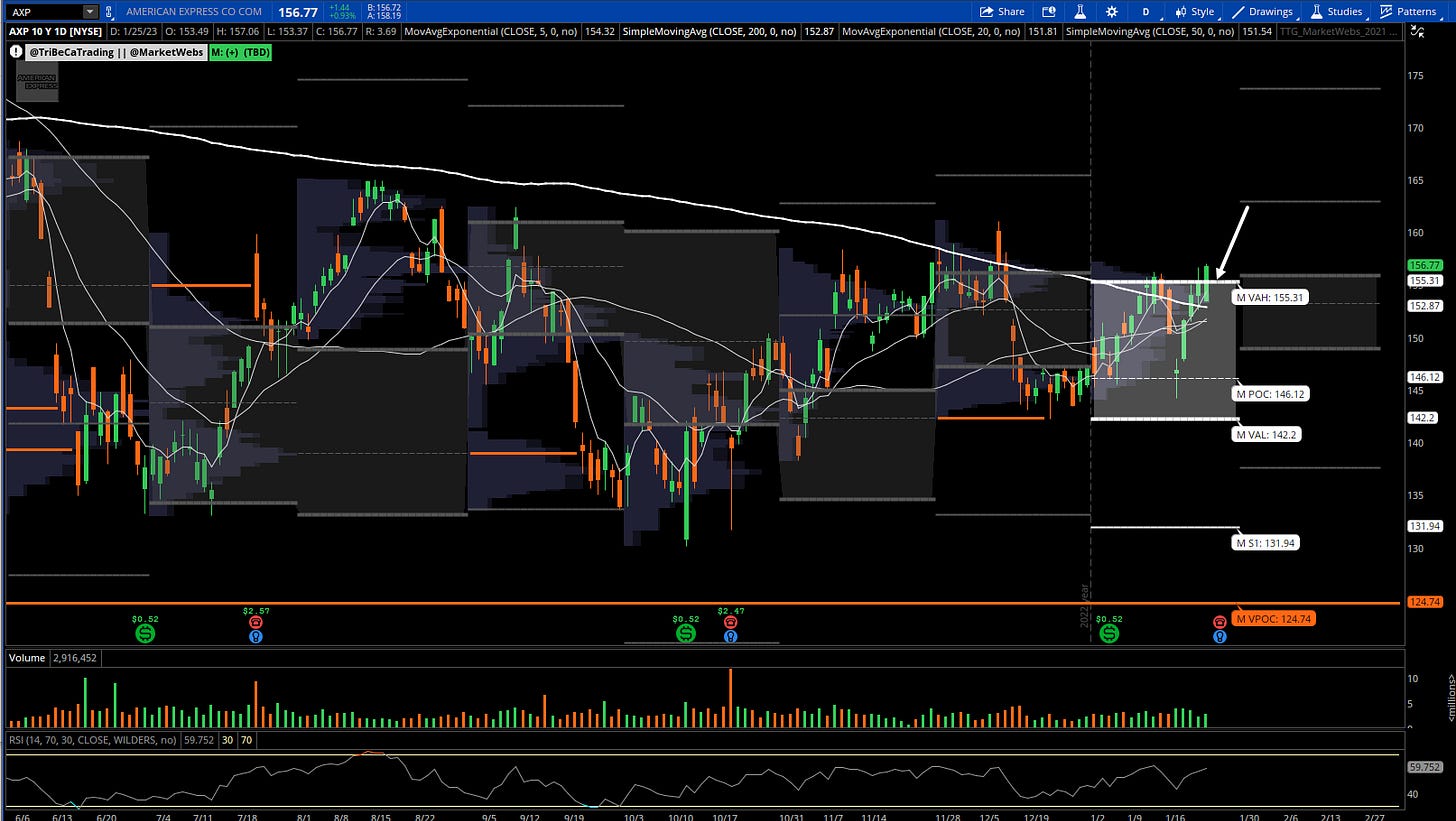
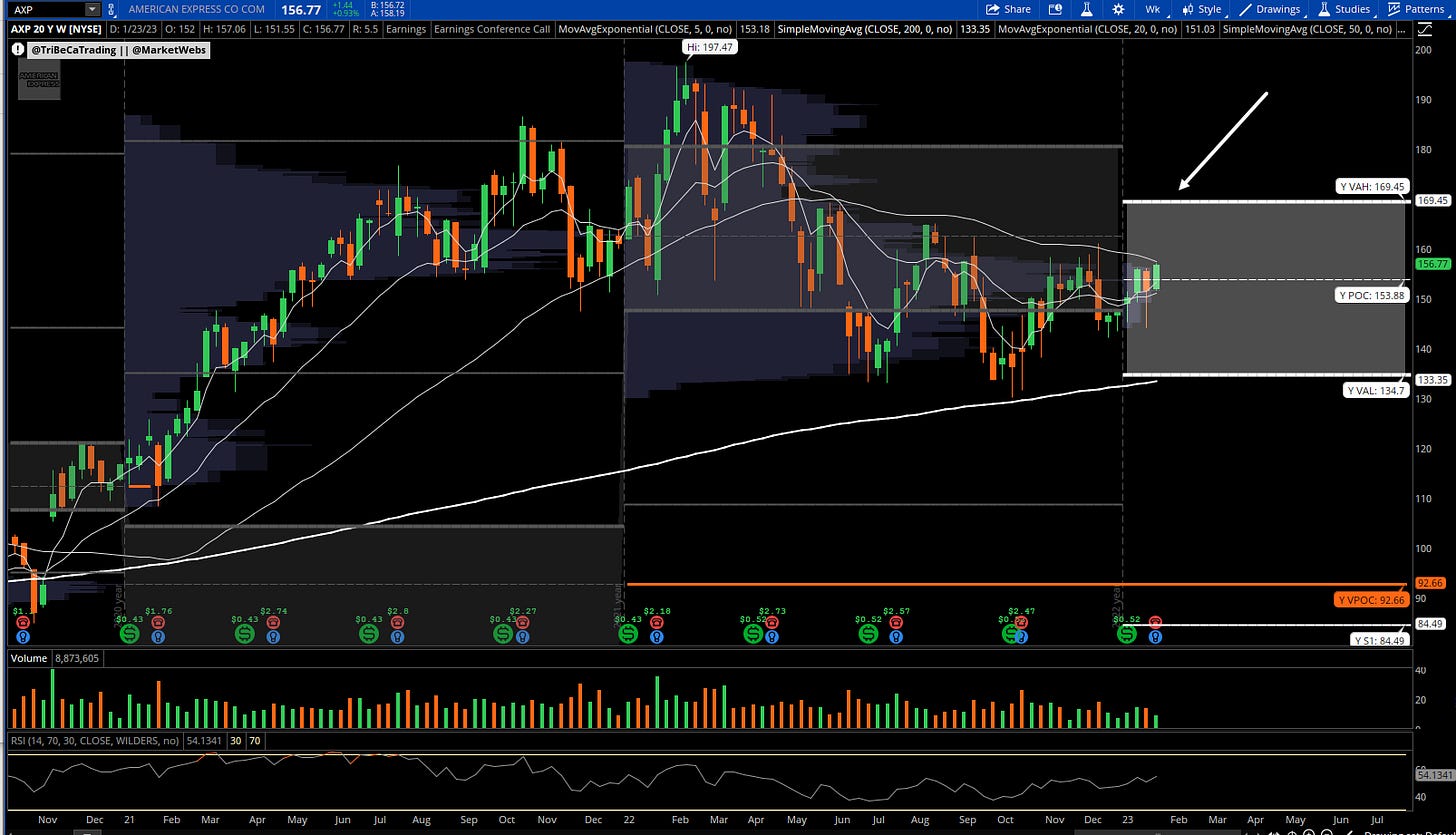
AXP - American Express, Daily & Weekly Chart
-I am currently long AXP and will stay long provided price stays above If AXP can stay above $155.
-Price target: I see resistance at the top of this year’s Value Area using Volume At Price at $169.4 (second chart). Note AXP reports 1/27
Thanks for reading this post! Subscribe for free to receive new posts and support my work.
Copyright © Tribeca Trade Group. All of the information in this newsletter is for entertainment and educational purposes only and is not to be construed as investment or trading advice. None of the information in this newsletter is guaranteed to be accurate, complete, useful or timely. IMPORTANT NOTICES AND DISCLAIMERS TriBeCa Trade Group is not an investment advisor and is not registered with the U.S. Securities and Exchange Commission or the Financial Industry Regulatory Authority. Further, owners, employees, agents or representatives of TriBeCa Trade Group are not acting as investment advisors and might not be registered with the U.S. Securities Authority


