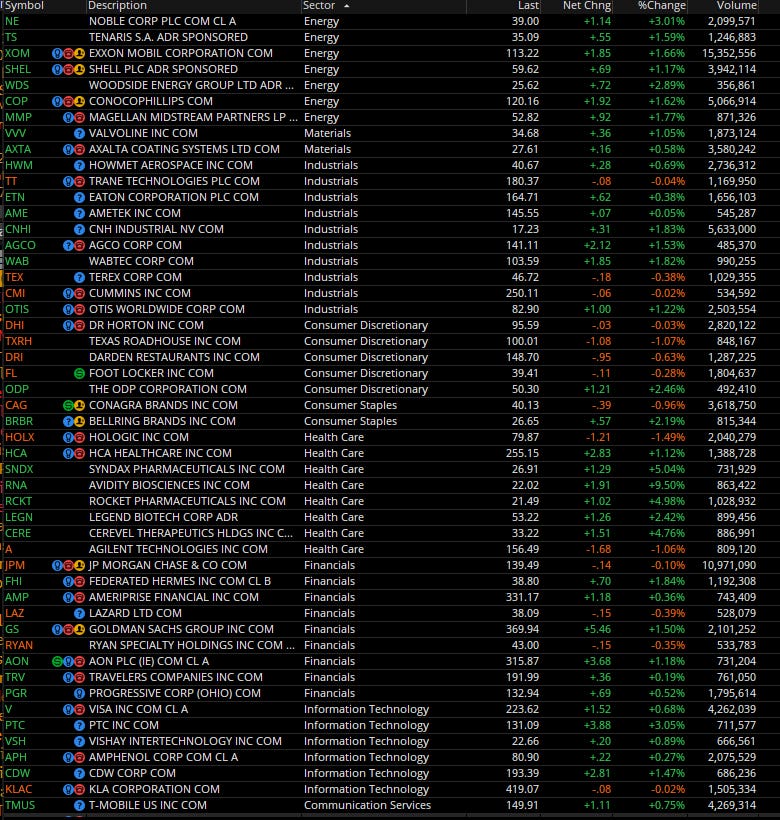
Here is today’s TTG Proprietary Stock Screen using Volume At Price
Please read this post if want to know more about what the screen is & how it can be used:
Quick Takeaway from today’s screen:
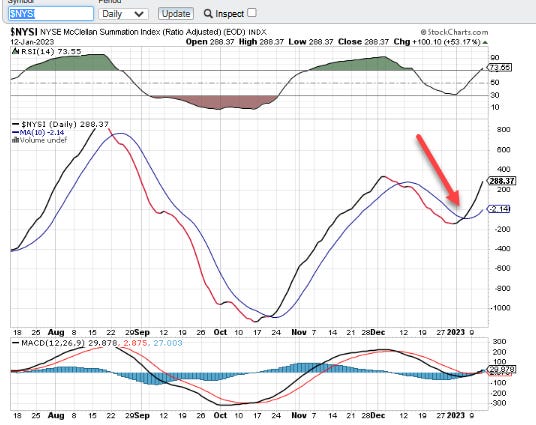
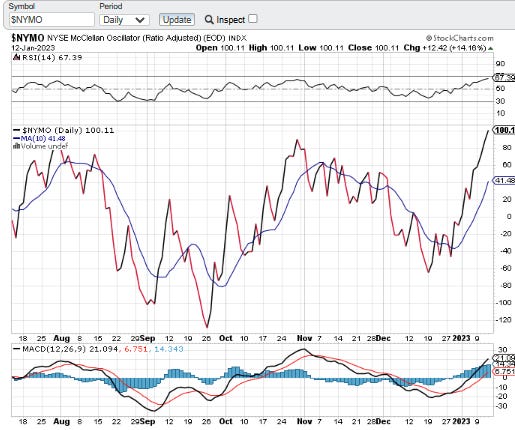
Breadth started to expand towards the end of last week (see NYSI chart below) and has continued to expand. This is a good thing as I want to see a robust market with multiple areas participating on the upside… however, in the short term the market has gotten a bit overbought here (see NYMO chart below). So again, in the short term, I would actually welcome some sideways / back and filling of the recent price action here.
That said, in today’s scan I see Energy, Consumer Discretionary, Industrials, Health Care, Financials, and some Tech showing Relative Strength.
I will show 3-5 chart setups here based on my own preferences but all the companies in the above list meet the same technical criteria.
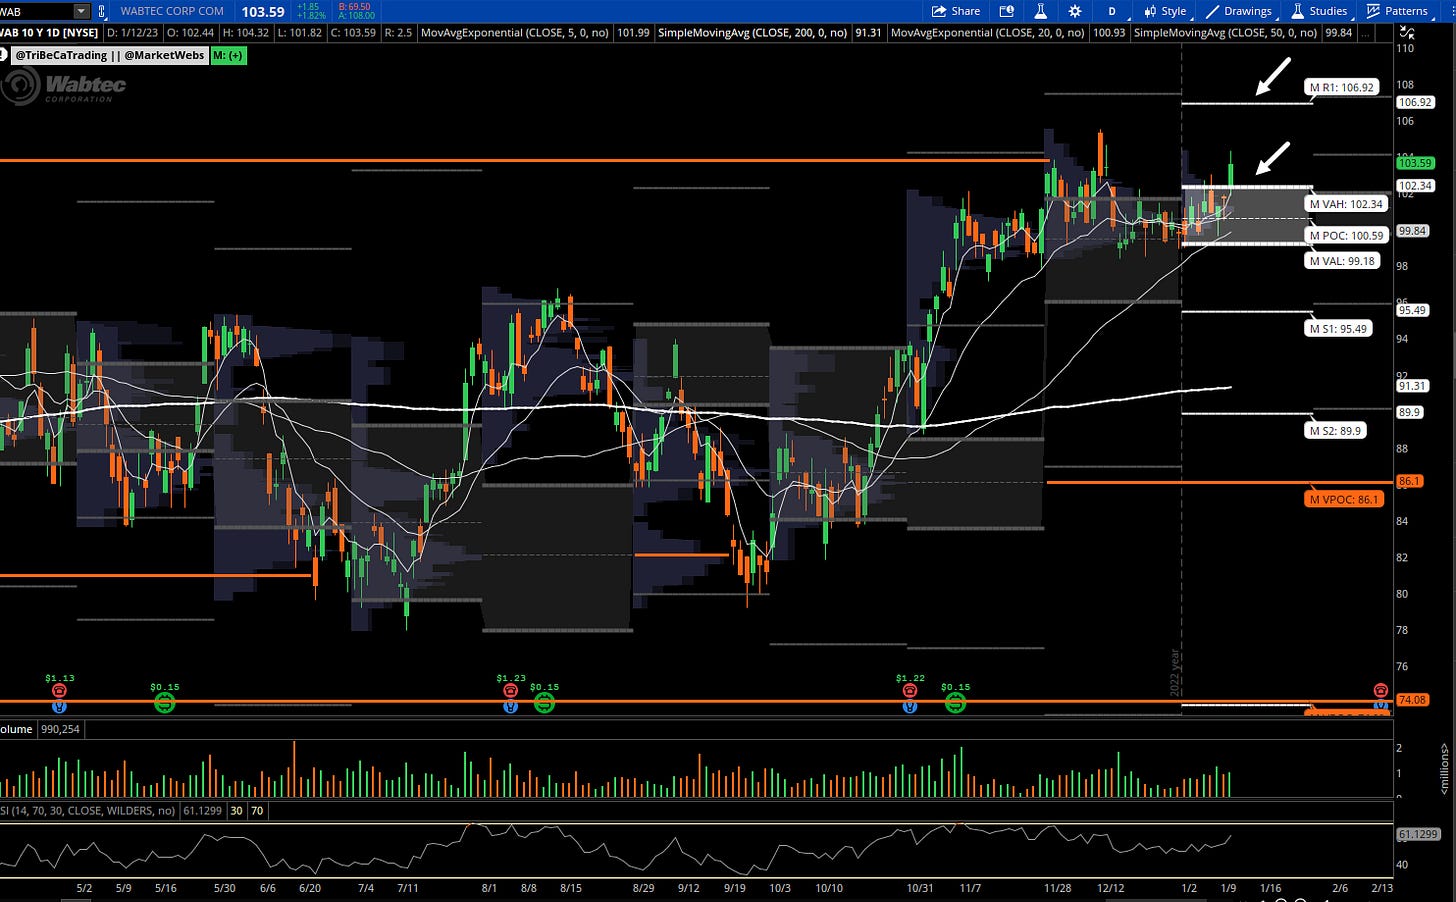
WAB Daily chart
Westinghouse Air Brake Technologies Corporation, doing business as Wabtec Corporation provides technology products and services for the rail industry on a worldwide basis. The Company manufactures a range of products for locomotives, freight cars, and passenger transit vehicles. Westinghouse Air Brake Technologies also builds new locomotives and provides aftermarket services.
-breaking out of Jan Value Area and recent consolidation
- stop $102
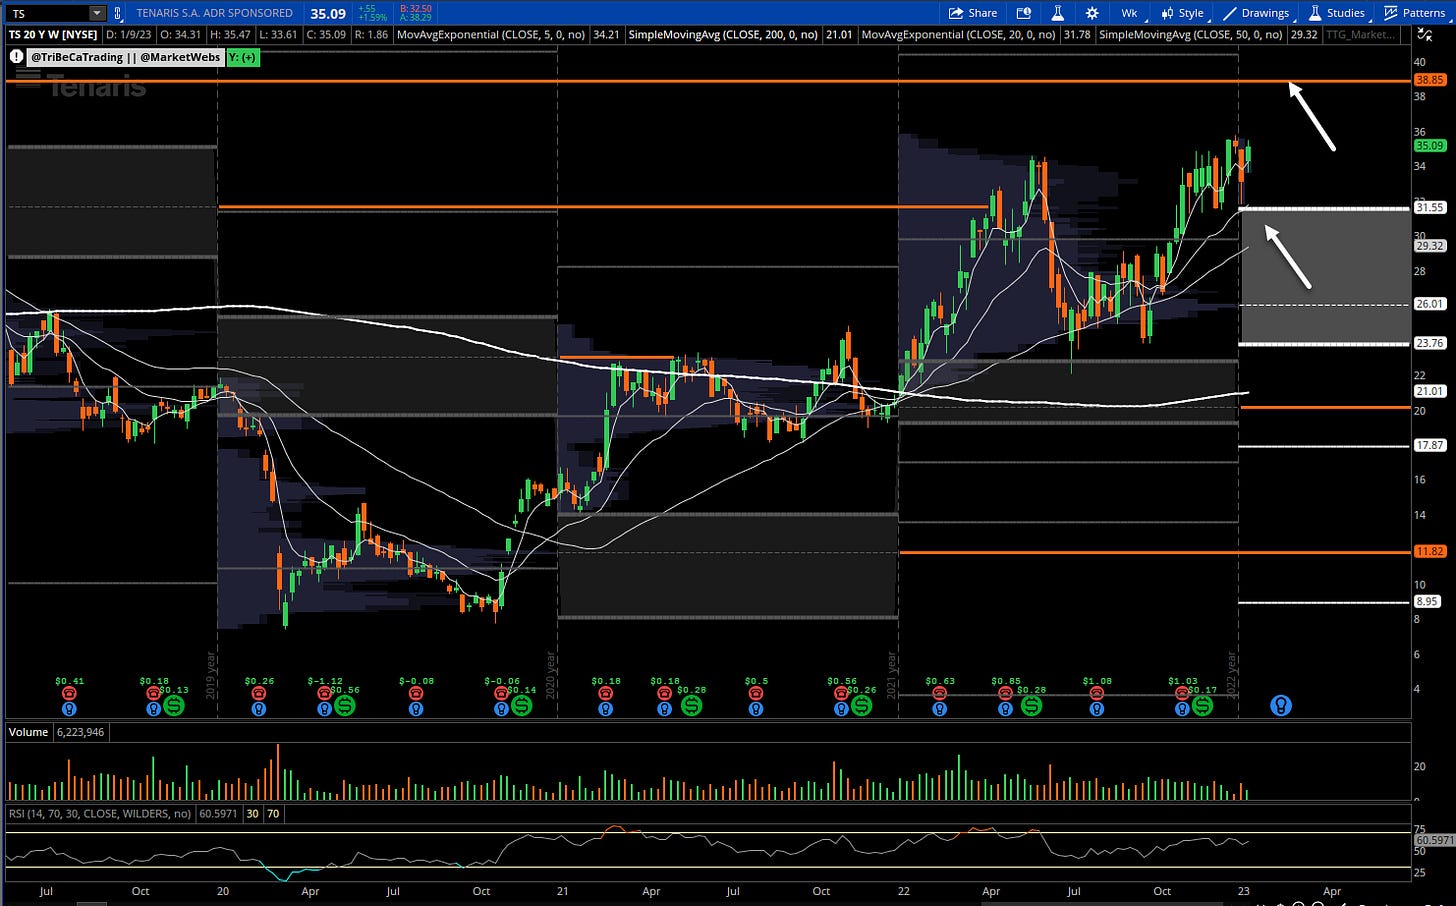
TS Weekly chart
Tenaris S.A. manufactures seamless steel pipe products. The Company also provides pipe handling, stocking, and distribution services to the oil and gas, energy, and mechanical industries. Tenaris supplies welded steel pipes for gas pipelines worldwide.
-yes, another Steel name looking strong here and one of the strongest groups I see currently
- stop $34, upside target $38.85
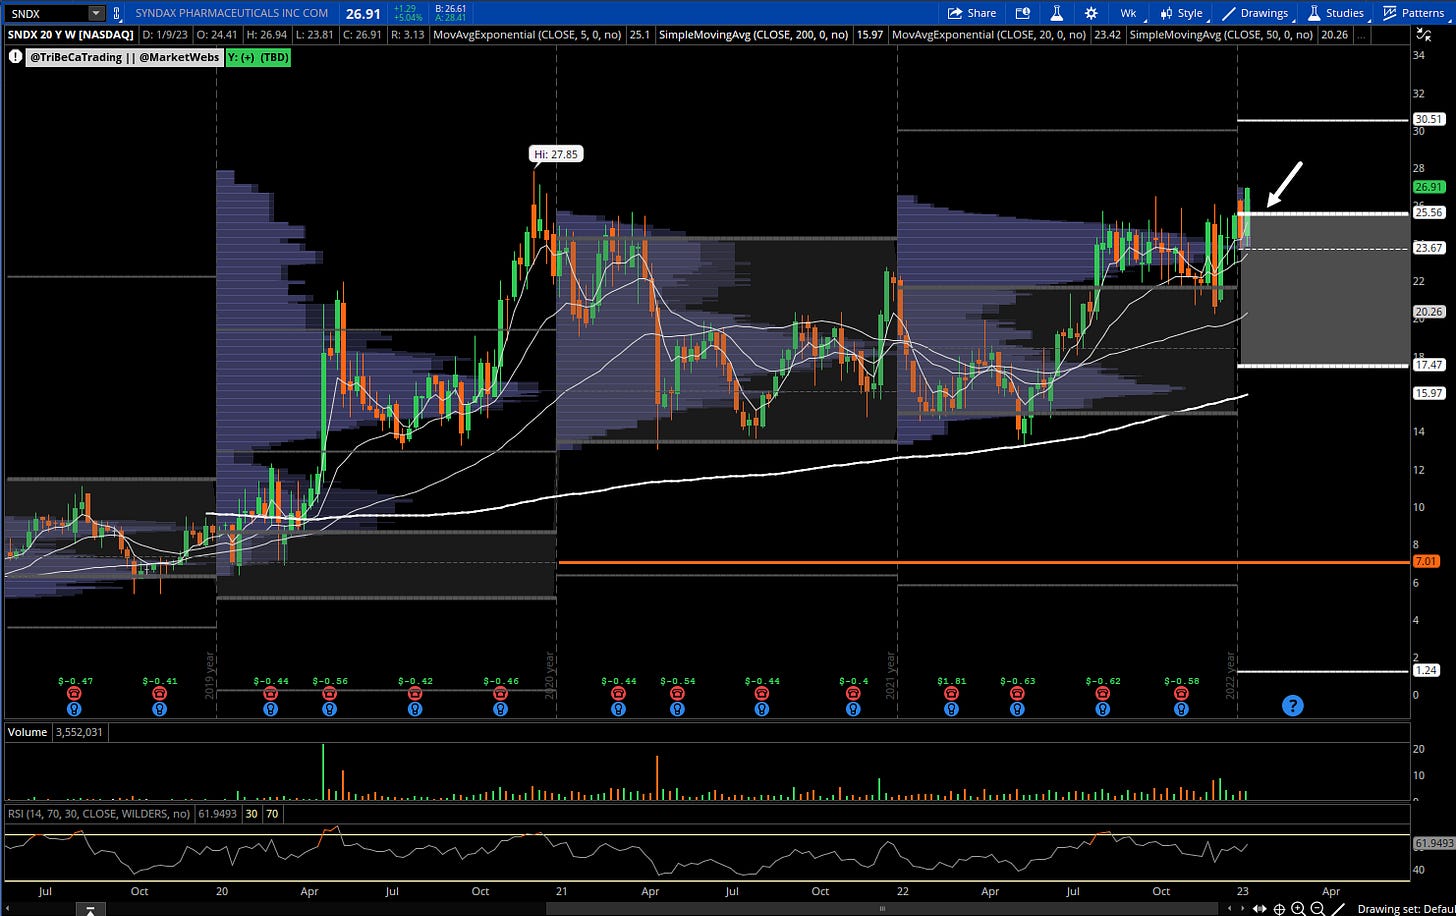
SNDX Weekly chart
Syndax Pharmaceuticals, Inc. operates as a biopharmaceutical company. The Company offers therapies to treat solid tumors and lung, breast, and hematological cancer. Syndax Pharmaceuticals serves the medical and healthcare sectors in the United States.
- has been a bit of a slower mover, but it is resolving higher here
- stop $25
Remember, this is just one type of screen / setup that I focus on in my analysis.
Want to know more about the TTG MarketWebs Indicator? Learn More Here
Copyright © Tribeca Trade Group. All of the information in this newsletter is for entertainment and educational purposes only and is not to be construed as investment or trading advice. None of the information in this newsletter is guaranteed to be accurate, complete, useful or timely. IMPORTANT NOTICES AND DISCLAIMERS TriBeCa Trade Group is not an investment advisor and is not registered with the U.S. Securities and Exchange Commission or the Financial Industry Regulatory Authority. Further, owners, employees, agents or representatives of TriBeCa Trade Group are not acting as investment advisors and might not be registered with the U.S. Securities Authority



OK. I see that all of the stocks in the screen are buy candidates with short stops. Do you adjust the stops when we're in bull markets?
Nice charts that I can dive into on Stockcharts.com and TOS.
I like a lot of the big cap stocks in your screen for trading covered calls and cash secured puts as well as for swing trades.
Are all of the stocks in the screen short term buys? Or are they the universe that you scan for trades?