


TTG Midday Trading Note 3-5-25 + Charts + Open Positions
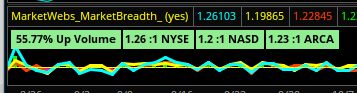
Breadth
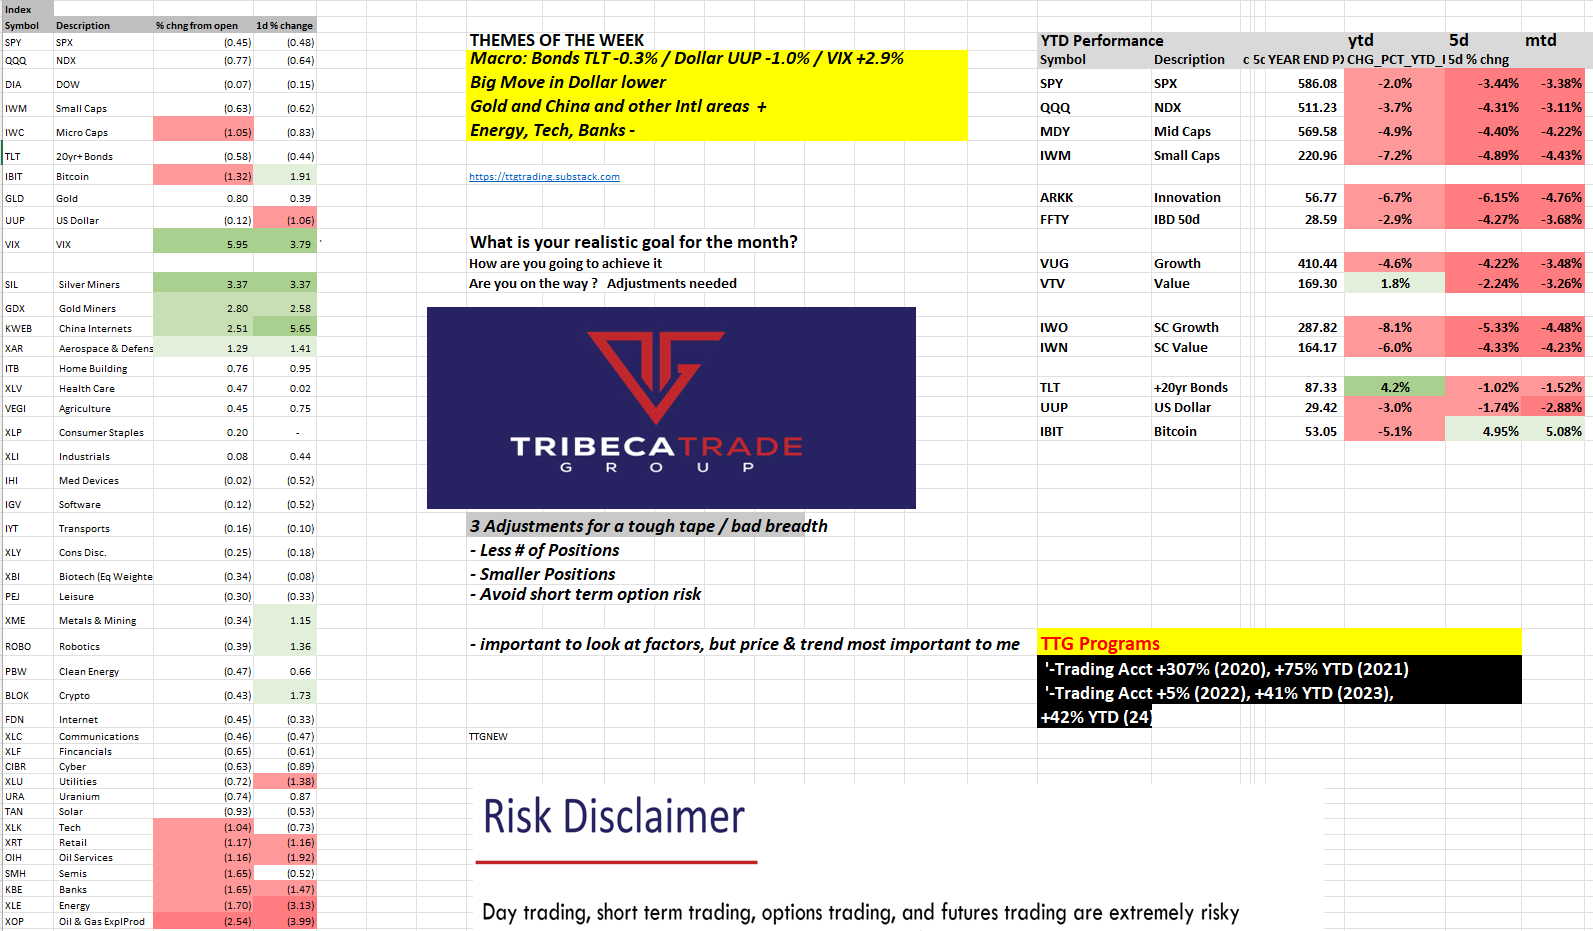
- 55% Up Volume
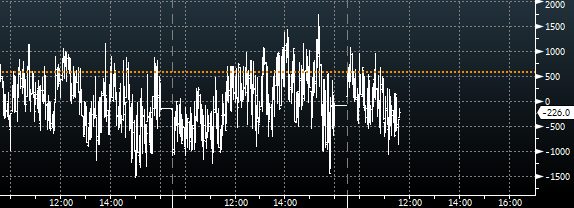
- TICKs bit of a trend down for day
Movers (Mkt Cap > $5B)
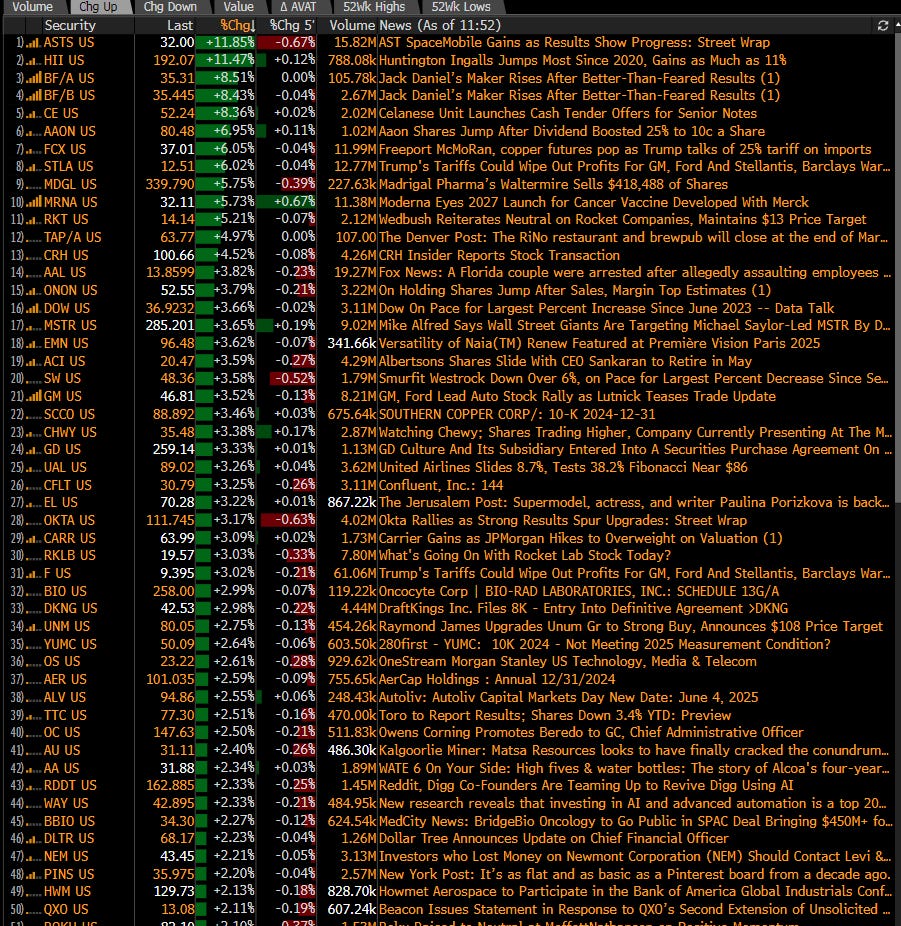
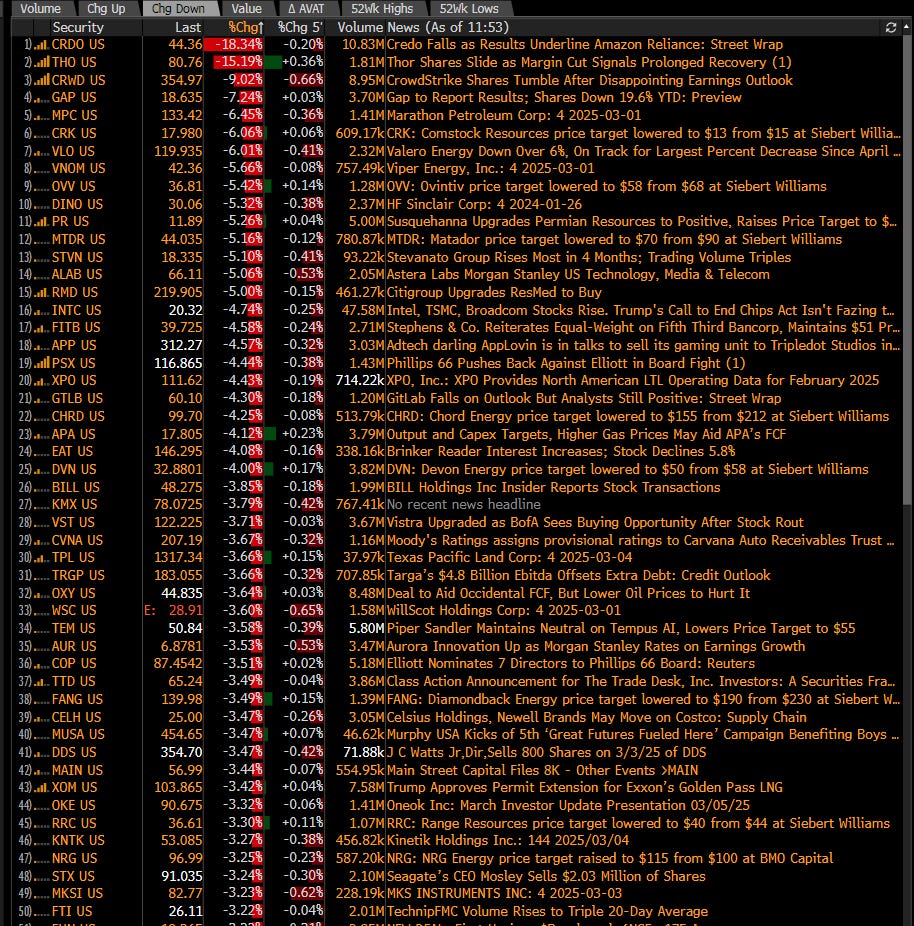
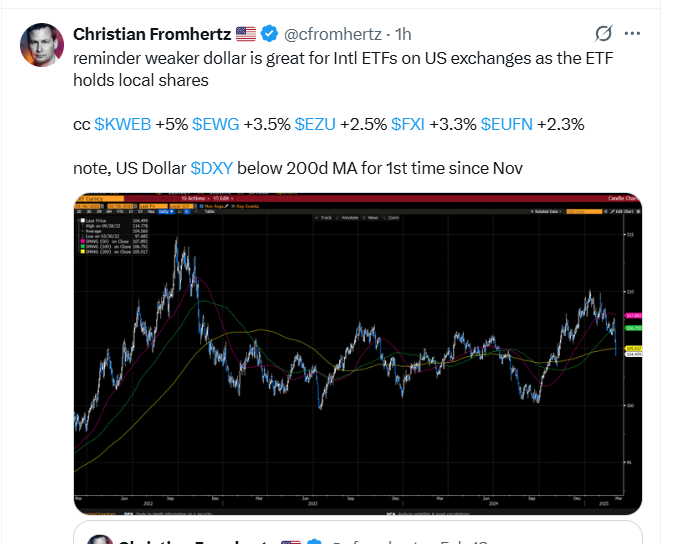
% Change From Open & Themes (see yellow box)
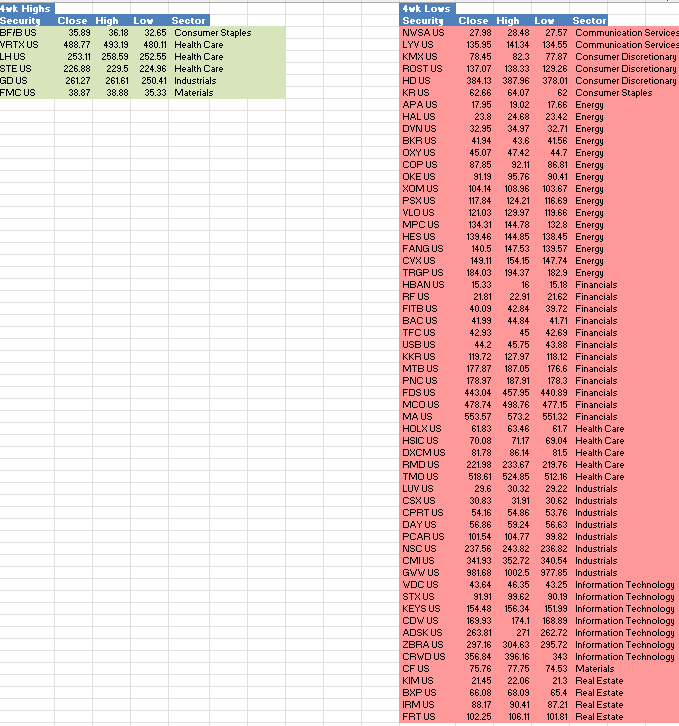
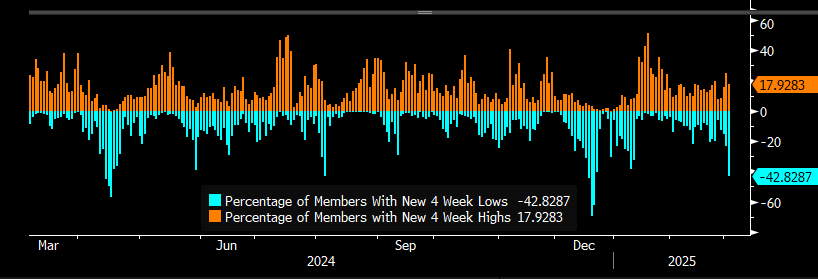
SPX 4wk new highs vs new lows (chart below lags by 1d)
6 new highs today & 58 new lows - new lows > new highs
At TTG, I use Volume At Price in my chart analysis and I use the MarketWebs Indicator to provide Value Areas & VPOCs which indicate significant support & resistance levels. Learn More Here about Volume At Price and the MarketWebs.

Charts (Trade Ideas in Next Section)
My post on the US Dollar earlier today
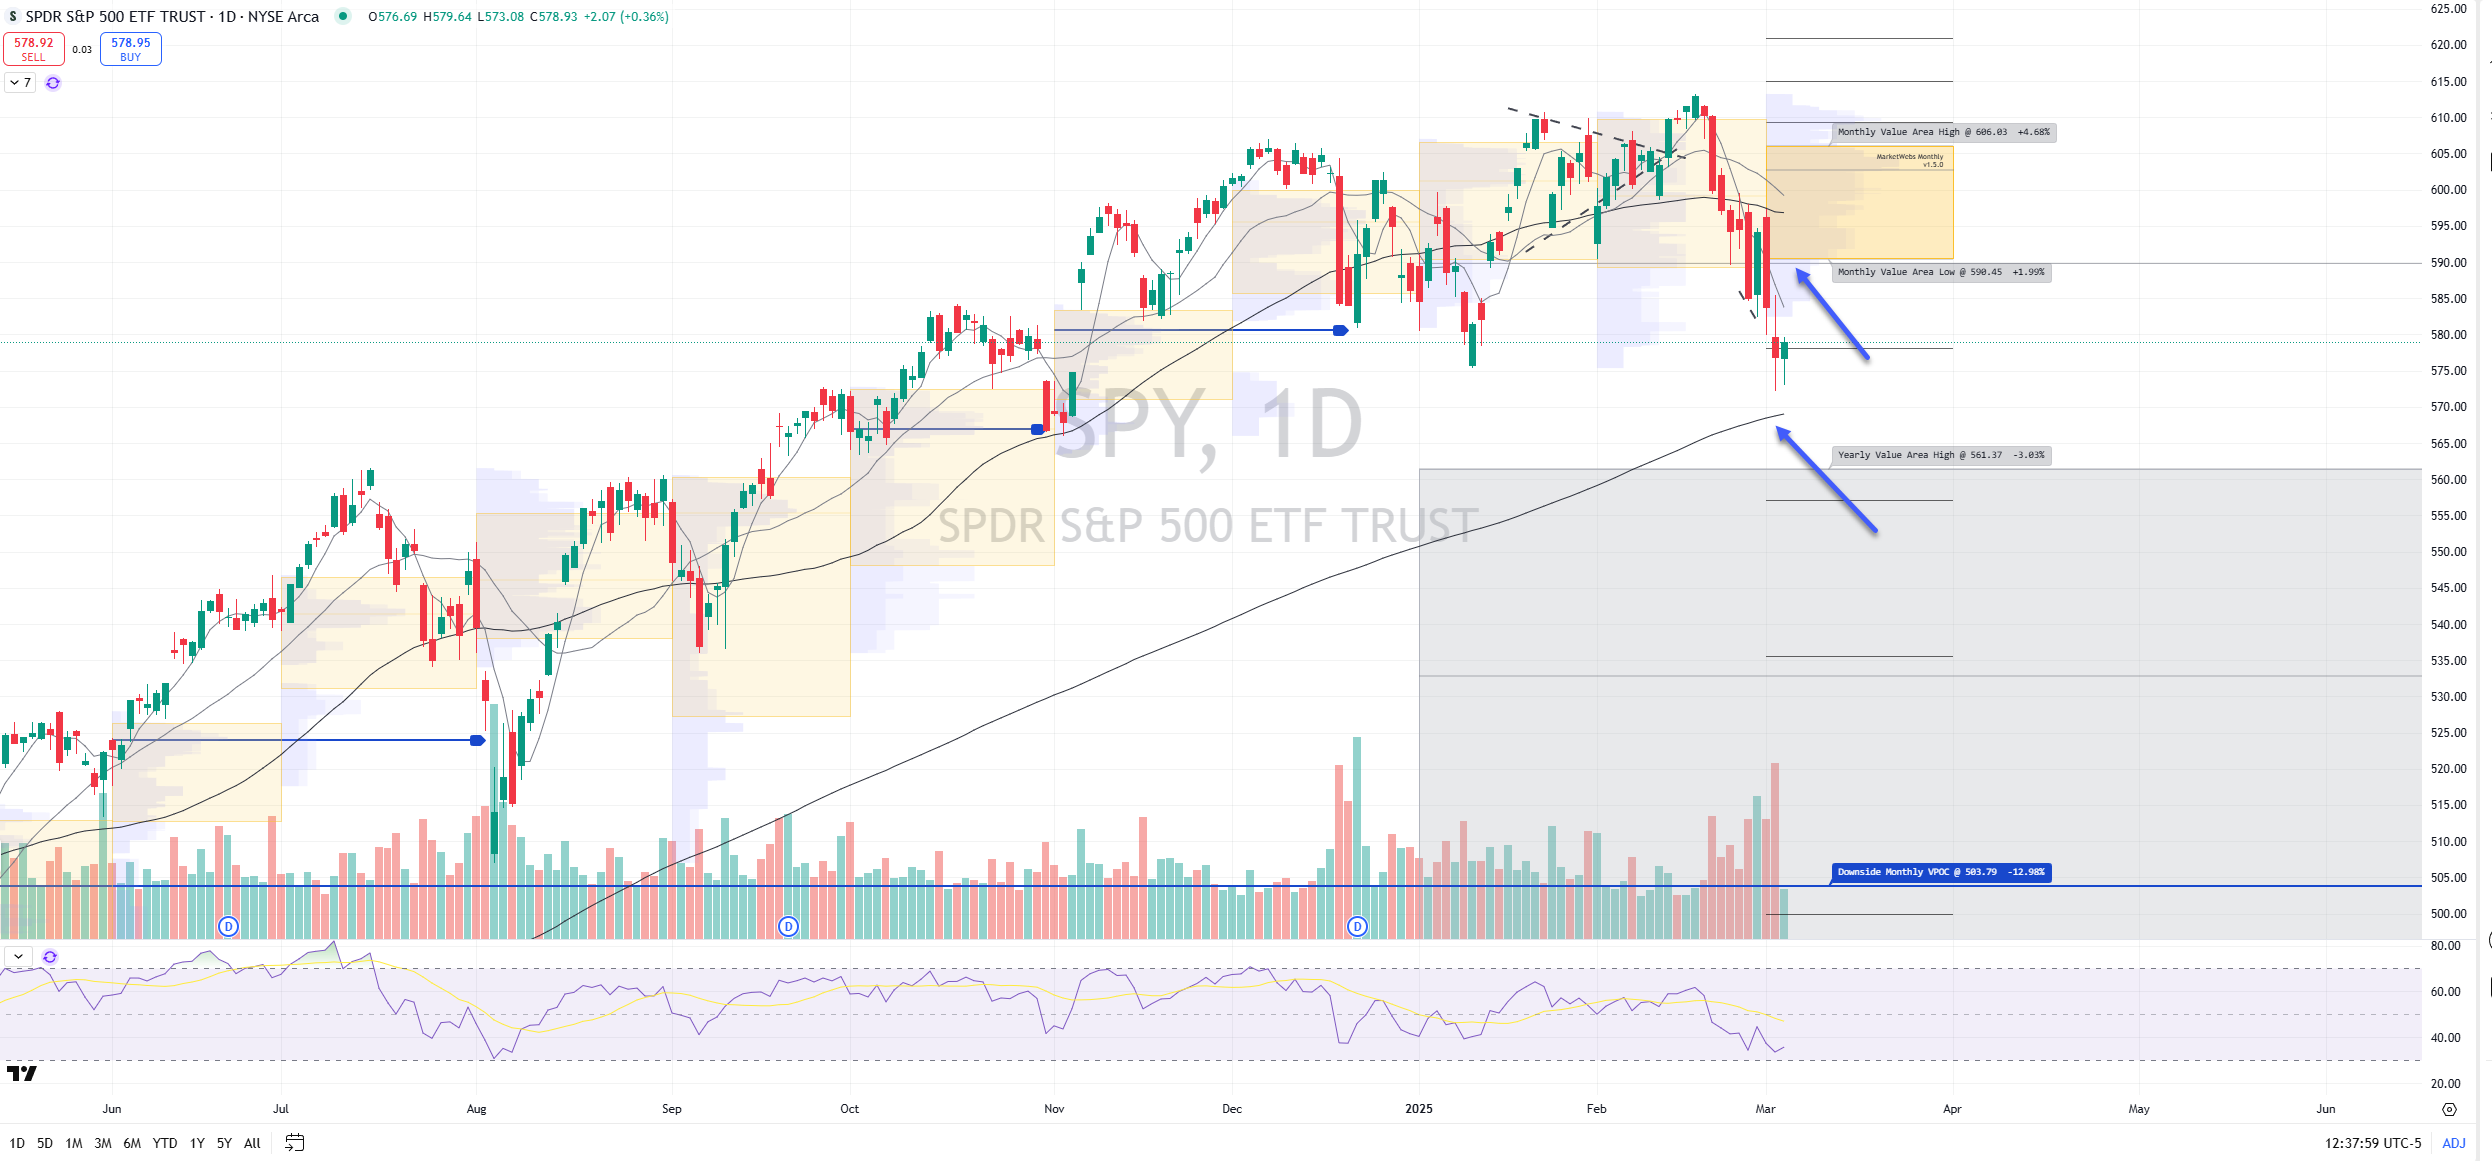
SPY Daily chart (note the Daily Chart contains this month’s Value Area)
Price trying to gain a footing today, but headline market remains… price is just above Jan lows and 200d MA (but remains below 5d MA and Mar Value Area)
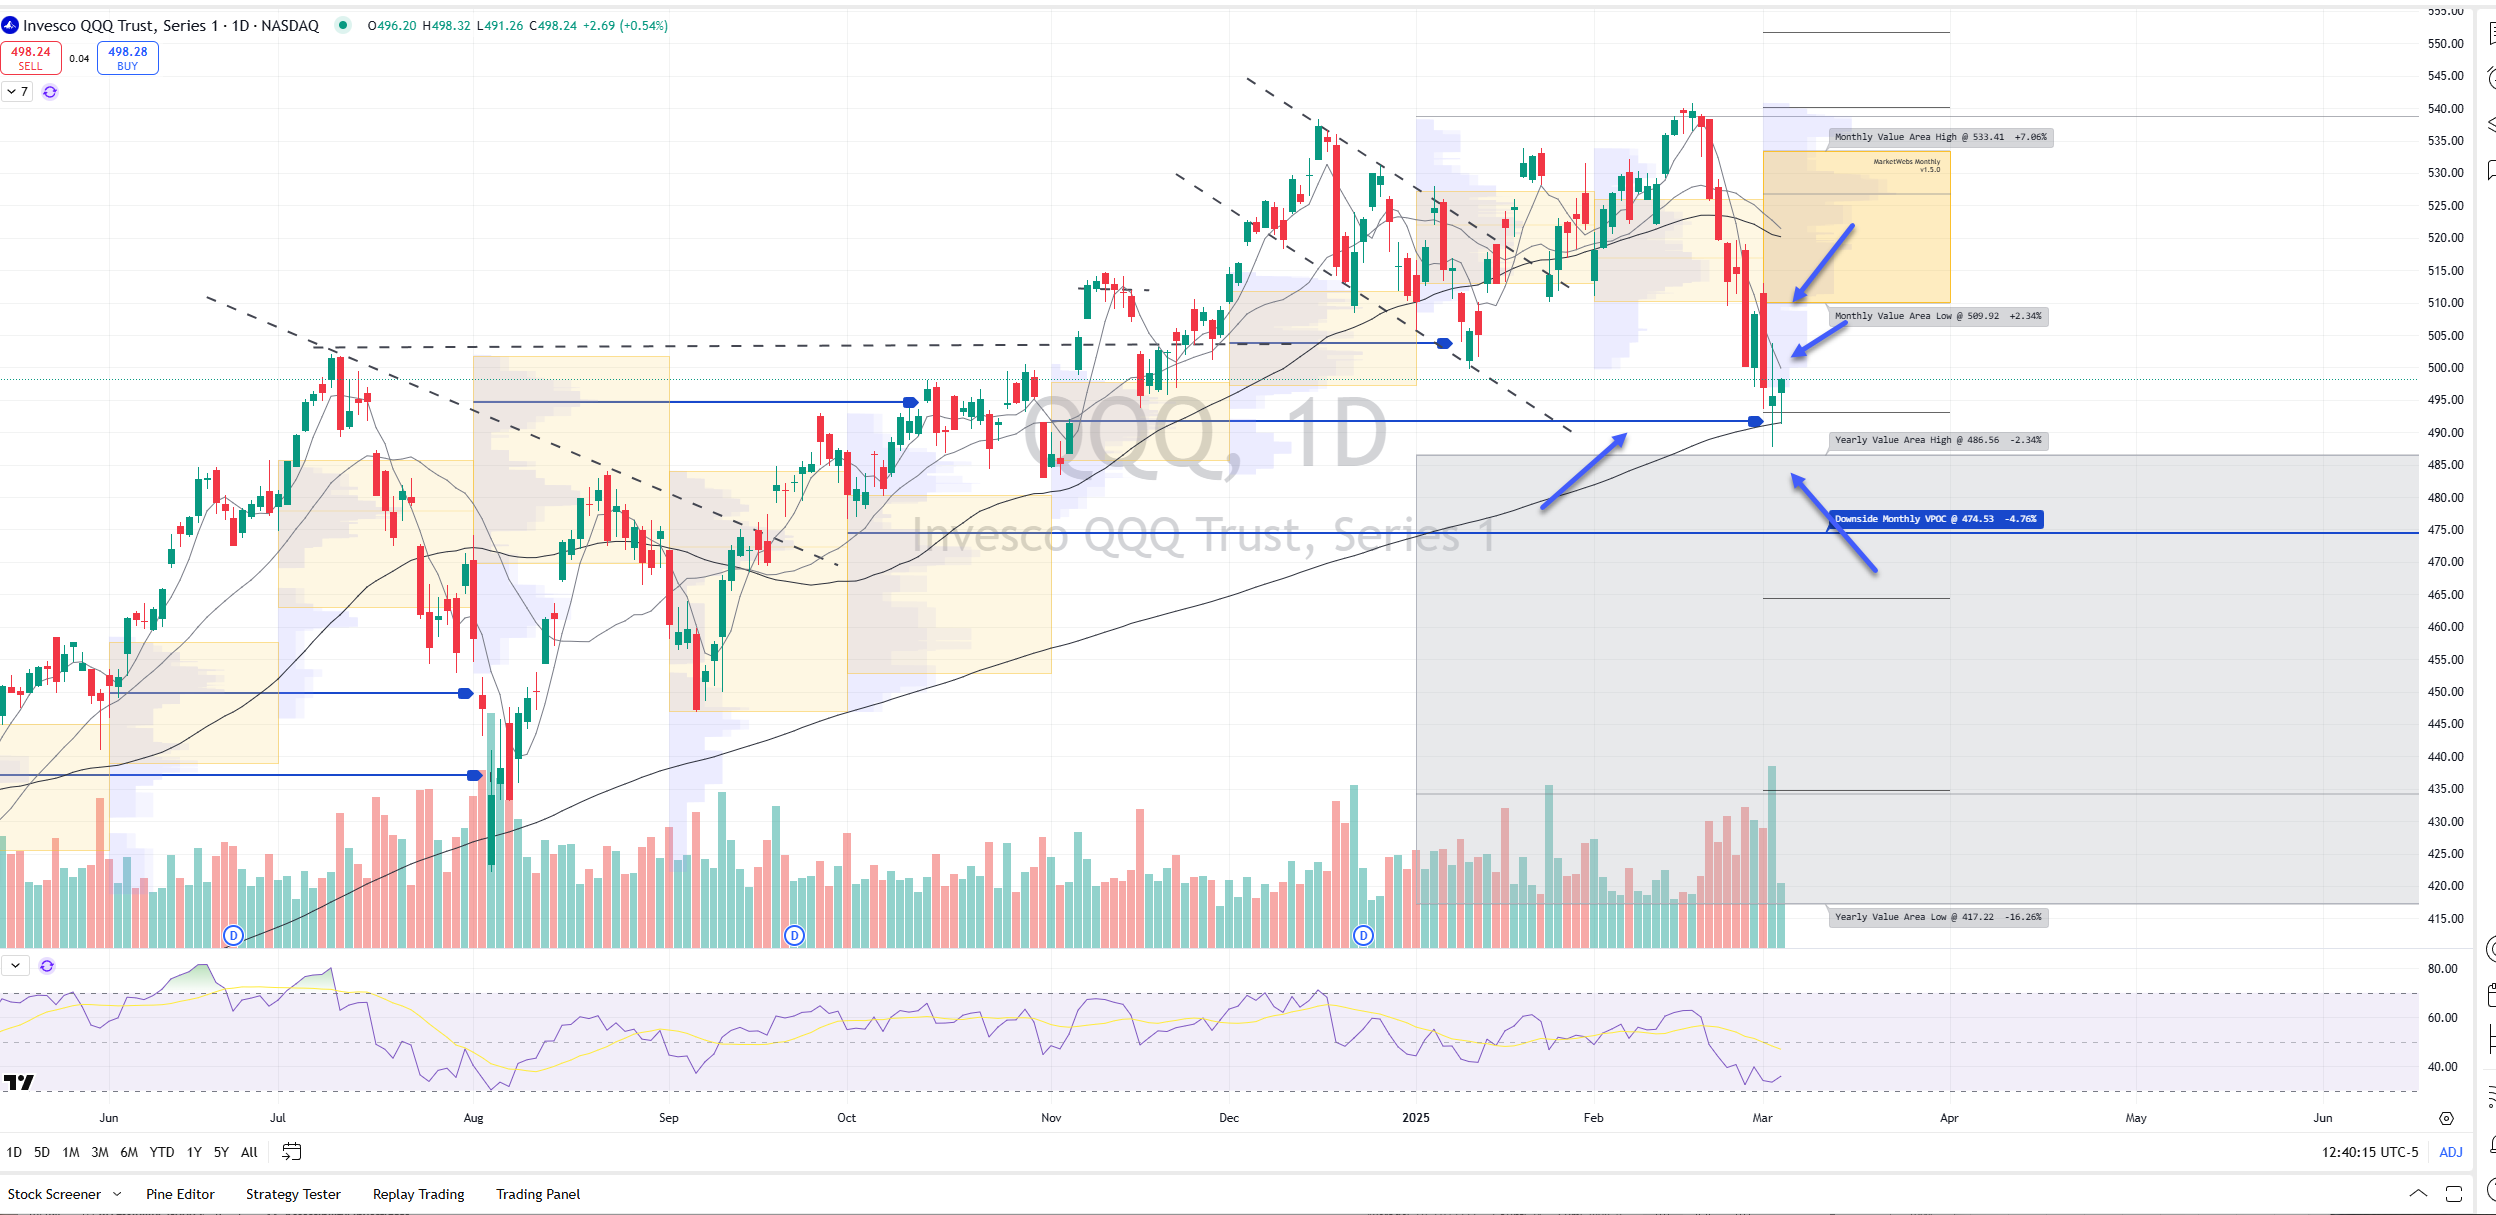
QQQ Daily chart (note the Daily Chart contains this month’s Value Area)
Yesterday, price bounced at the top of the ‘25 Value Area, $486.56 is support and VPOC (blue line). I am watching to see if price can retake its 5d MA as a start
Note, price is still way below 50d MA and Mar Value Area
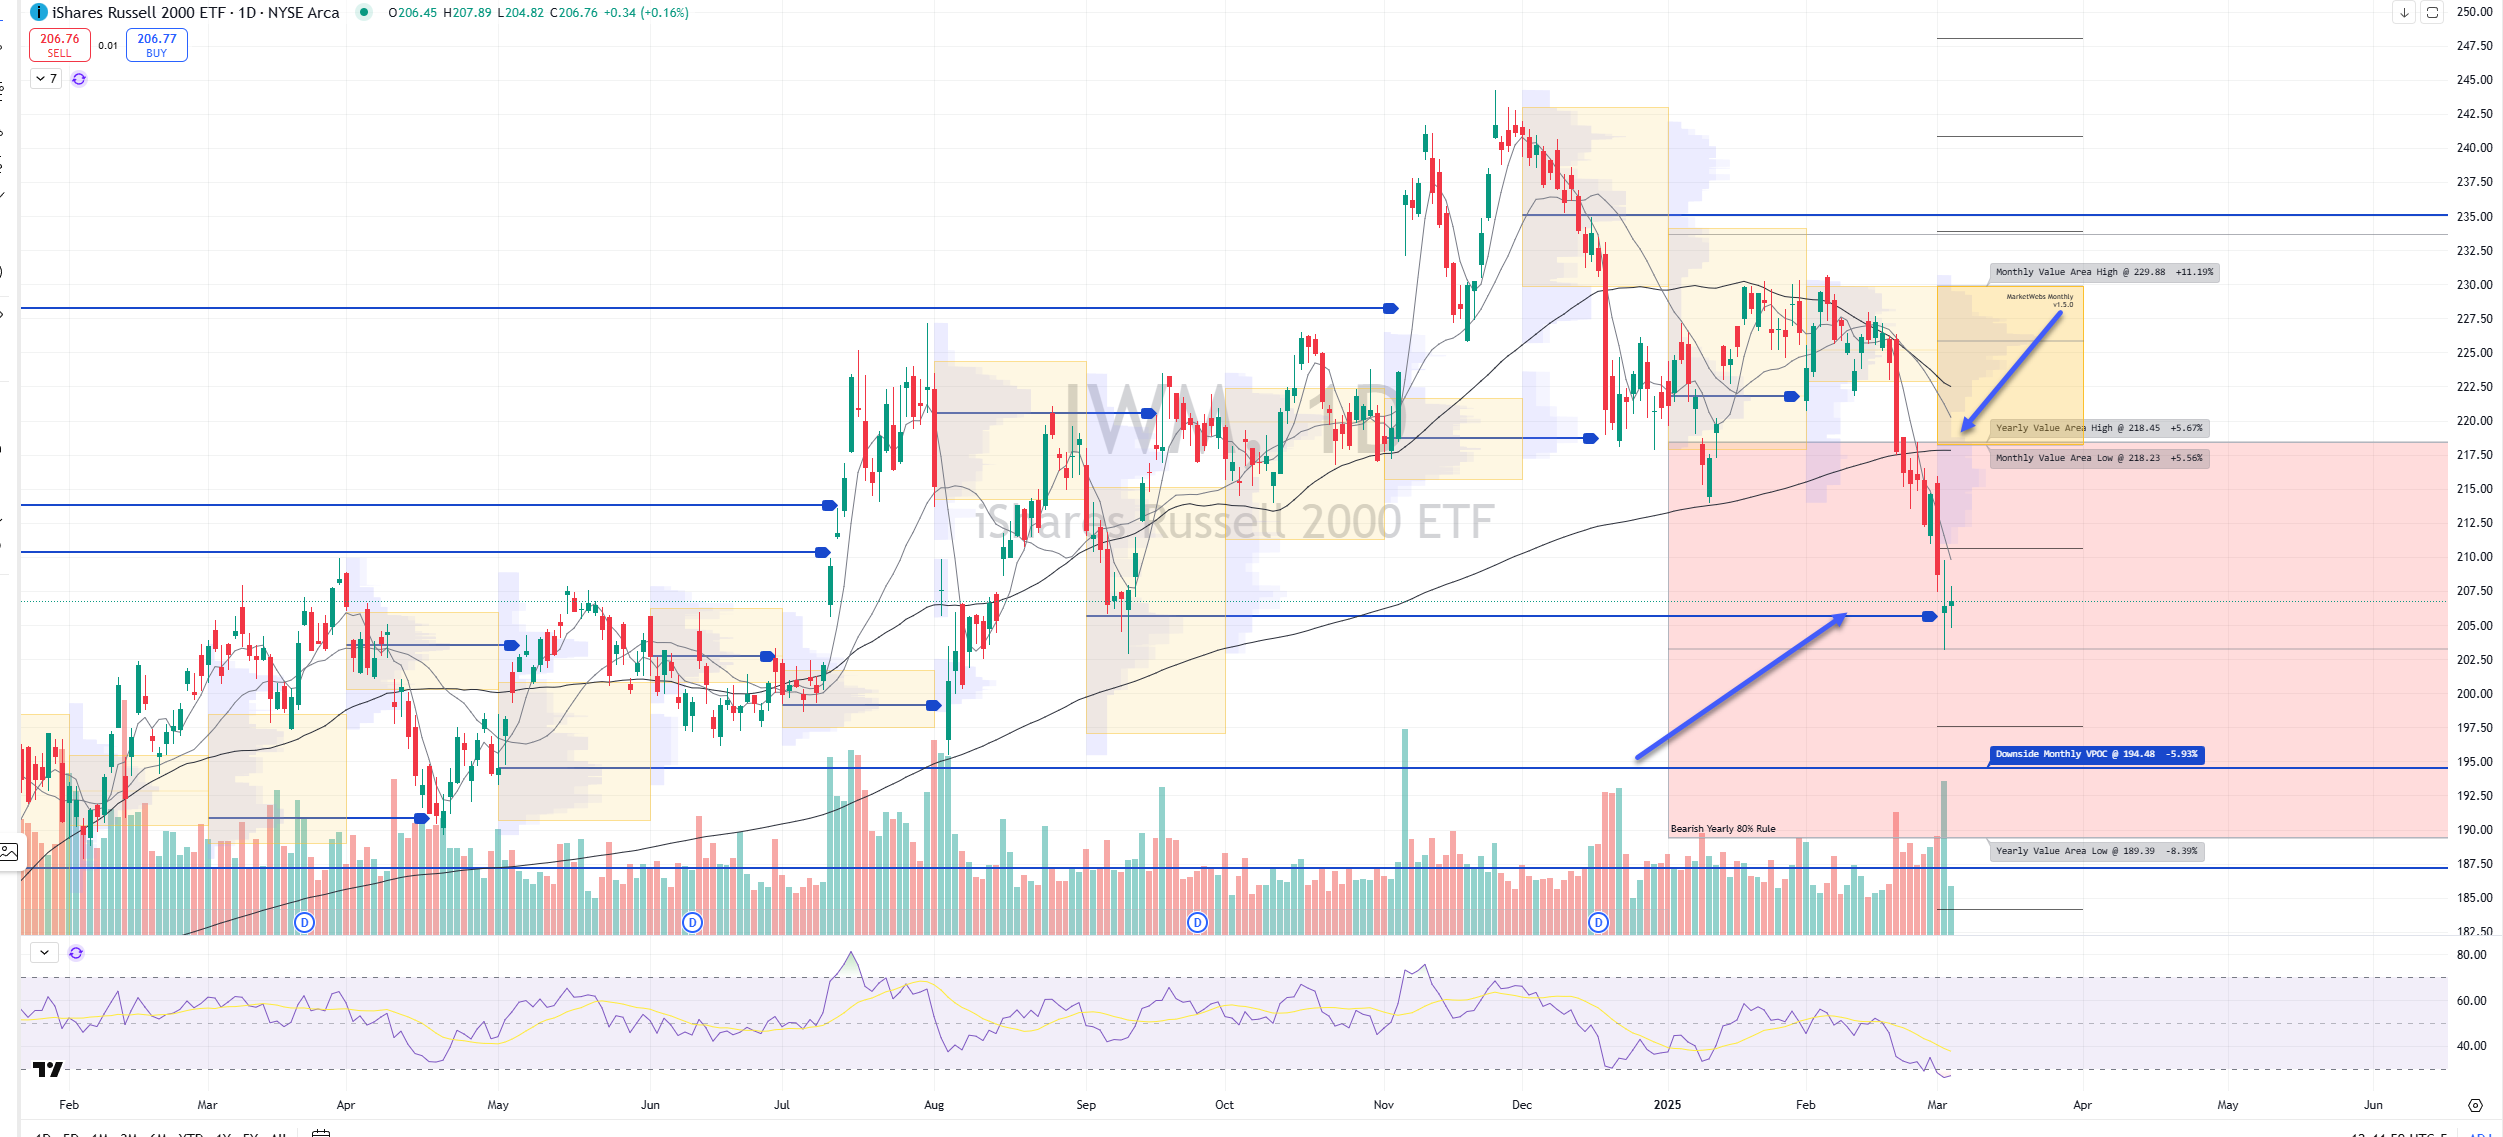
IWM Daily chart (note the Daily Chart contains this month’s Value Area)
Price hanging around VPOC takeout
Note trend remains down here, but could possible see a bounce here
TTG Trading Edge Program
Click Here to be a Full TTG Member
Charts I am watching / Trade Ideas + Position Update
Keep reading with a 7-day free trial
Subscribe to The Tribeca Trade Group to keep reading this post and get 7 days of free access to the full post archives.