


TTG Midday Trading Note 3-4-25 + Charts + Open Positions
Breadth
- 19% Up Volume (and got down to a 13)
- TICKs indicating some heavy selling

Movers (Mkt Cap > $5B)
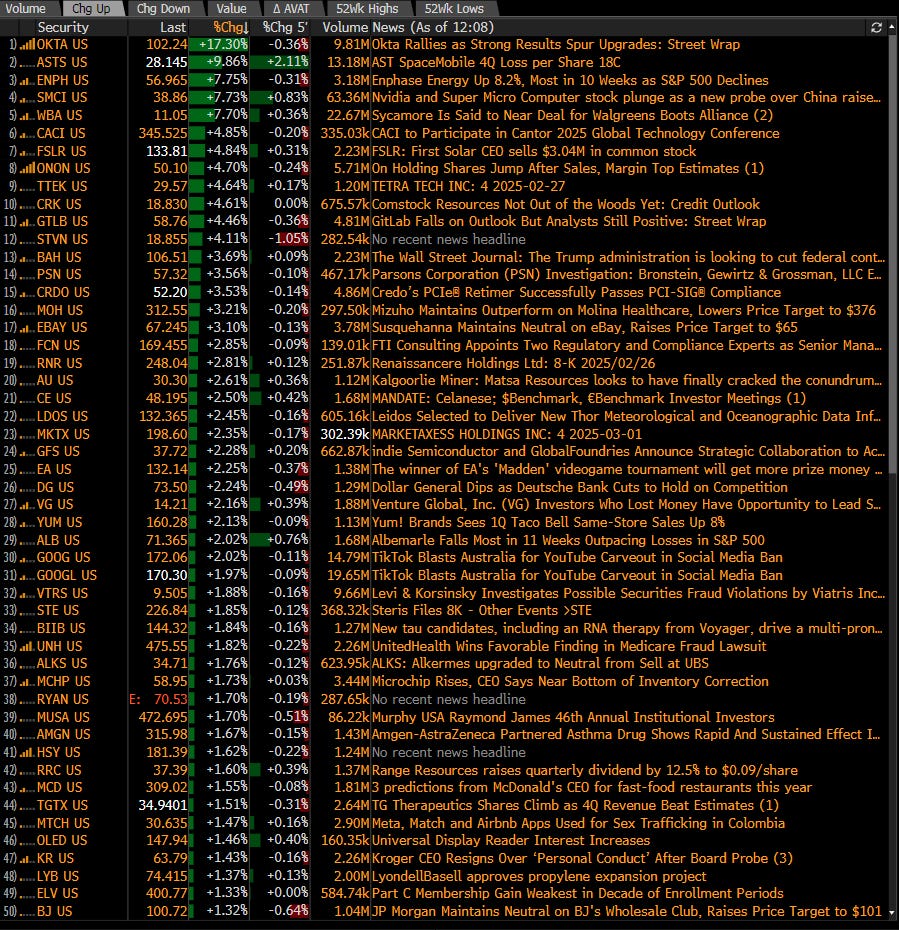
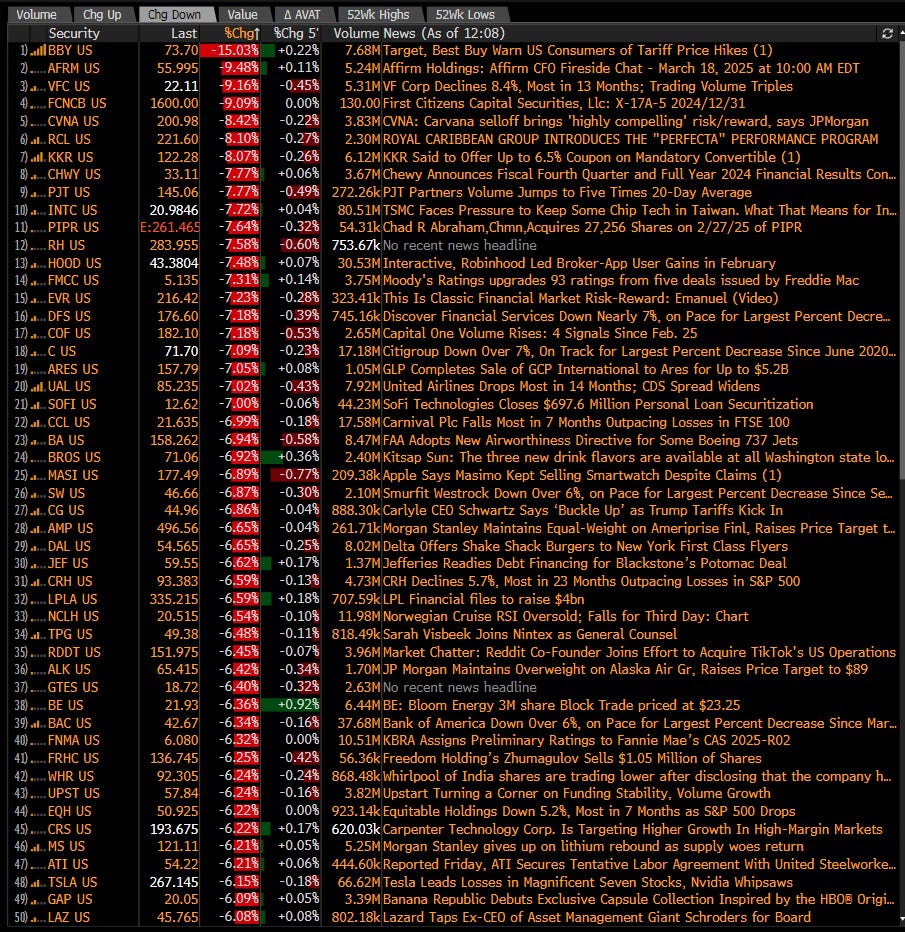
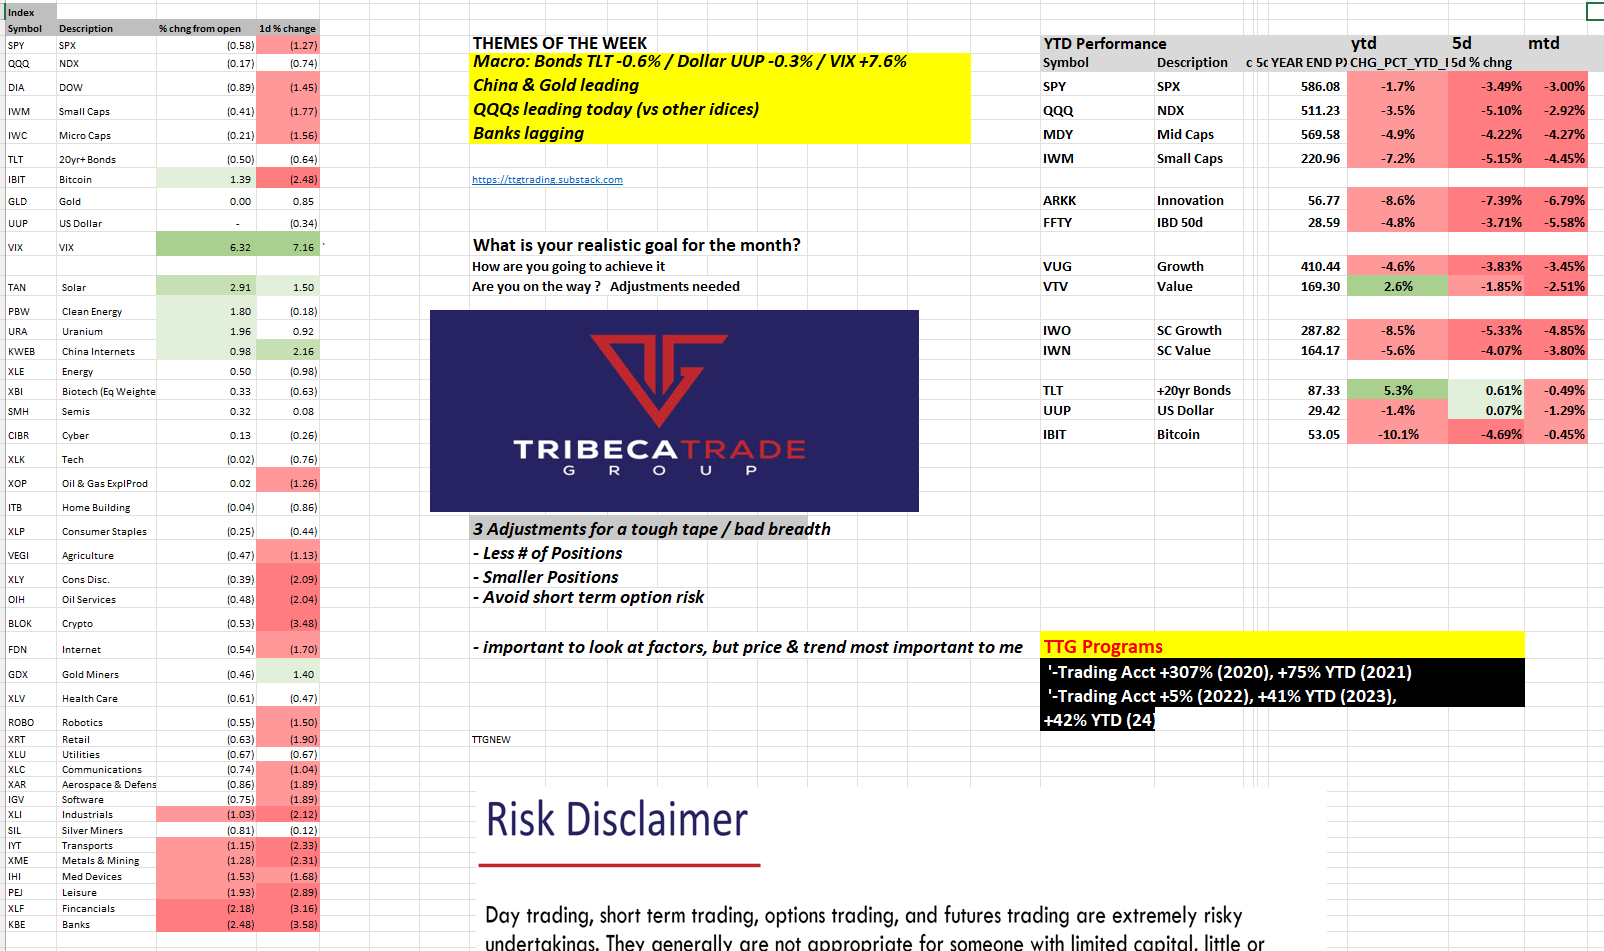
% Change From Open & Themes (see yellow box)
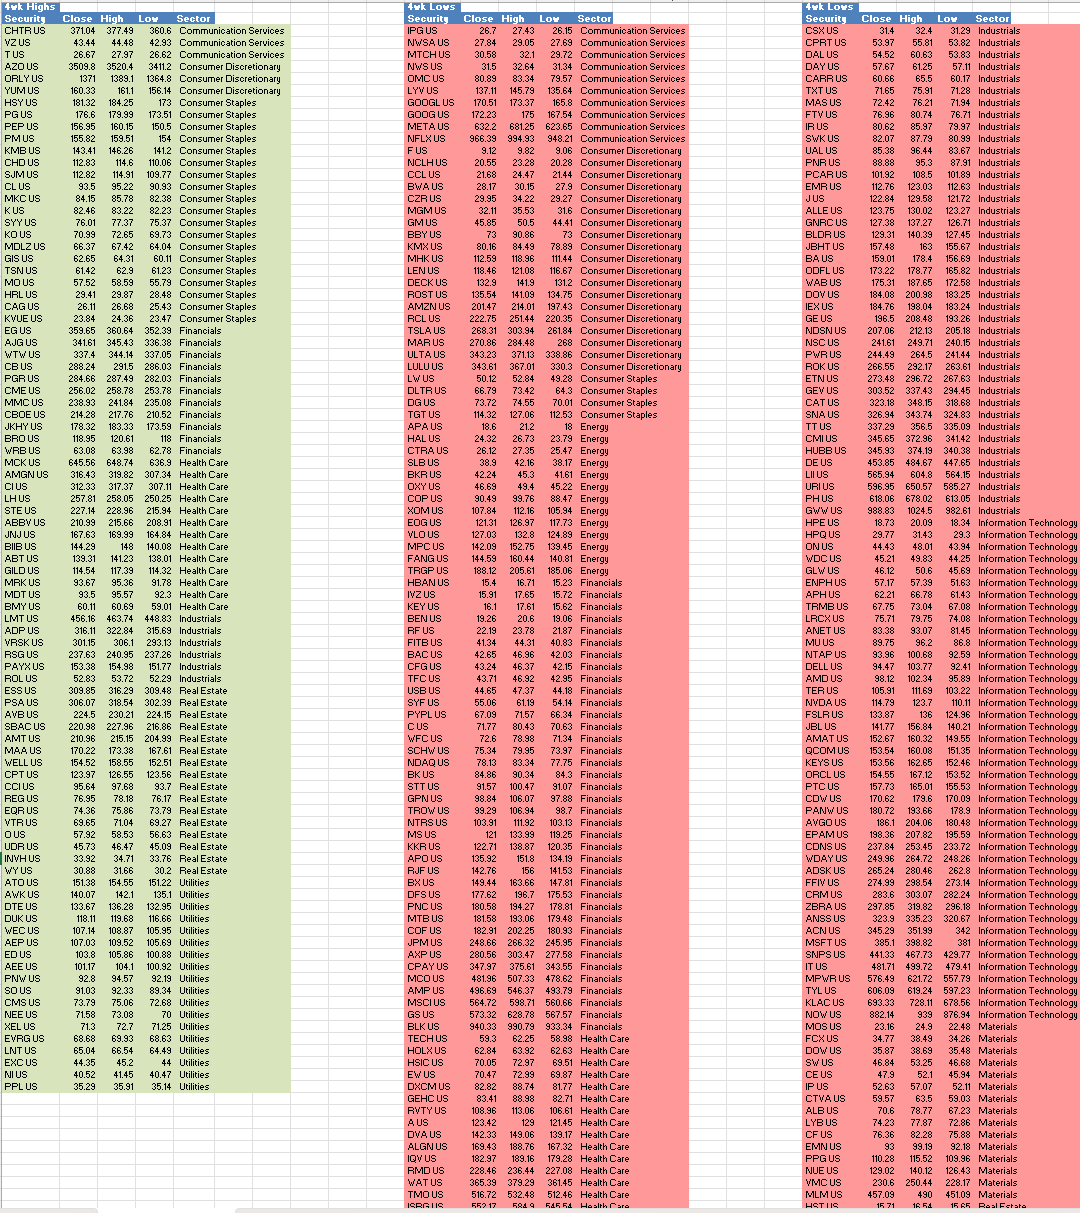
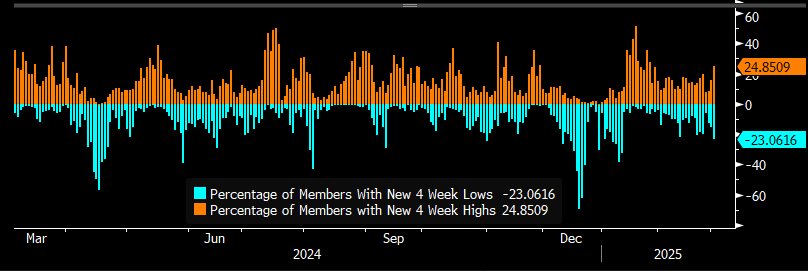
SPX 4wk new highs vs new lows (chart below lags by 1d)
89 new highs today & 205 new lows - big pickup in new LOWS today
At TTG, I use Volume At Price in my chart analysis and I use the MarketWebs Indicator to provide Value Areas & VPOCs which indicate significant support & resistance levels. Learn More Here about Volume At Price and the MarketWebs.

Charts (Trade Ideas in Next Section)
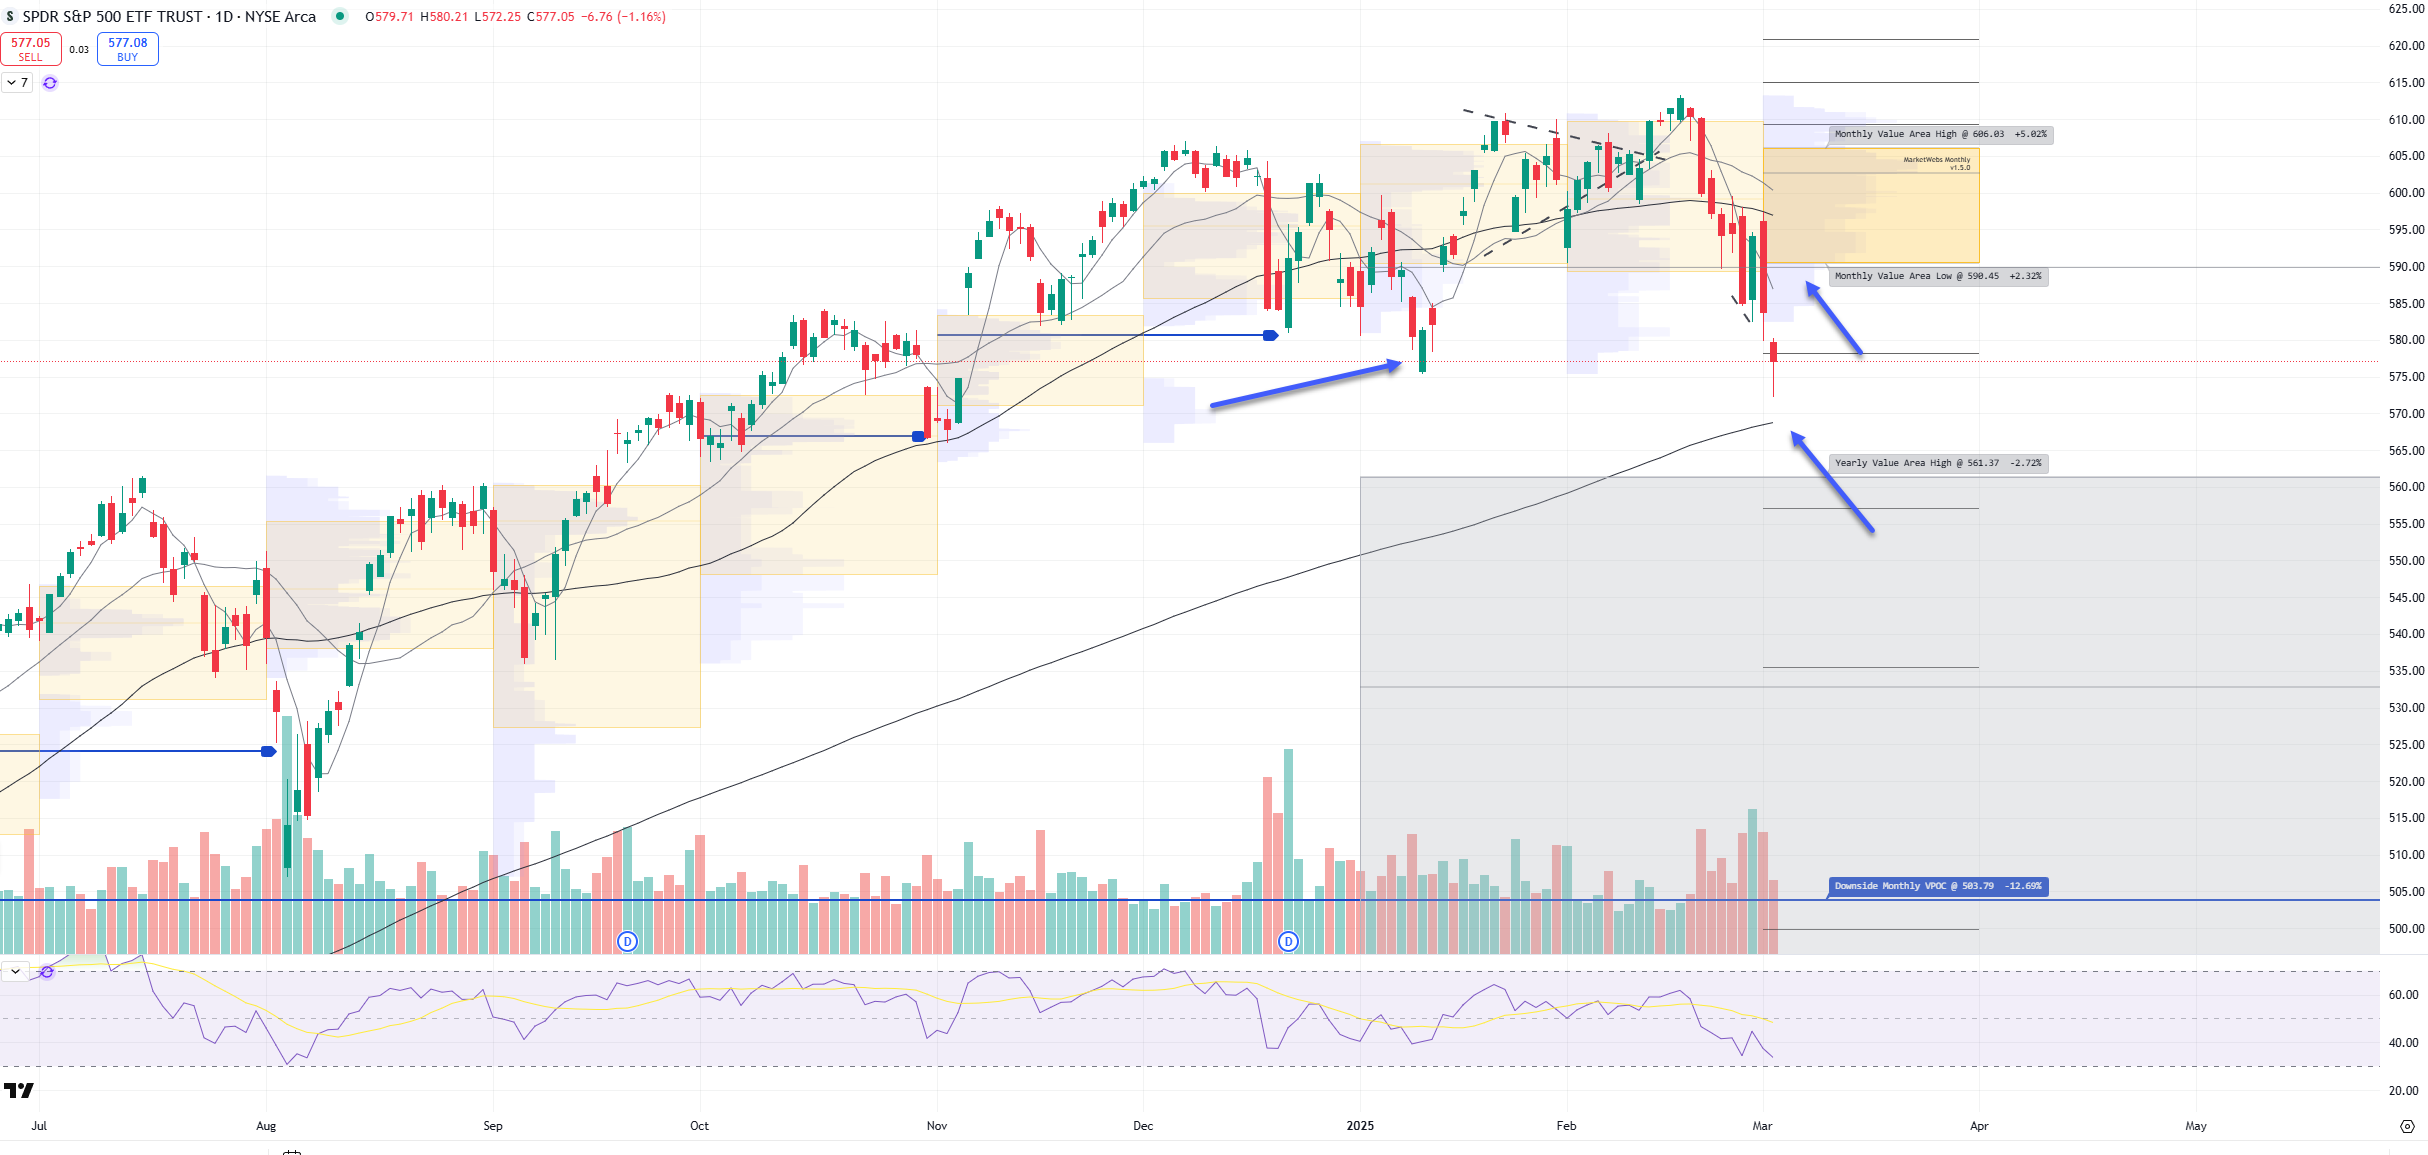
SPY Daily chart (note the Daily Chart contains this month’s Value Area)
Price continuing to move lower this morning, but trying to hold the Jan lows, next level down to watch if that does not hold is 200d MA
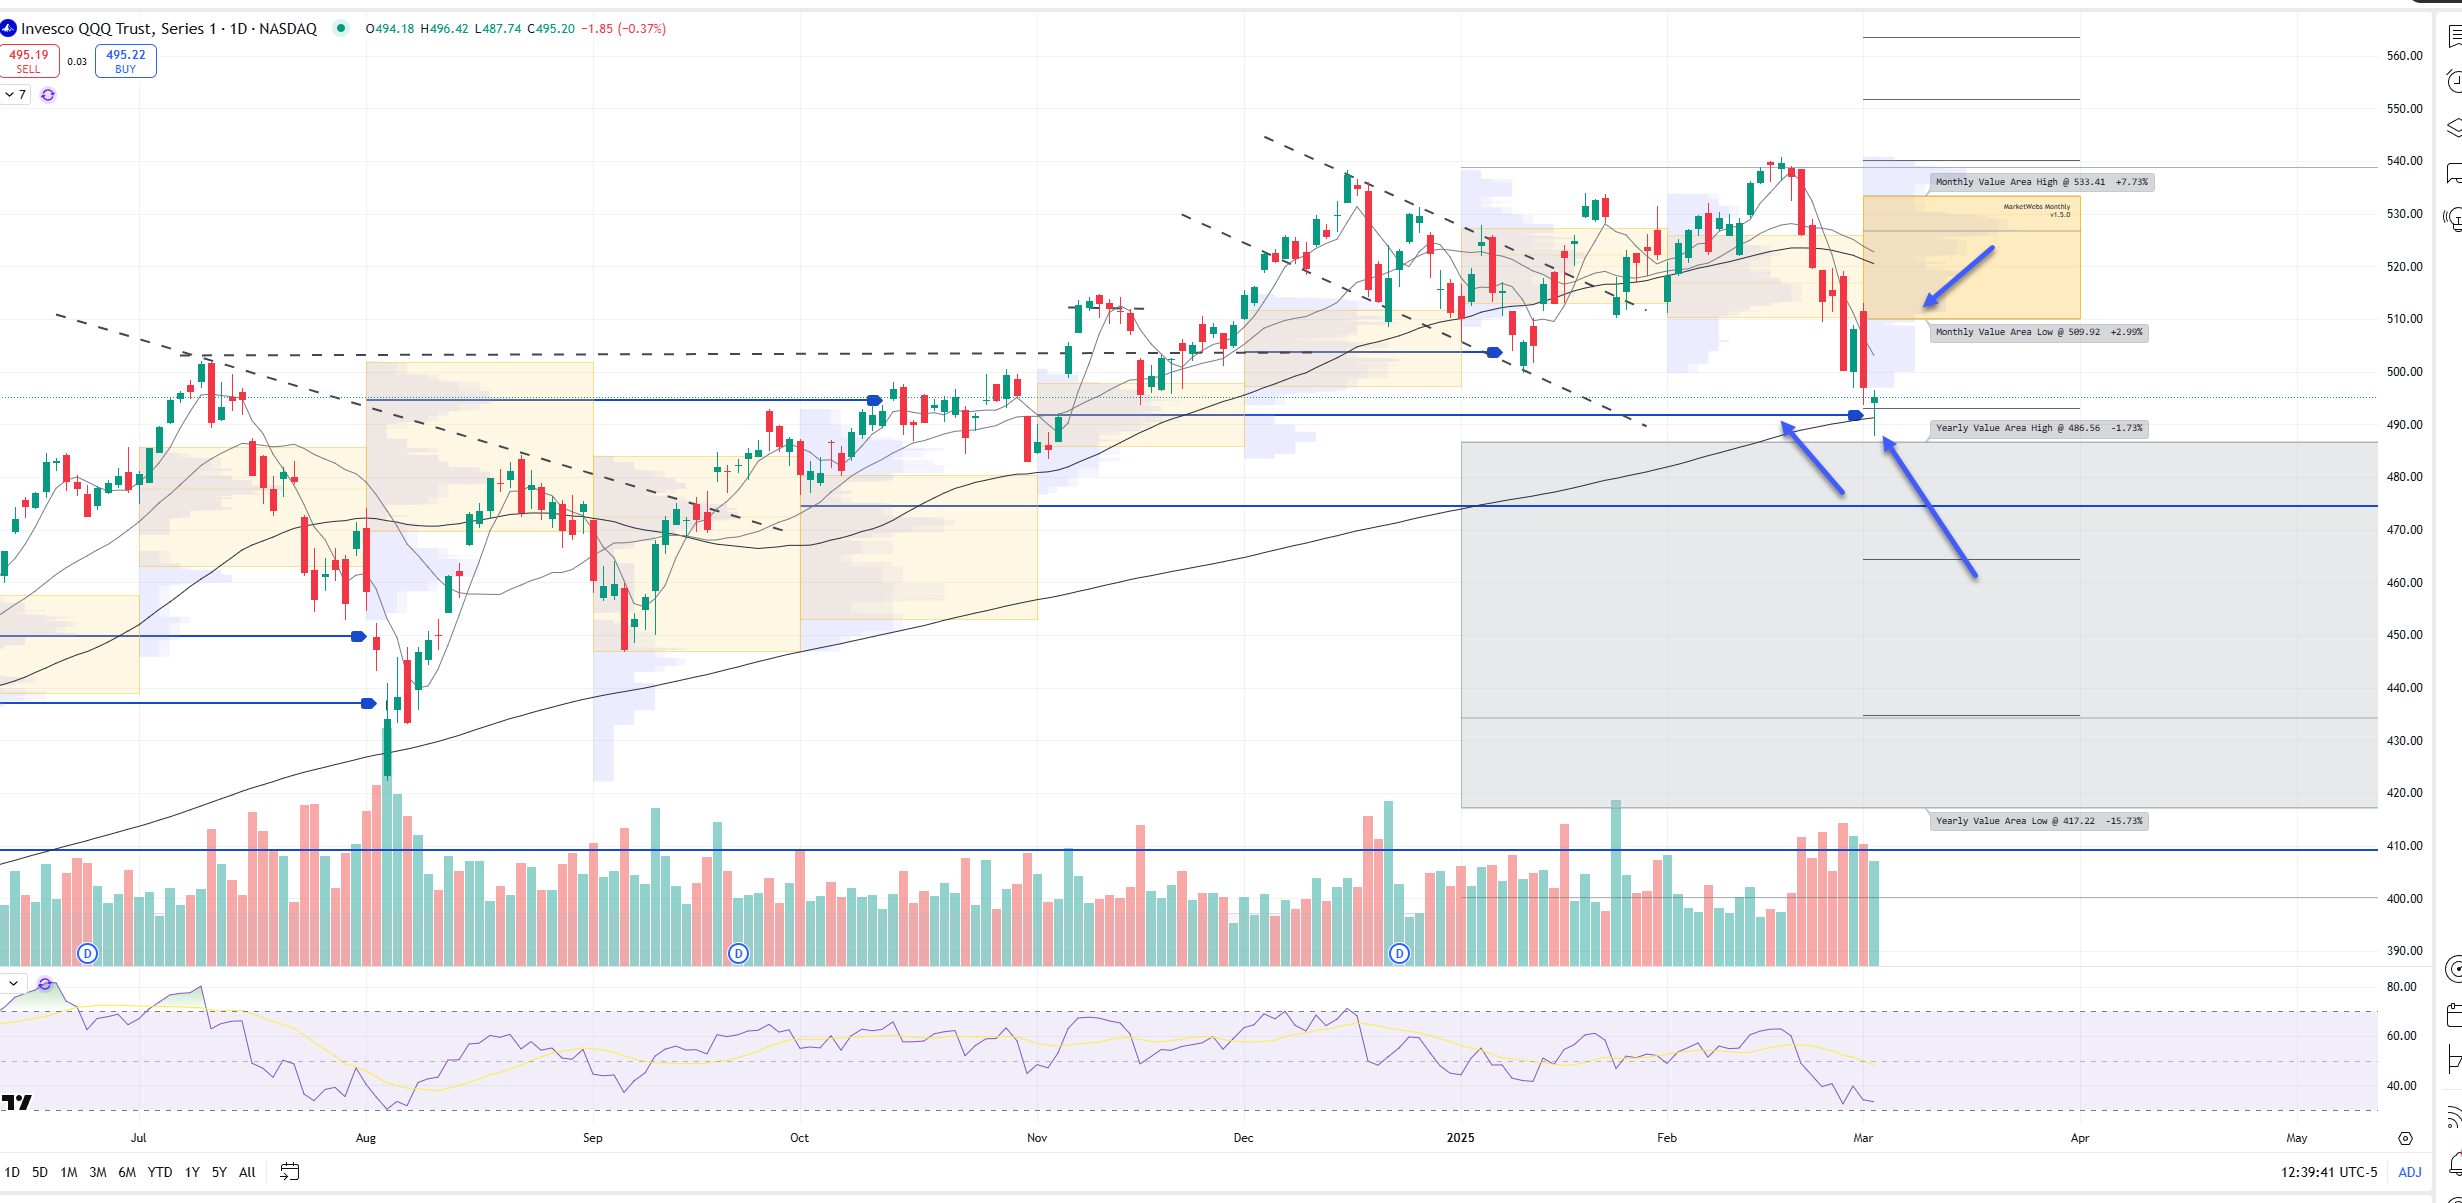
QQQ Daily chart (note the Daily Chart contains this month’s Value Area)
Price fell all the way down to the top of the ‘25 Value Area, $486.56 and bounced. Price also took out a lower VPOC (blue line) and is trying to hold that level. Remember, lower VPOCs are where buyers / demand may show up
Note, price is still way below 50d MA and Mar Value Area
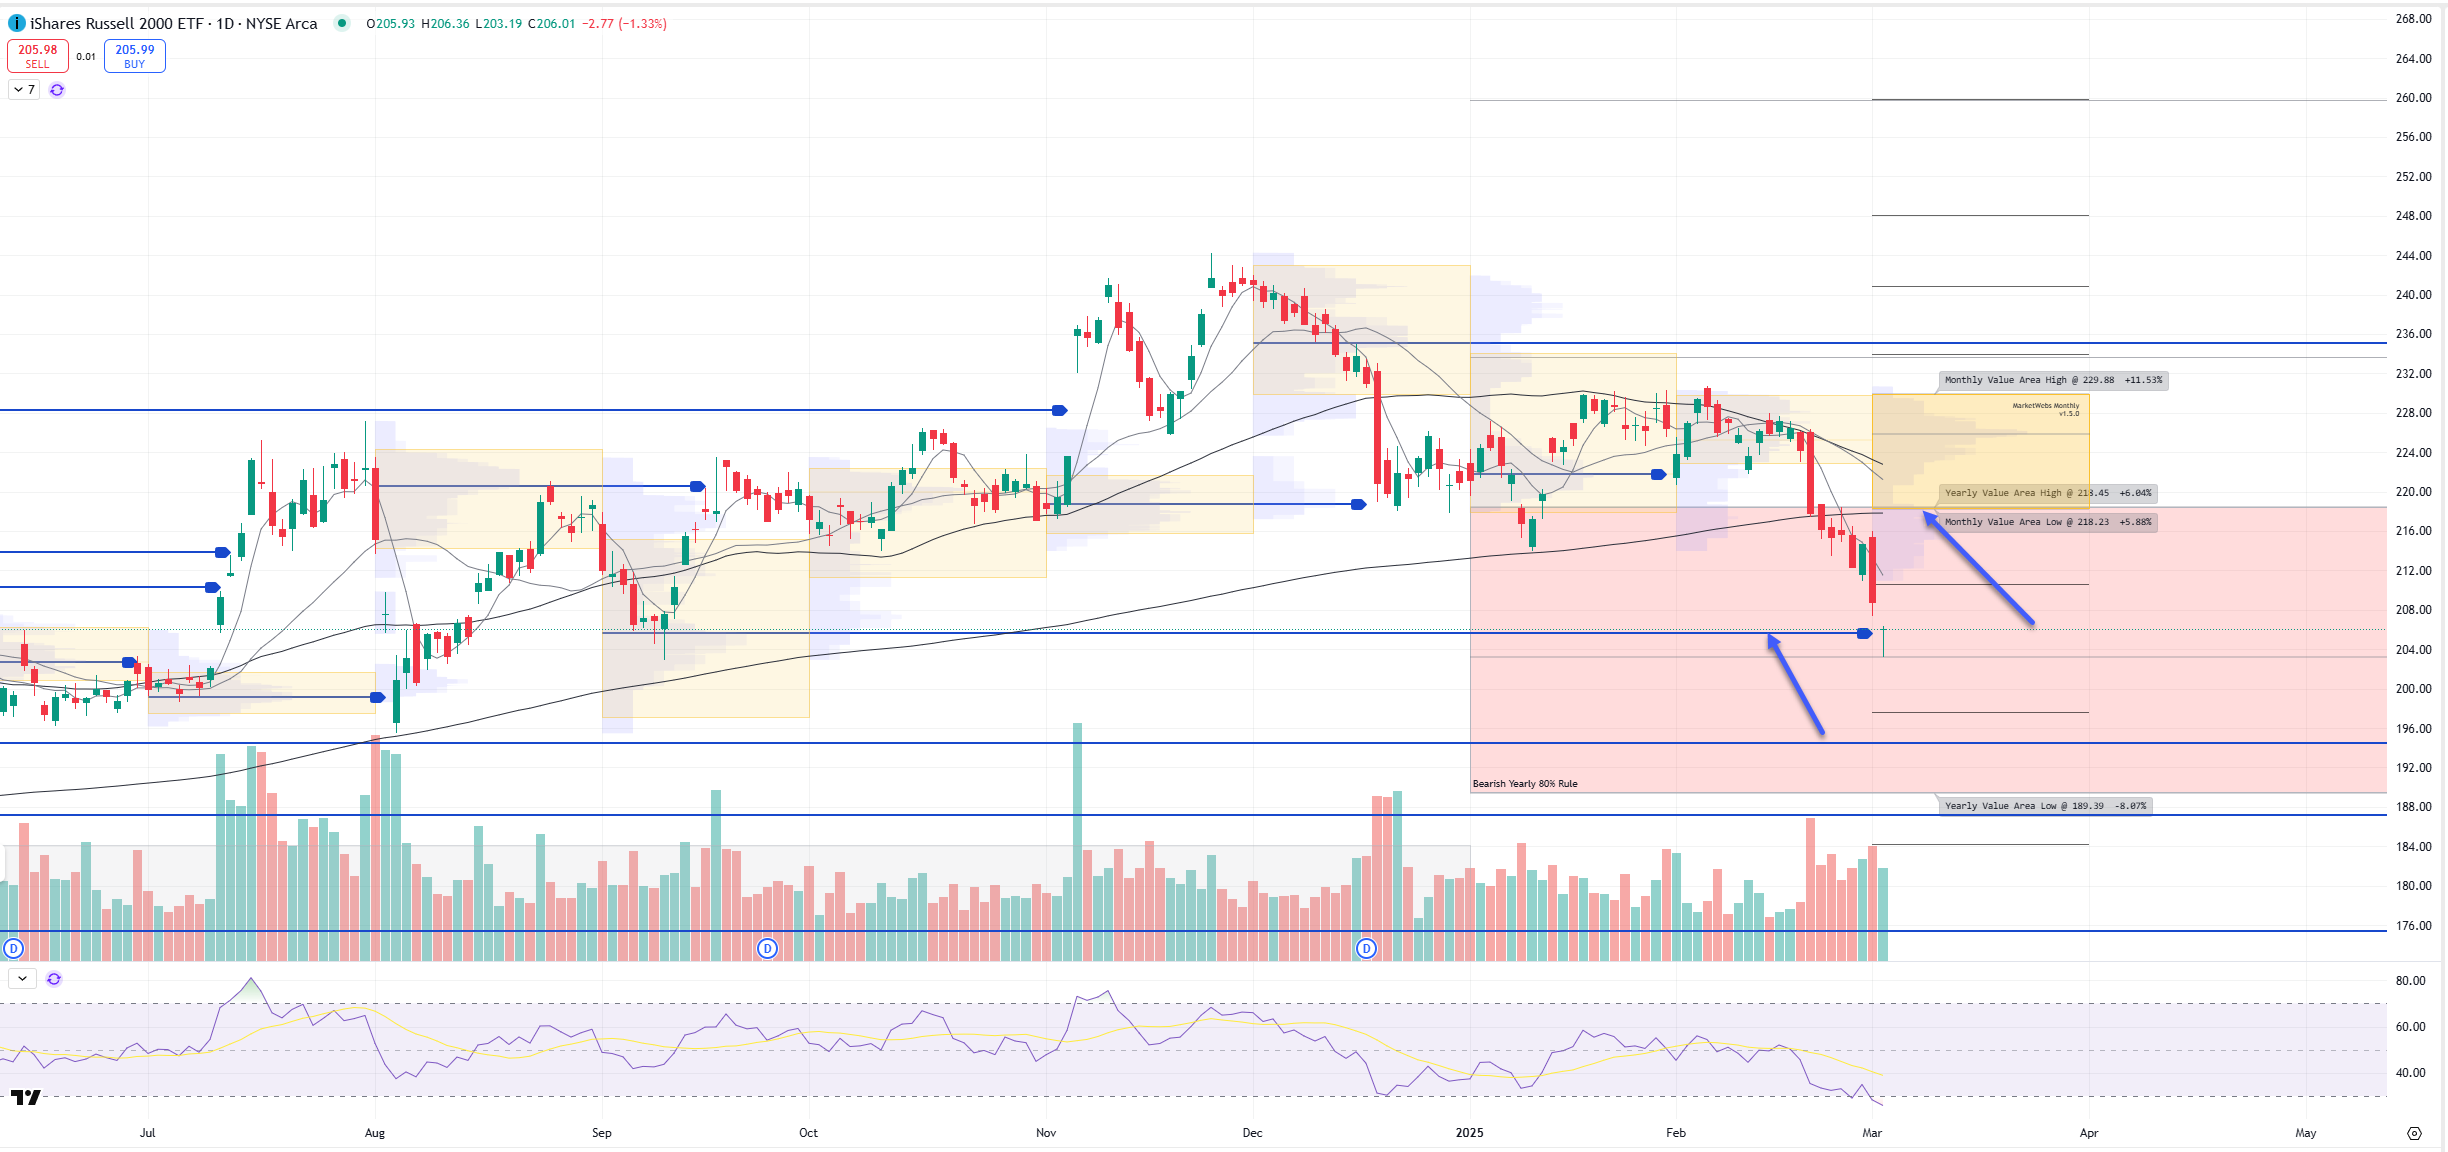
IWM Daily chart (note the Daily Chart contains this month’s Value Area)
Price fell down to lower VPOC and is trying to hold, watch $205.5
Note trend remains down here, but could possible see a bounce here
TTG Trading Edge Program
Click Here to be a Full TTG Member
Charts I am watching / Trade Ideas + Position Update
Keep reading with a 7-day free trial
Subscribe to The Tribeca Trade Group to keep reading this post and get 7 days of free access to the full post archives.