


TTG Midday Trading Note 3-10-25 + Charts + Open Positions
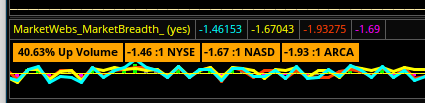
Breadth
- 41% Up Volume - poor market breadth , but has improved from 1st hour of day
- TICKs have also improved from worst levels but still not great
Movers (Mkt Cap > $5B)
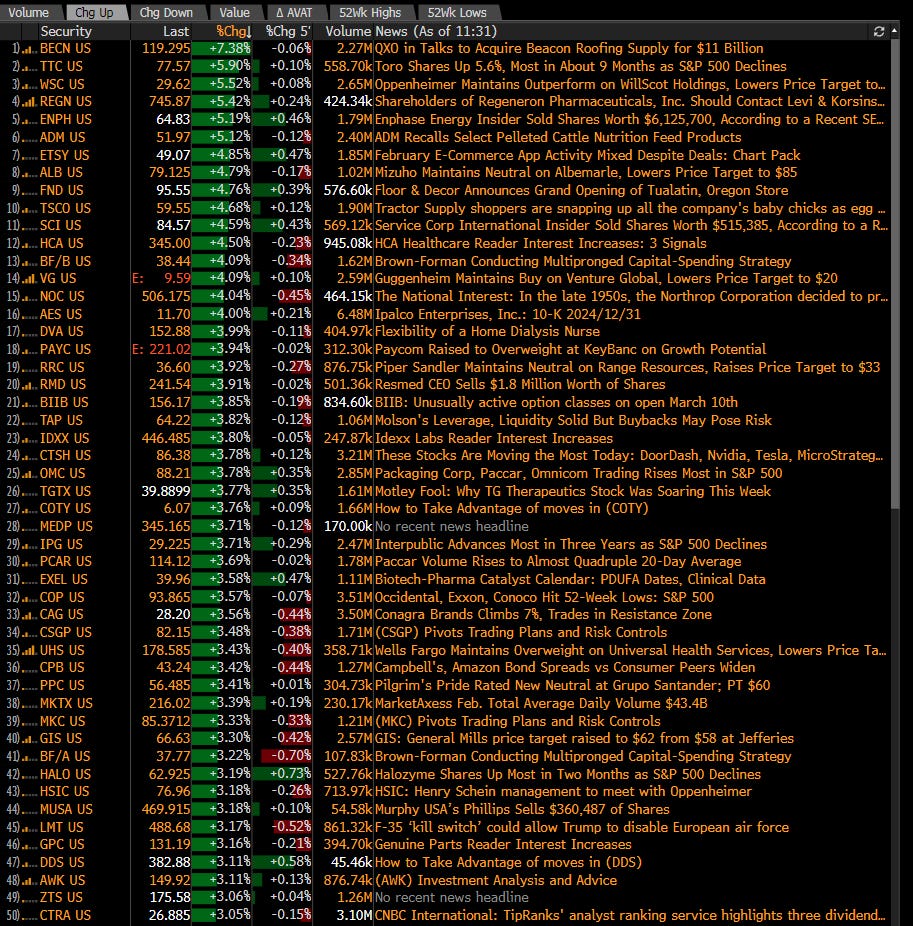

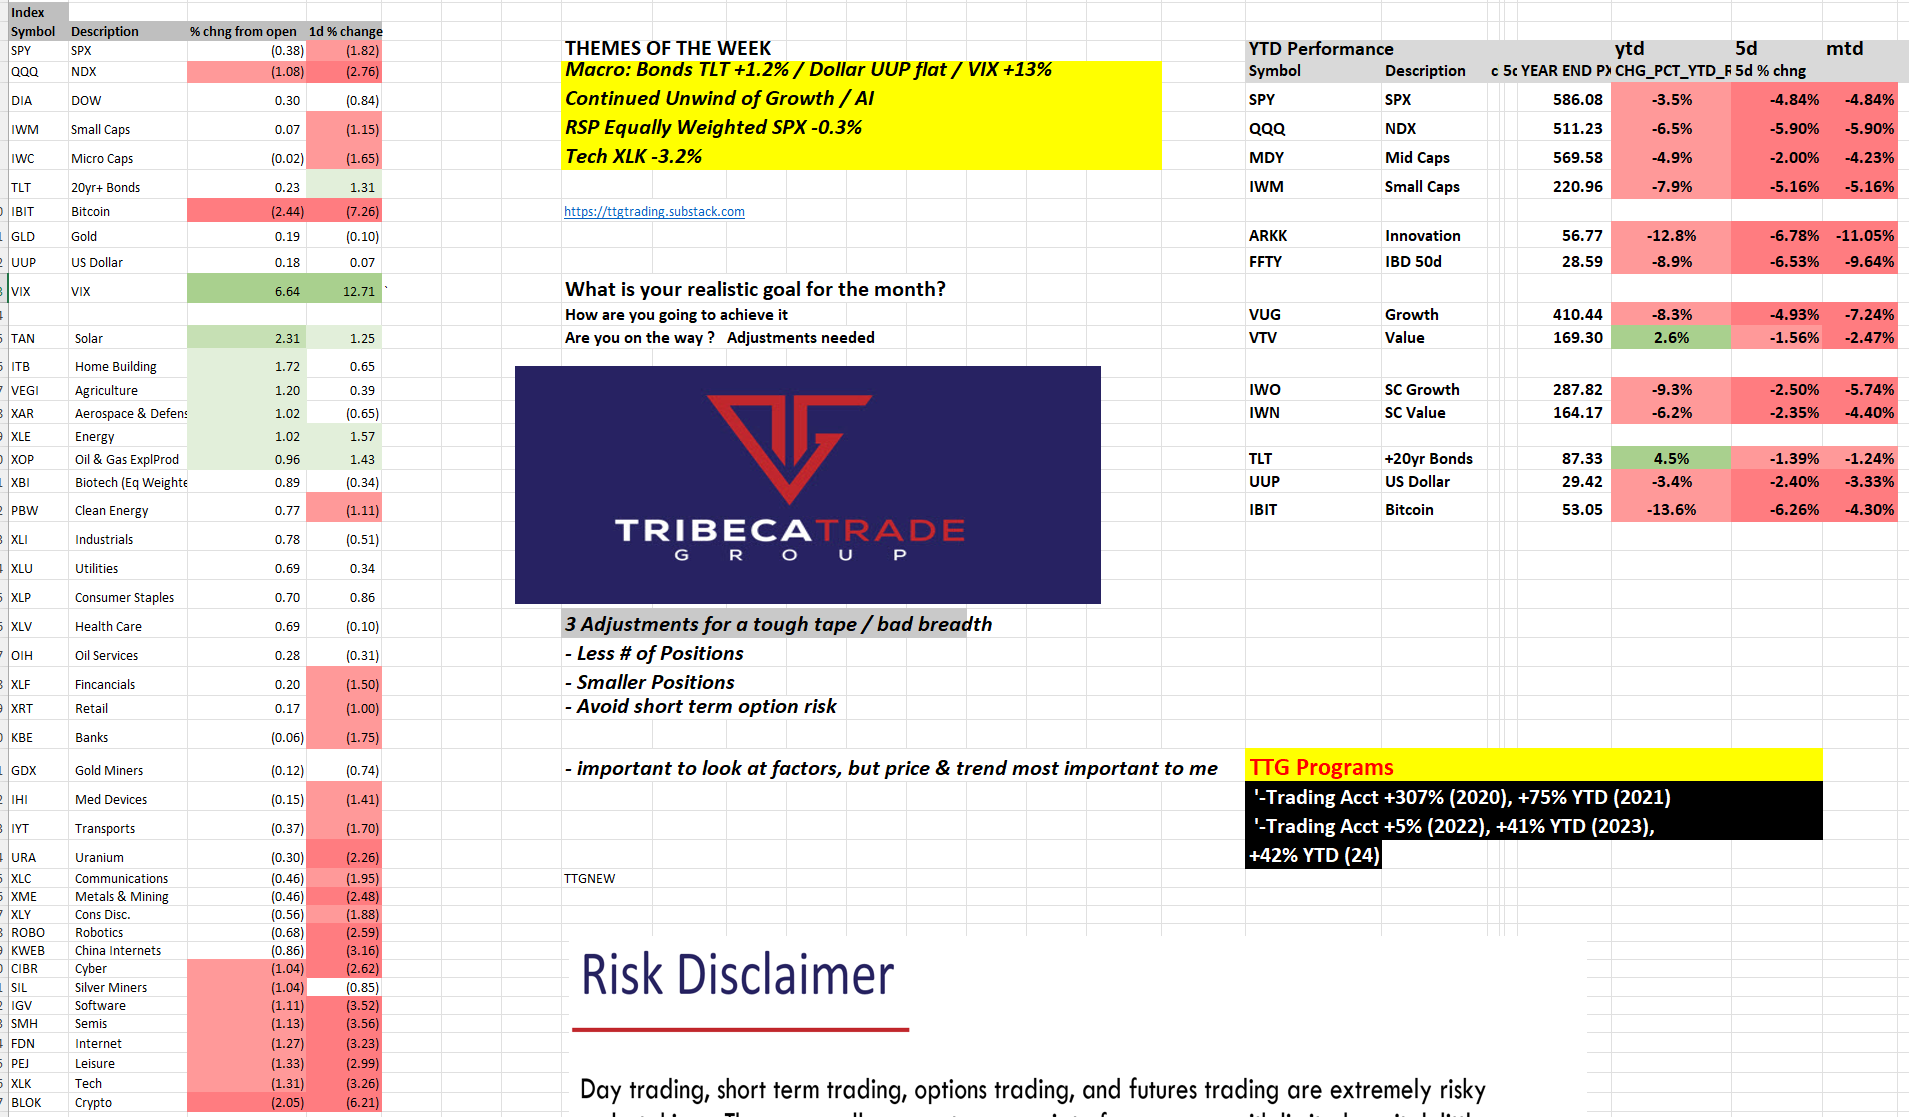
% Change From Open & Themes (see yellow box)
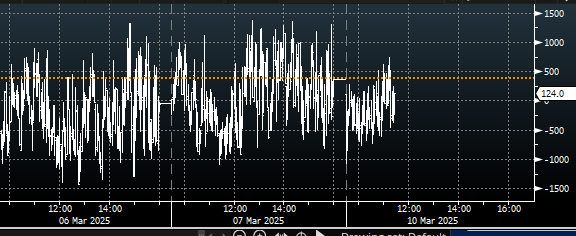
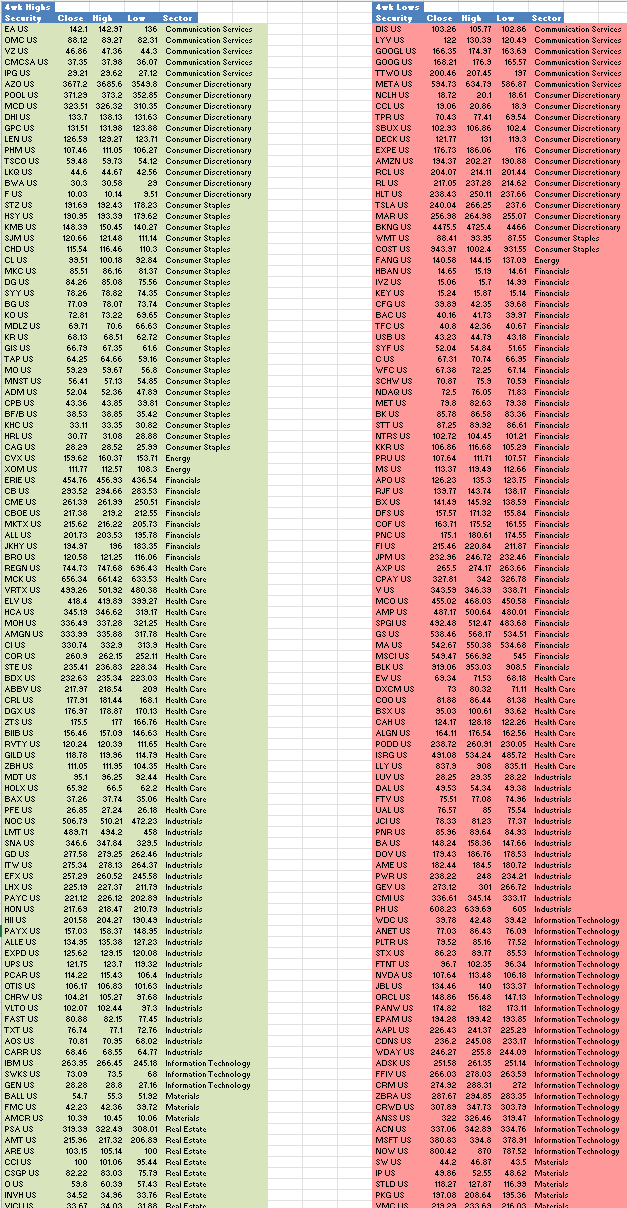
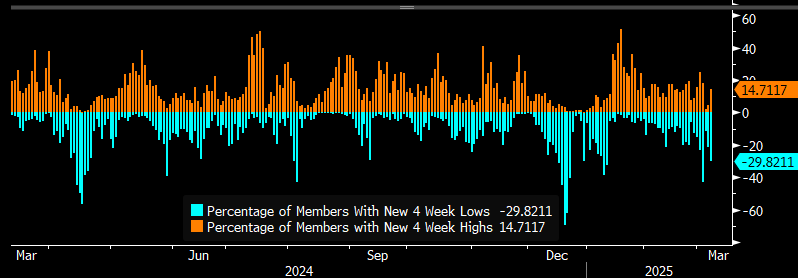
SPX 4wk new highs vs new lows (chart below lags by 1d)
116 new highs today & 117 new lows
this major separation inside the SPX
At TTG, I use Volume At Price in my chart analysis and I use the MarketWebs Indicator to provide Value Areas & VPOCs which indicate significant support & resistance levels. Learn More Here about Volume At Price and the MarketWebs.

Charts (Trade Ideas in Next Section)
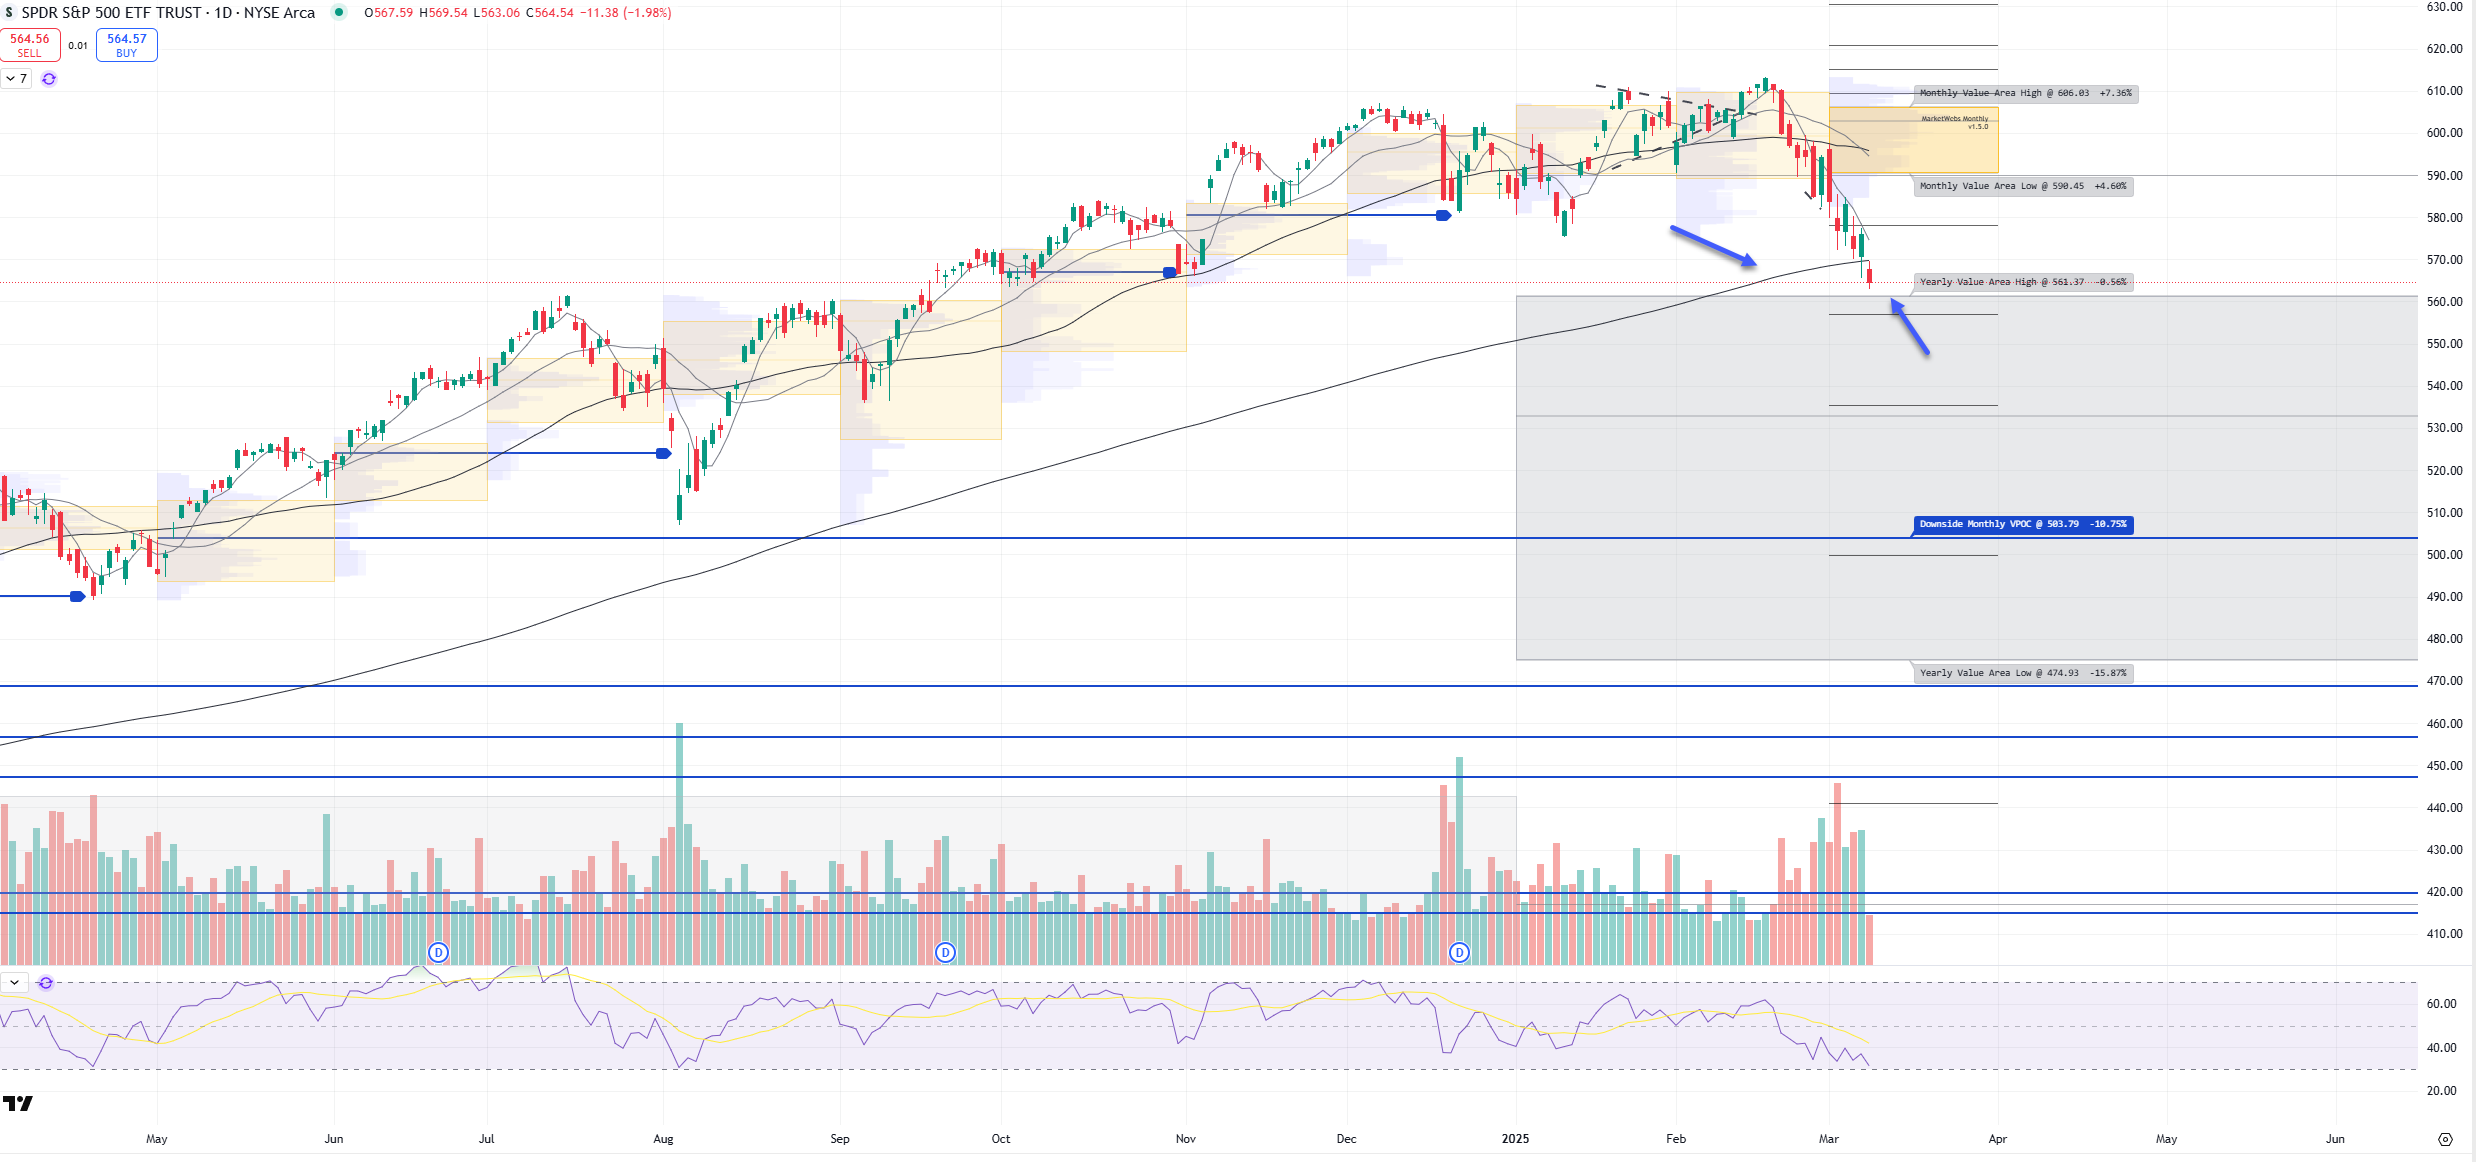
SPY Daily chart (note the Daily Chart contains this month’s Value Area)
Price moving closer to its top of Yearly Value Area, watch $561.37 support and also note price is now below its 200d MA
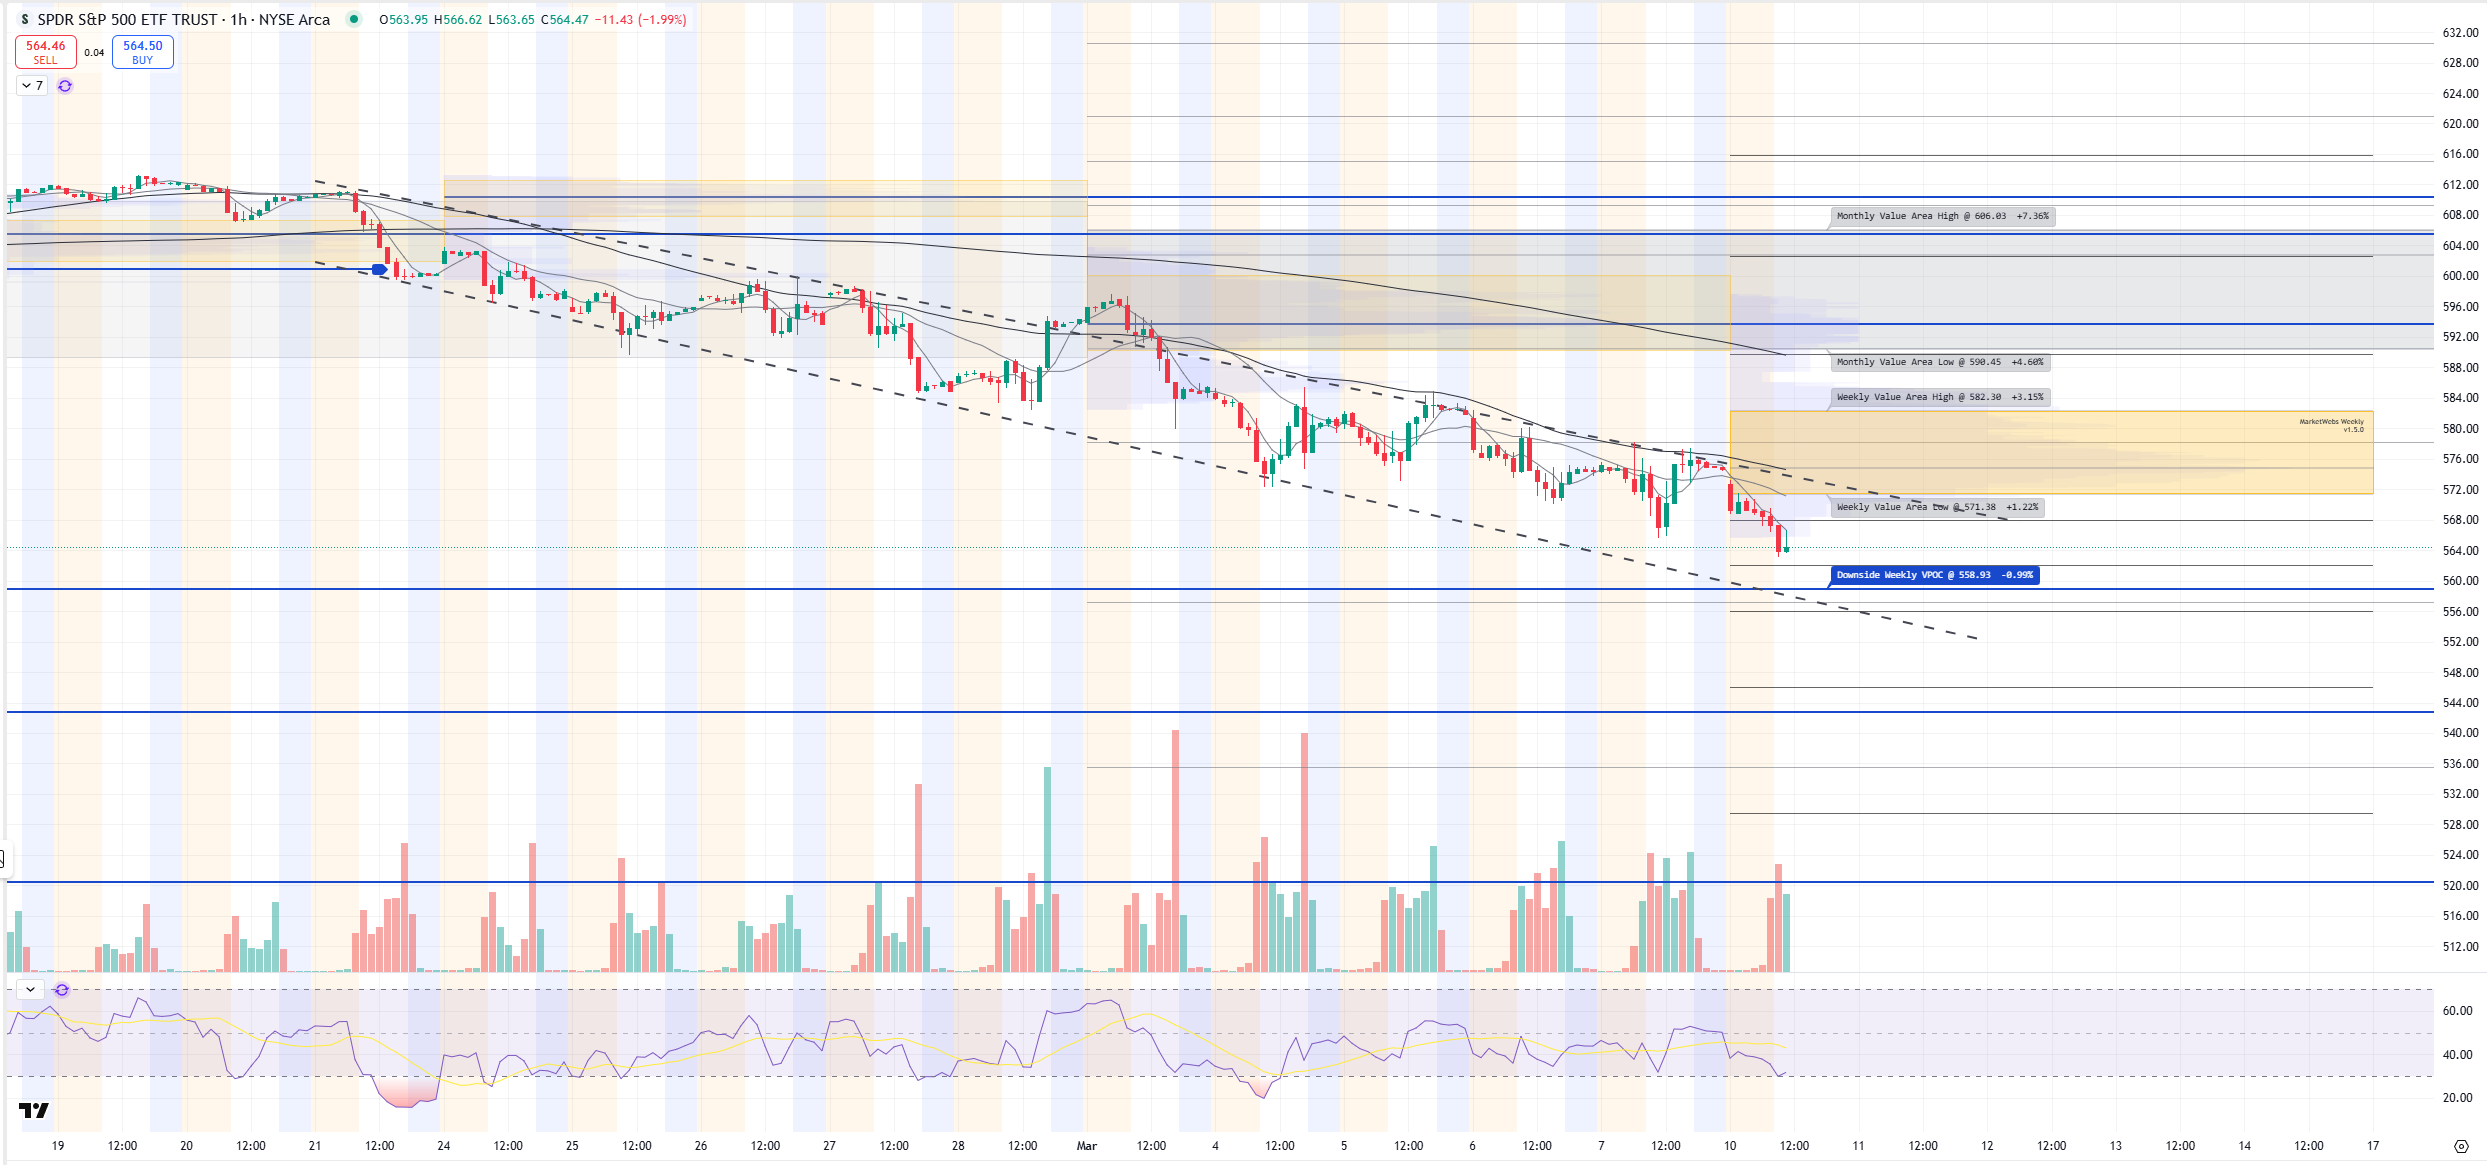
1hr chart (2nd chart) notice how well price is honoring downward channel trend last few weeks…
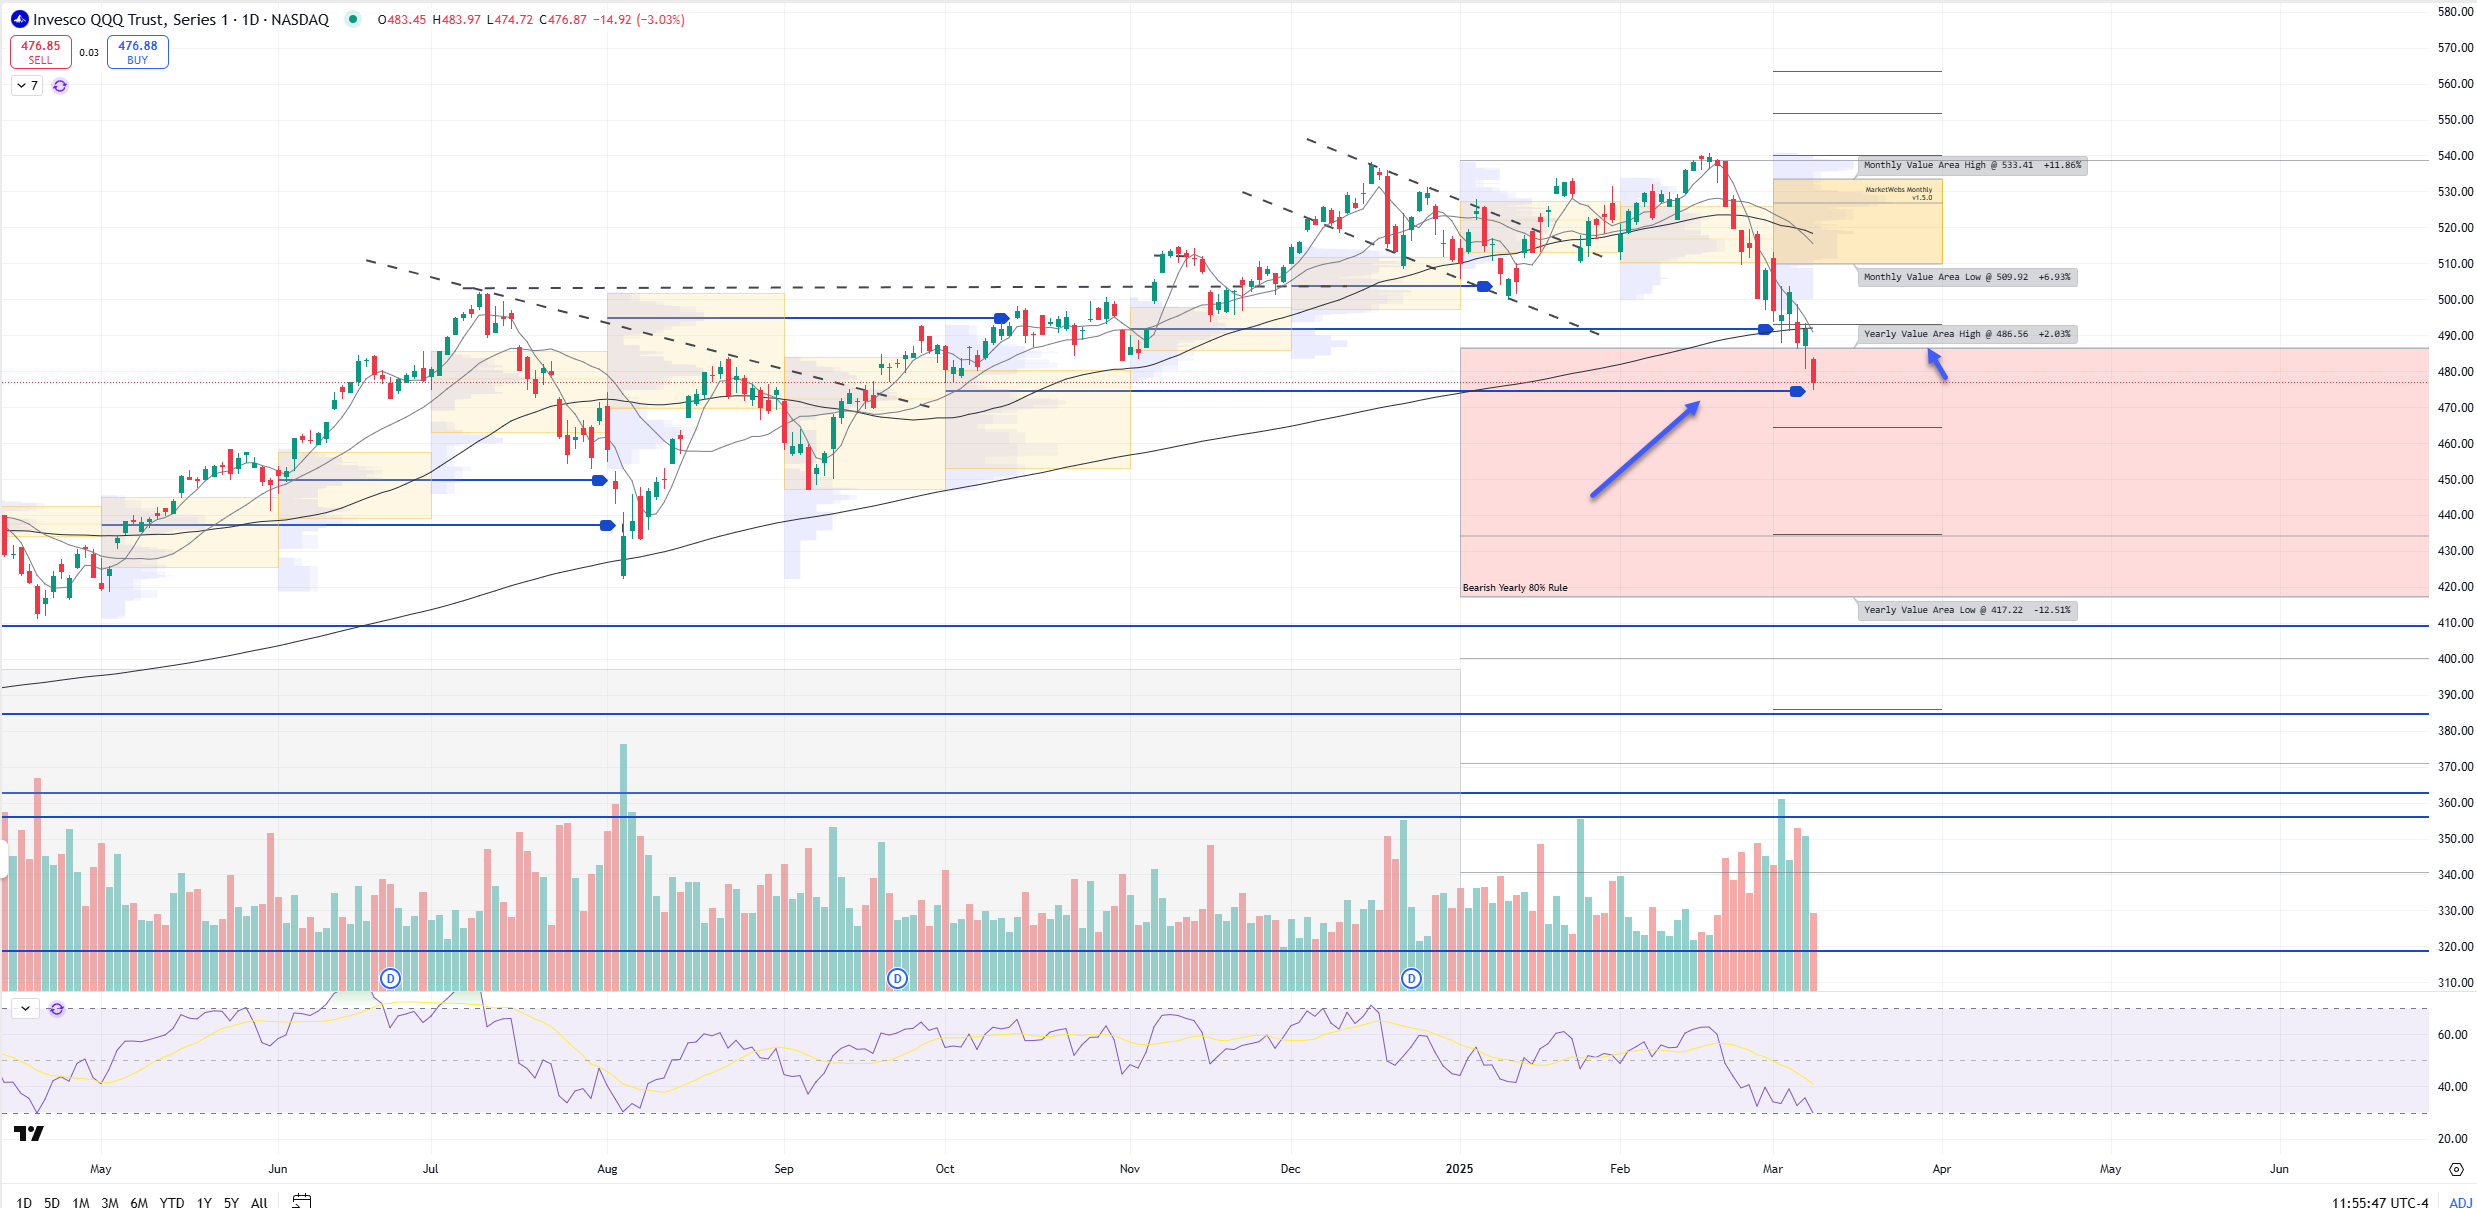
QQQ Daily chart (note the Daily Chart contains this month’s Value Area)
Price is now INSIDE its ‘25 Value Area and if price cannot regain $486.56 then the #bearish 80% rule is triggered. Also, not downside VPOC (blue line) has been taken out, so a logical place for a bounce., BUT keep in mind the trend has begun to change here so watch top of value
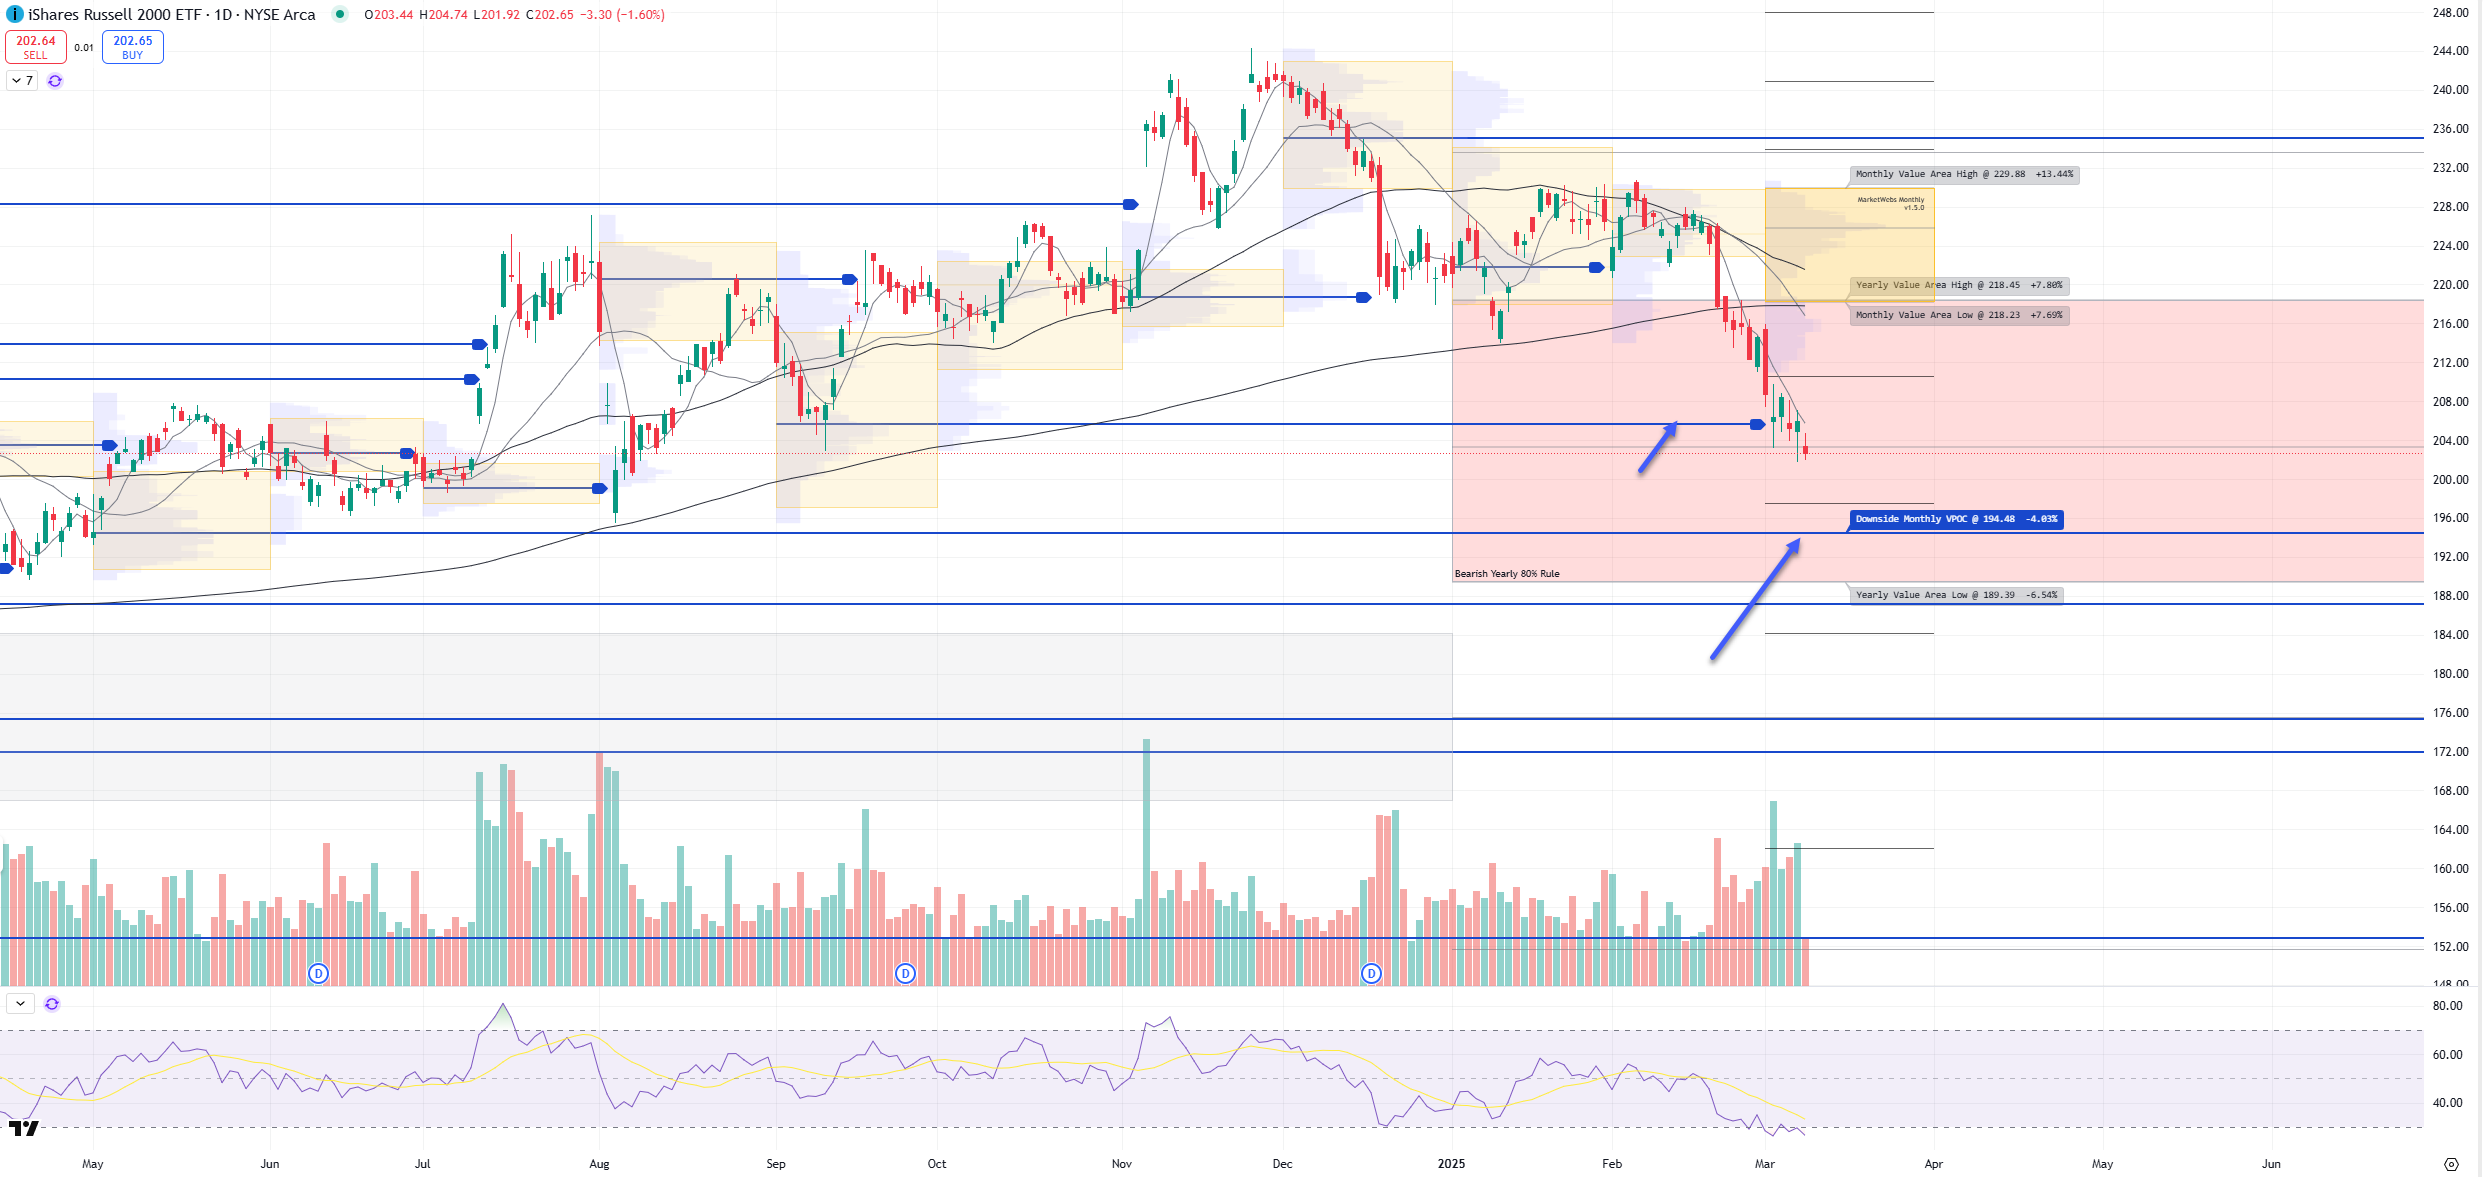
IWM Daily chart (note the Daily Chart contains this month’s Value Area)
Price moving below that VPOC from last week
Trend remains down
TTG Trading Edge Program
Click Here to be a Full TTG Member
Charts I am watching / Trade Ideas + Position Update
Keep reading with a 7-day free trial
Subscribe to The Tribeca Trade Group to keep reading this post and get 7 days of free access to the full post archives.