TTG Market Observations & Charts 02-21-23
Quick observations
- Breadth horrible
- Bonds TLT -1.4%
- US Dollar +0.2%
- VIX +15% 23
- Crude -0.1% Nat Gas -7.5%
- Bitcoin -1.4% Ether -2.6%
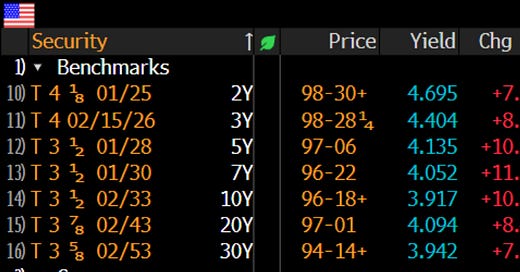
Bottom Line: Yields once again moving higher (across the entire curve) and applying pressure to equities. The S&P and Russell Small Caps indices have broken into their Feb Value Area. Next major support for S&P and NDX is the 200d MA and for the Russell Small Caps (see charts below). Market Breadth is horrible which is confirming the price action. For me, being more defensive here makes sense until breadth improves and /or support is recached .
Market Breadth Indicator
% change from open
over $5B market cap company movers (via Bloomberg)
Charts
$ES_F S&P futures Daily chart:
Price broke into the Feb Value Area (bearish signal) and next support is the 50d & 200d MA. If that does not hold bottom of thr Feb Value Area is 3905
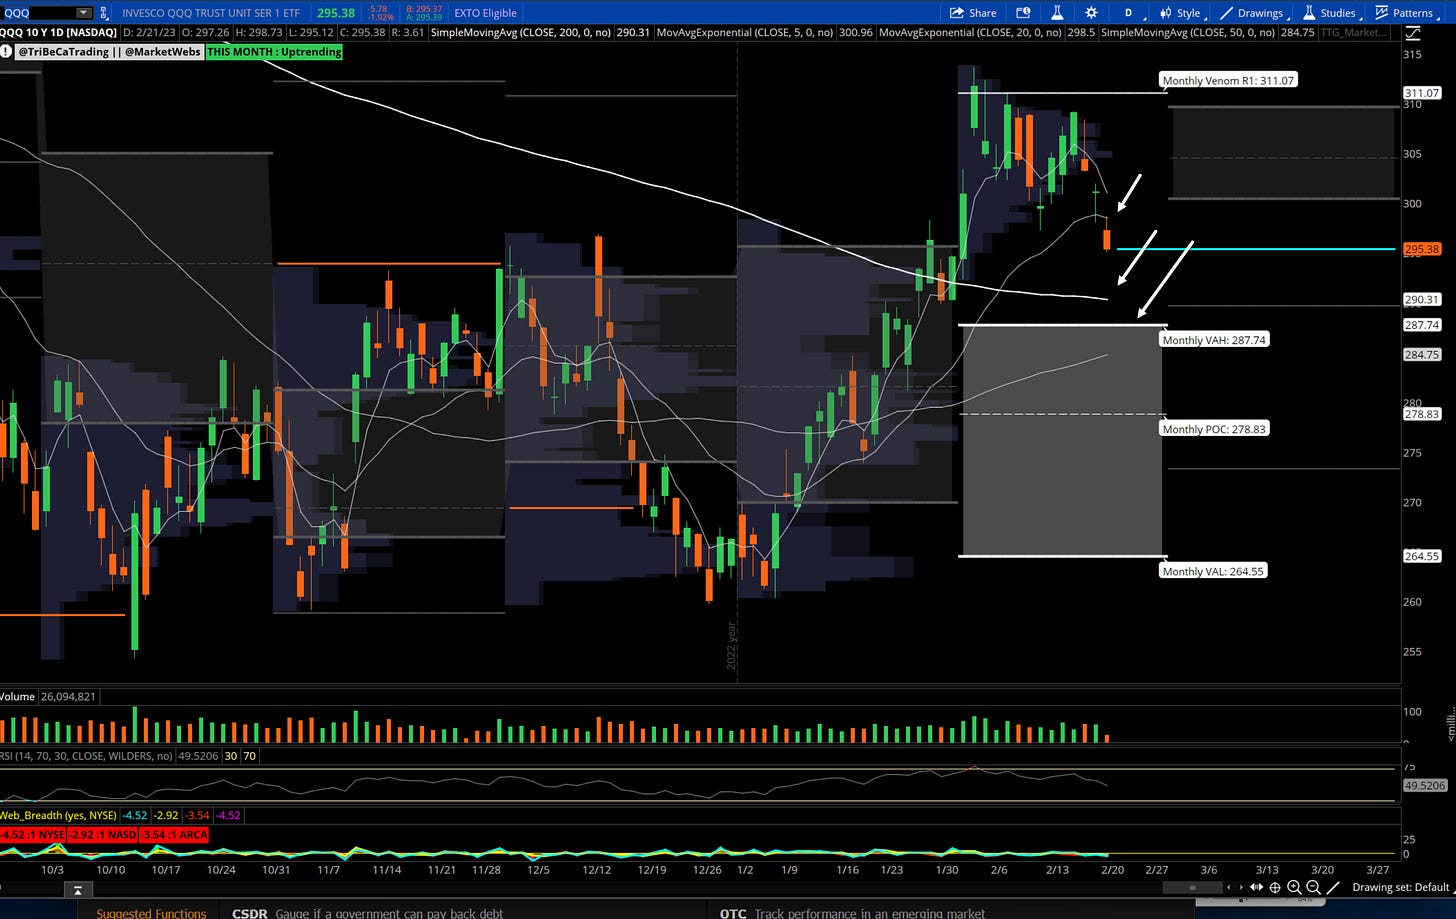
QQQ (NDX) Daily chart:
Price broke through the 20d MA and next support is 200d MA and further the top of Feb Value Area $287.74
IWM (RTY) Daily chart:
Similar to the S&P, price broke into the Feb Value Area $190.2 and next support down for the Small Caps is its 50dMA and next 200d MA and bottom of the Feb Value Area.
TLT (20+ Year Treasury Bond ETF ) Daily chart:
Bonds have been moving lower since breaking the Feb Value Area and today have taken out a downside VPOC. This is notable because often after a VPOC take out it is a possible place for a bounce. Something to watch this week as Bonds reversing higher would be good for equities (all things being equal) in my opinion.
Charts I am watching
CHD Church & Dwight Co., Inc.
Many of the Consumer Staples are showing relative strength (which often do when volatility rises). Can target upside VPOC $86.91 as long as price stays above its Feb Value Area $83
HSY Hershey
Another Consumer Staple to watch as HSY is breaking out to all time highs.
CBOE - CBOE Global Markets
Another chart to keep an eye on with rising volatility and the pickup in volume in 0DTE options. Watching for a breakout to new highs.
Want to know more about the TTG MarketWebs Indicator? Learn More Here
Copyright © Tribeca Trade Group. All of the information in this newsletter is for entertainment and educational purposes only and is not to be construed as investment or trading advice. None of the information in this newsletter is guaranteed to be accurate, complete, useful or timely. IMPORTANT NOTICES AND DISCLAIMERS TriBeCa Trade Group is not an investment advisor and is not registered with the U.S. Securities and Exchange Commission or the Financial Industry Regulatory Authority. Further, owners, employees, agents or representatives of TriBeCa Trade Group are not acting as investment advisors and might not be registered with the U.S. Securities Authority


