TTG Index Charts & Proprietary Stock Screen 5/15/23 $AVGO $V $SBUX
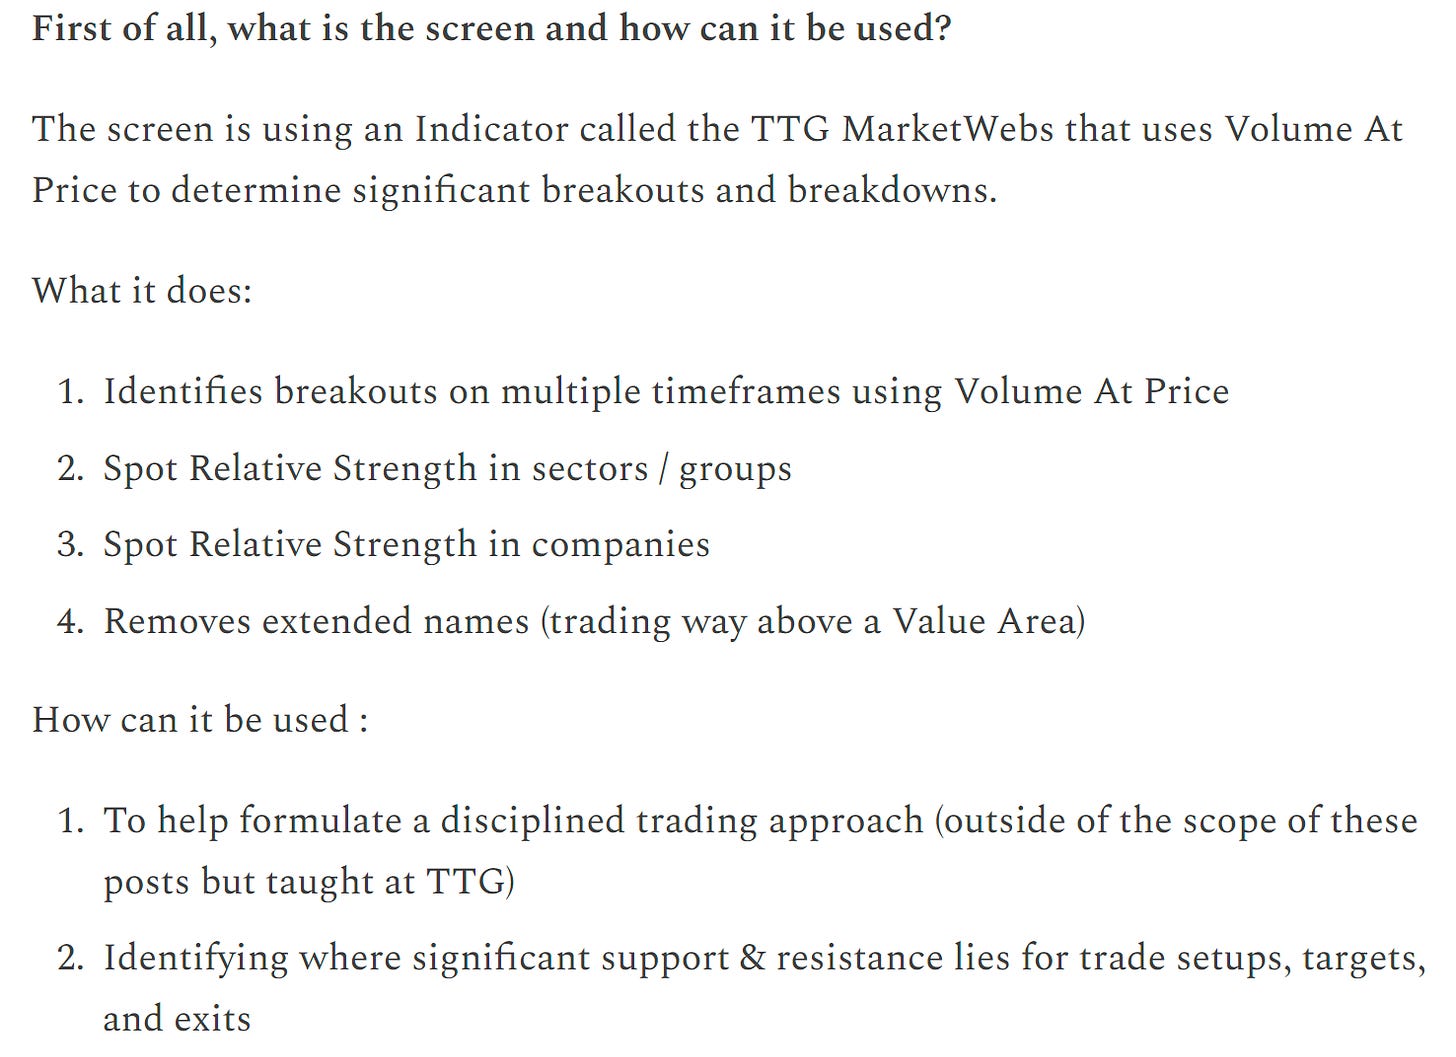
Out of the Box MarketWebs Screen
Index Updates
At TTG, I use Volume At Price quite a bit in my chart analysis and use the MarketWebs Indicator to provide Value Areas which provide significant support & resistance levels. Learn More Here about Volume At Price and the MarketWebs.
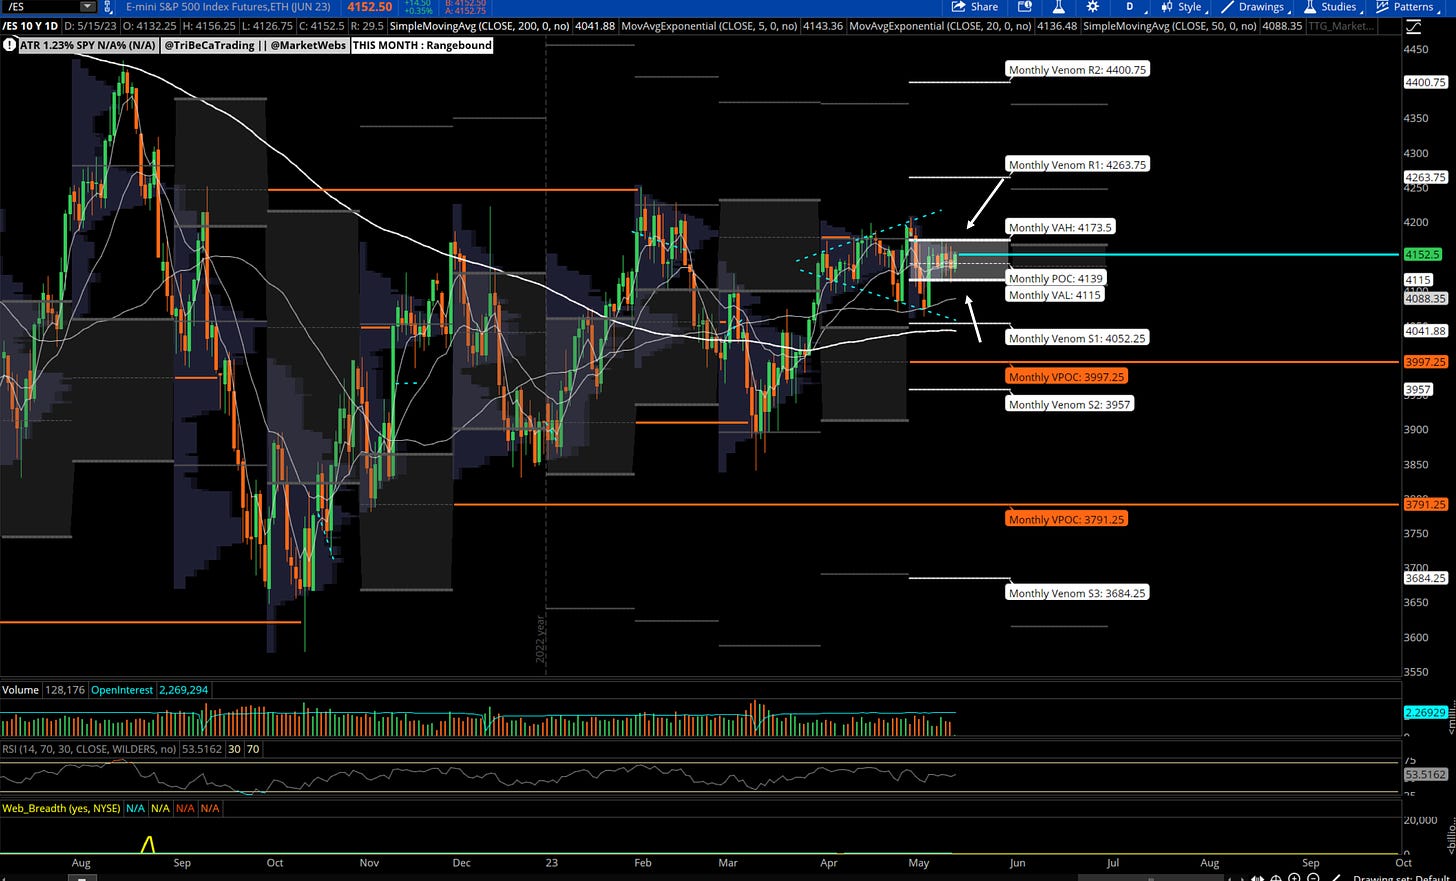
$ES_F - S&P futures - Daily chart: Prices higher this morning to start a new week , but remains locked inside this month's Value Area. There are 7 Fed Speaker appearances today which could shake things up…
US Dollar -0.2% / 30yr Bonds -0.3% / Crude +0.6% & Nat Gas +2.2% / Cryptos are higher this morning, BTC +3.3%
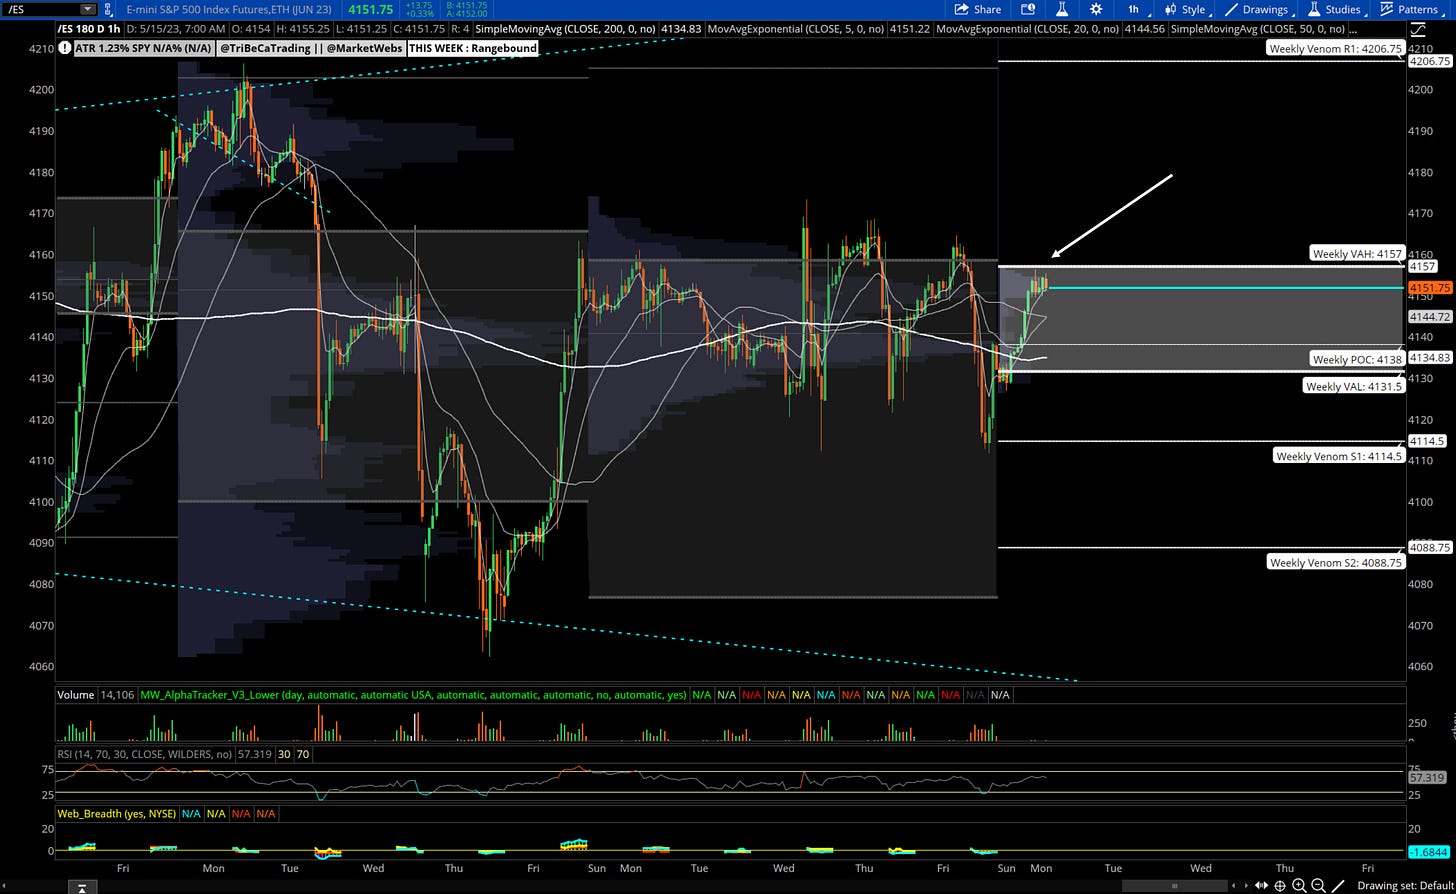
1hr chart: Price starts the week inside its new Value Area for the week, watch 4157 resistance
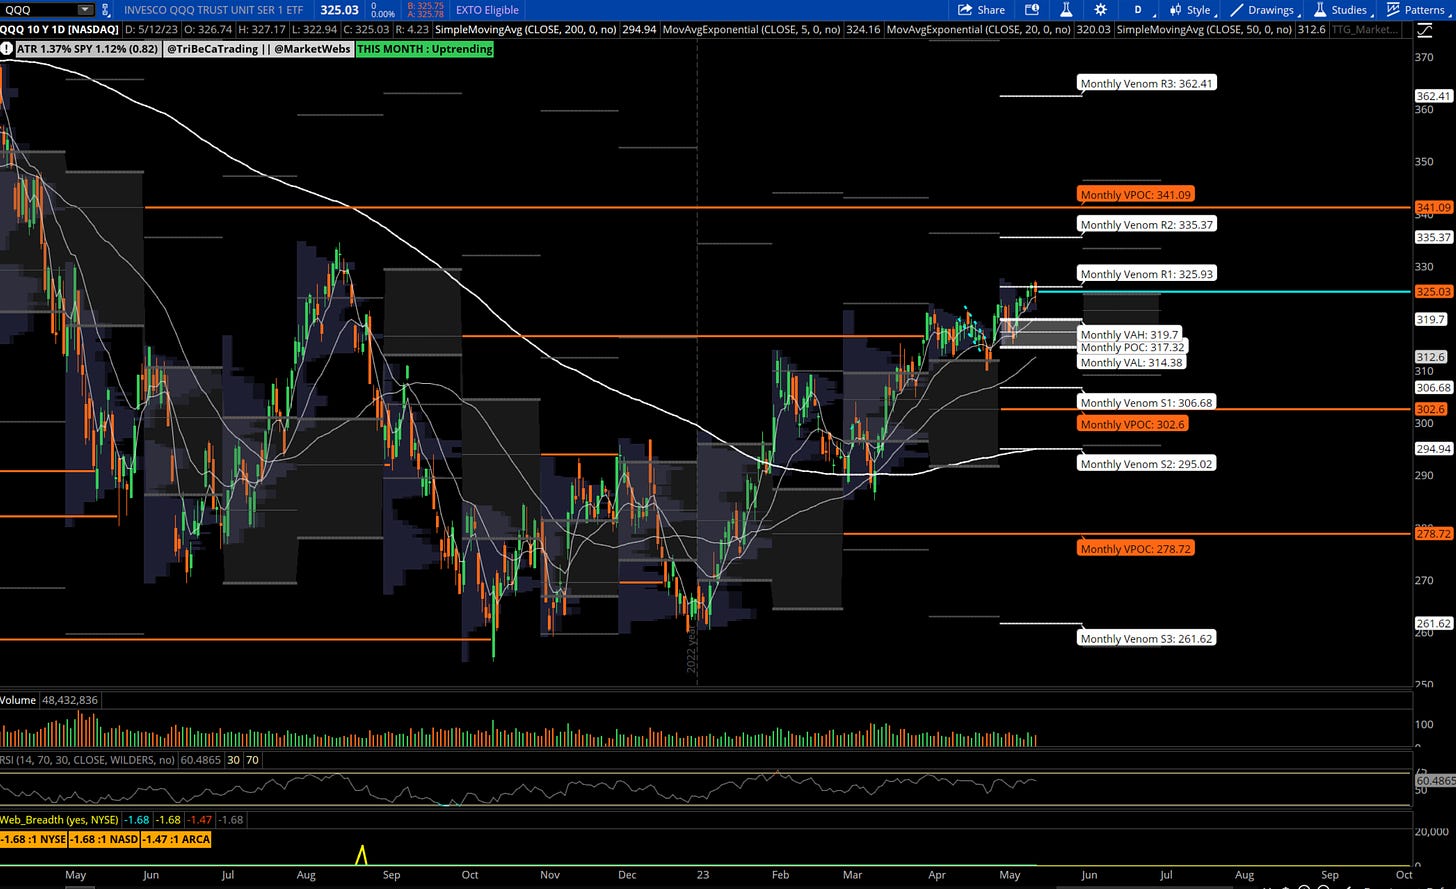
QQQ - NDX - Daily chart: Despite some volatility on Friday, price stayed above its 5d EMA and trending above its May Value Area
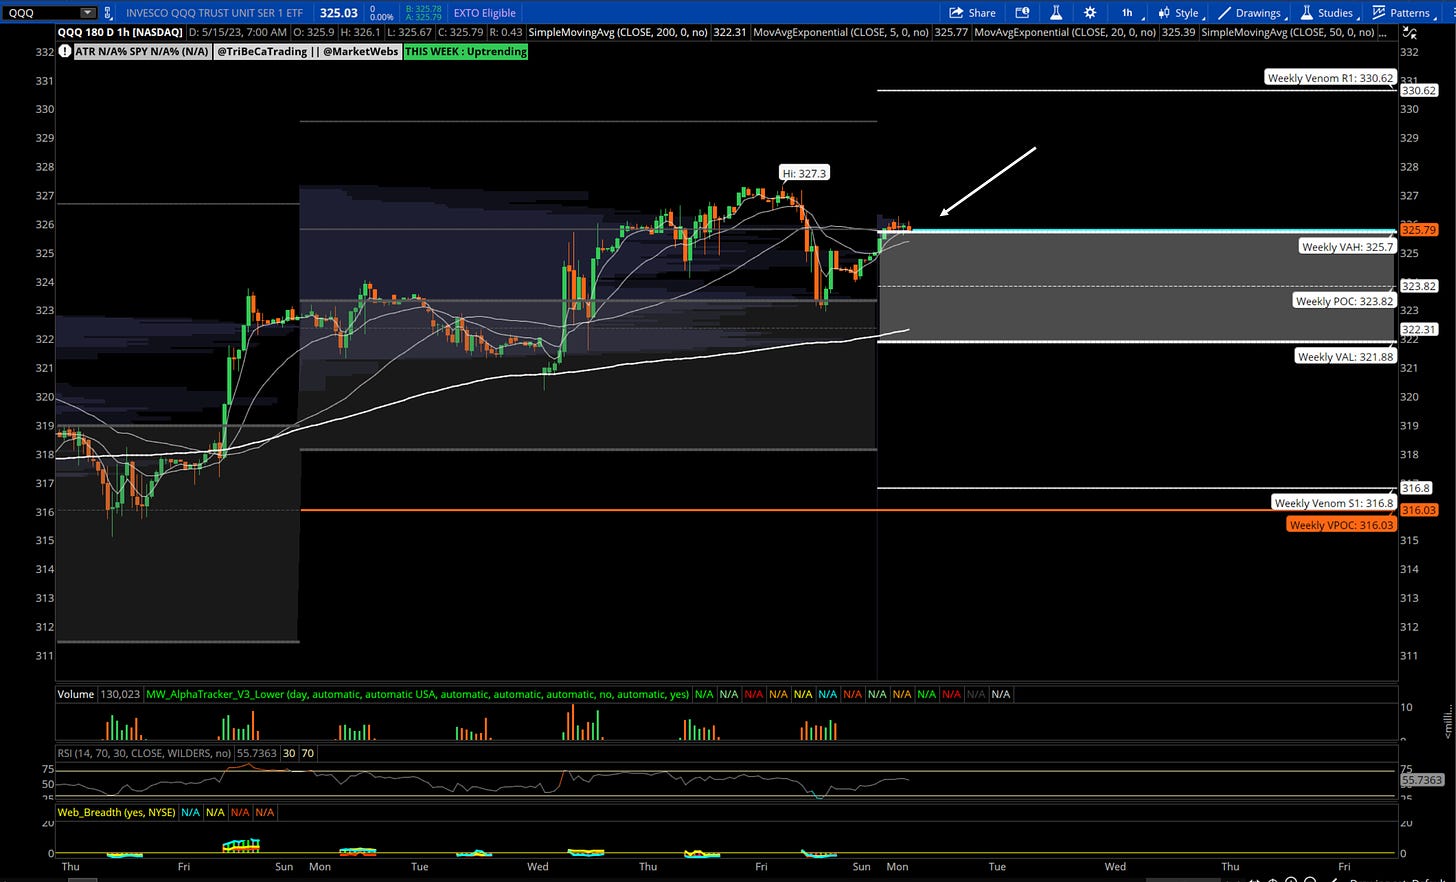
1hr chart: Slightly different than the S&P, price is above its 1hr Value Area to start the week, watch $325.70 support
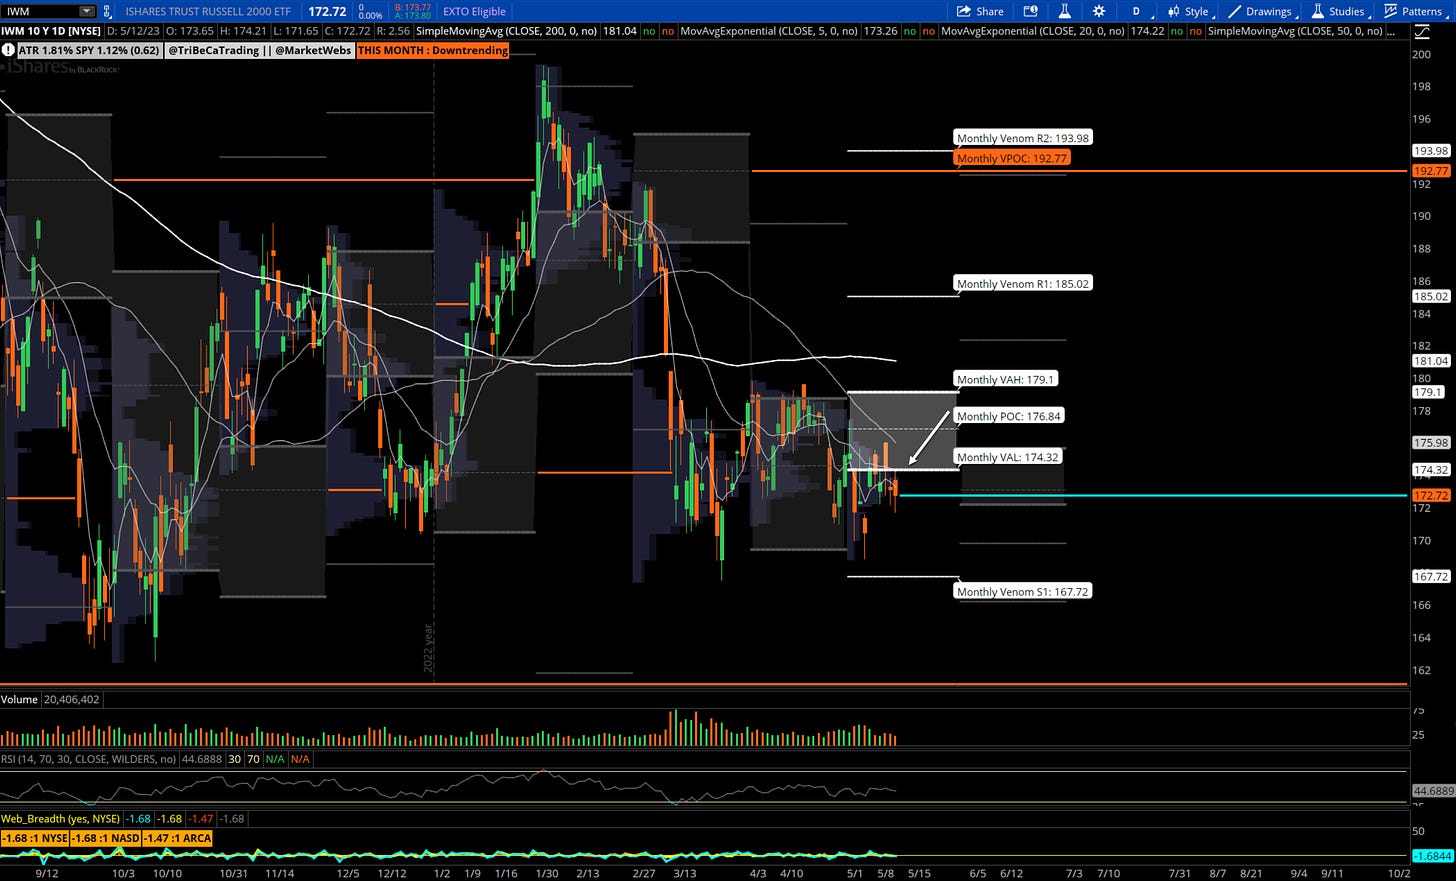
IWM- Russell Small Cap ETF- Daily Chart: Price remains below its May Value Area, watch $174.32 resistance
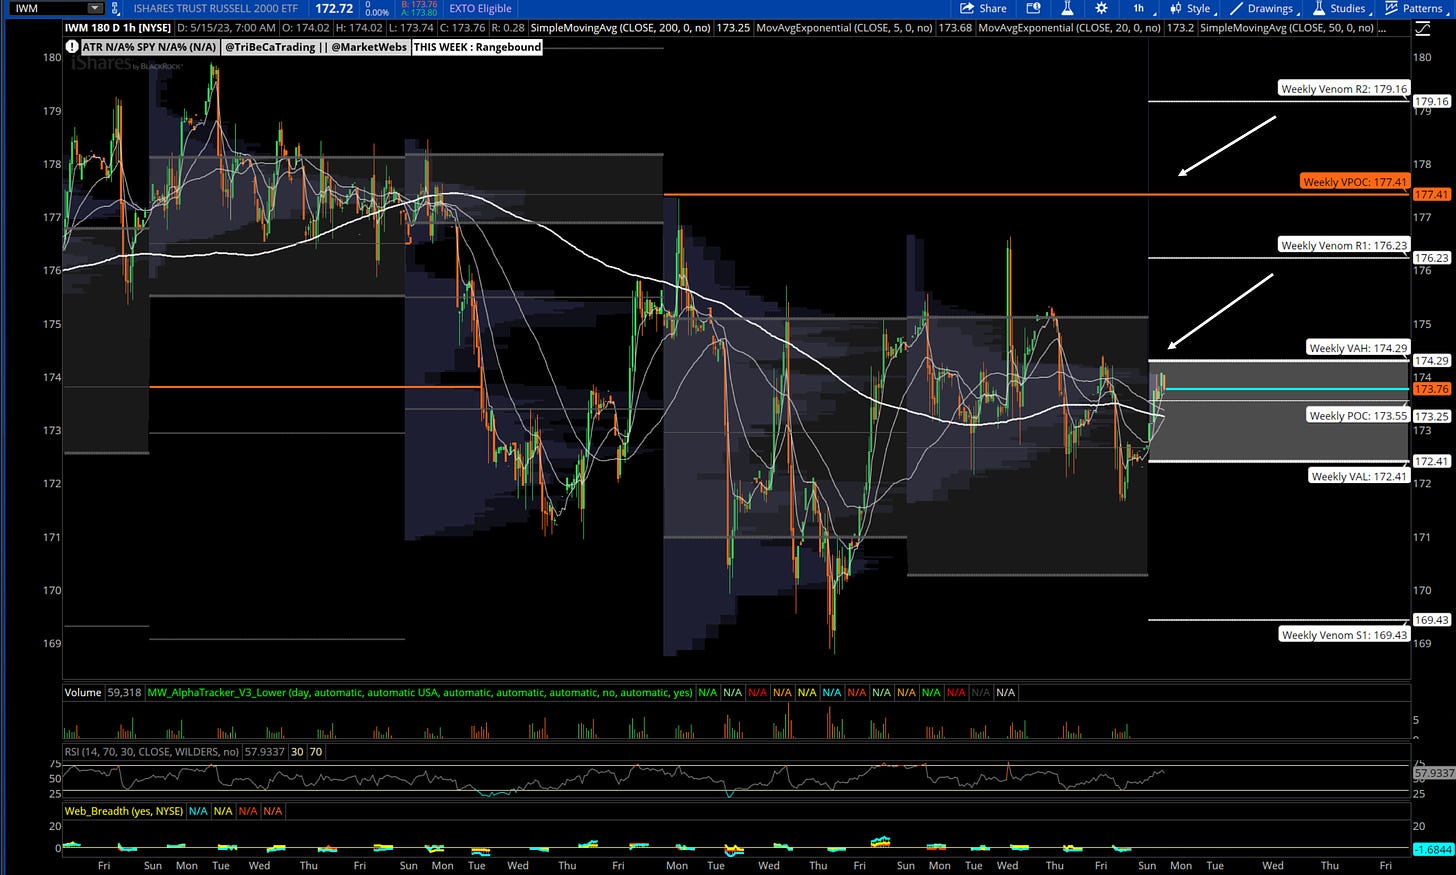
1hr chart: Price starts the week inside its 1hr Value Area, $174.29 which lines up closely with resistance from the May Value Area on the Daily chart
Here is today’s TTG Proprietary Stock Screen using Volume At Price
Remember, I am only showing a few setups from the list here and review more in the TTG Trading Room. I provide a more detailed watchlist every weekend to start the week at TTG.
Considering the low amount of names on scan due to declining market breadth, here are 3 names that saw call activity on Friday:
Charts
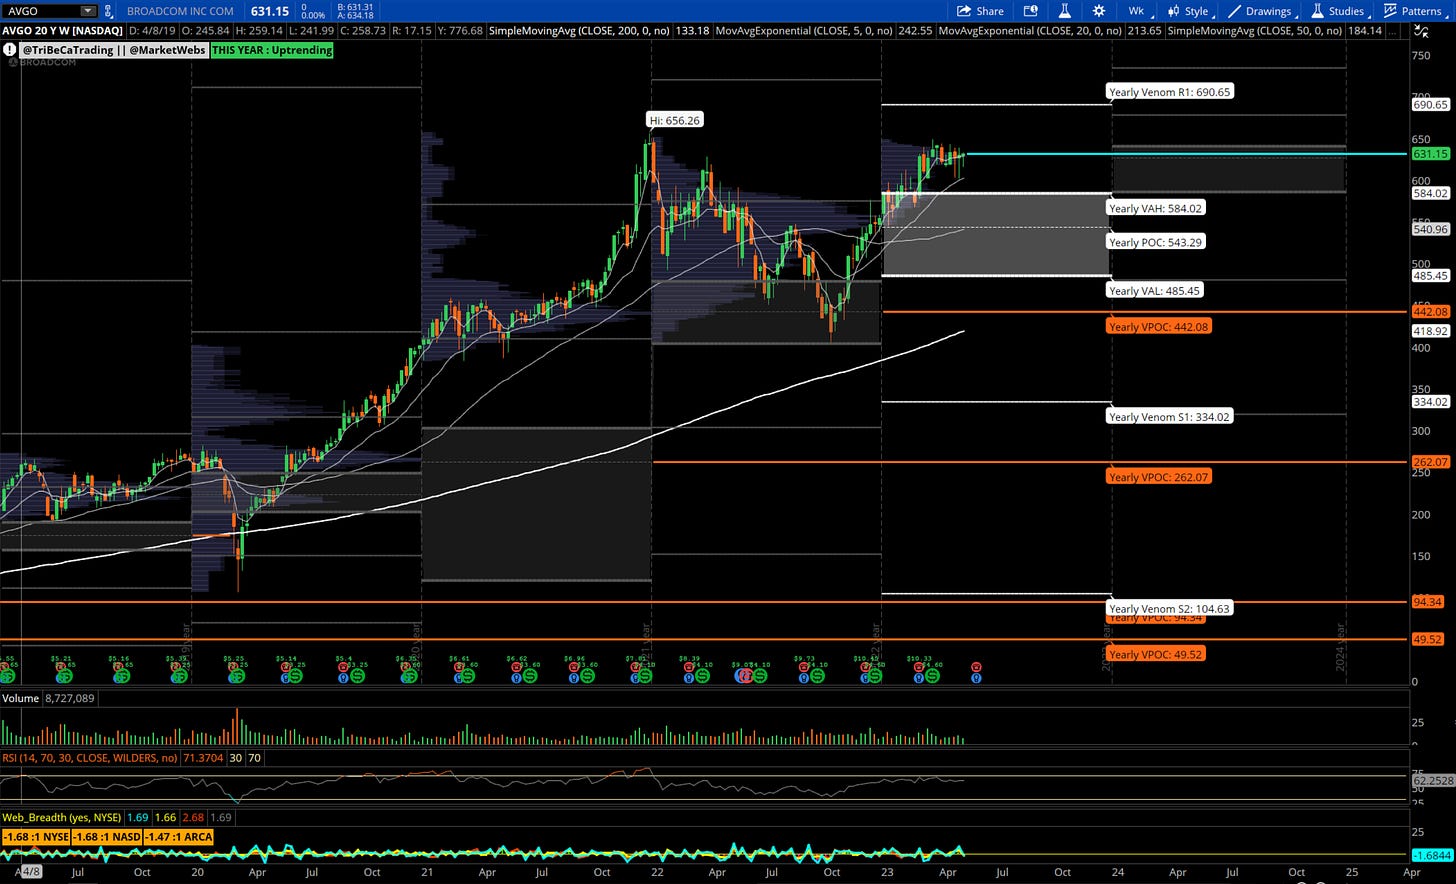
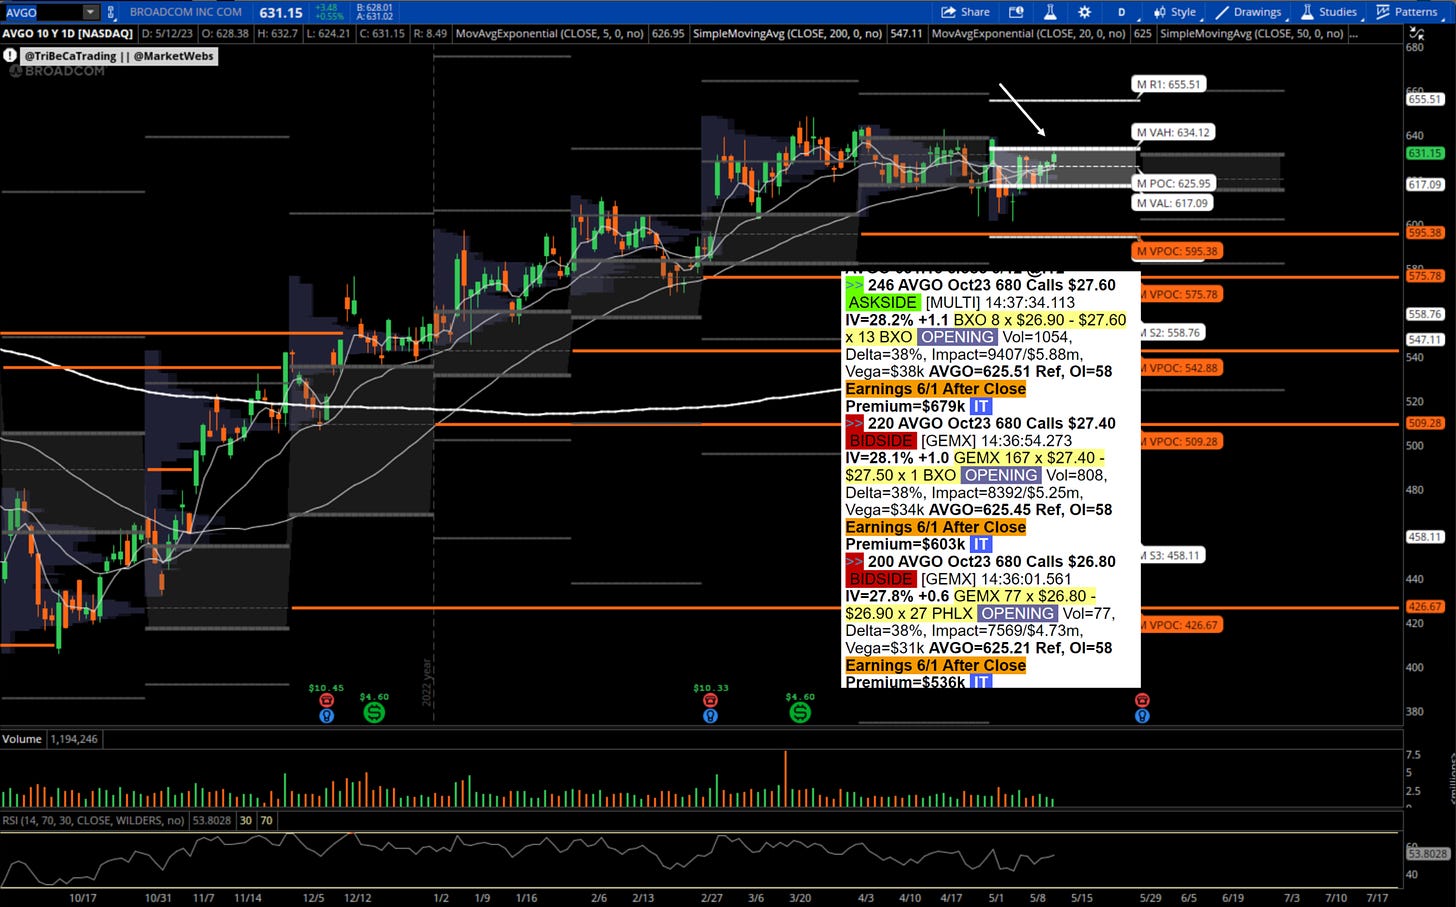
AVGO Weekly & Daily chart
Broadcom Inc. designs, develops, and supplies semiconductor and infrastructure software solutions. The Company offers storage adapters, controllers, networking processors, motion control encoders, and optical sensors, as well as infrastructure and security software to modernize, optimize, and secure the most complex hybrid environments. (Bloomberg)
-watch for a break of the May Value Area (2nd chart) $634.2, suggested stop price $617 from the TTG MarketWebs
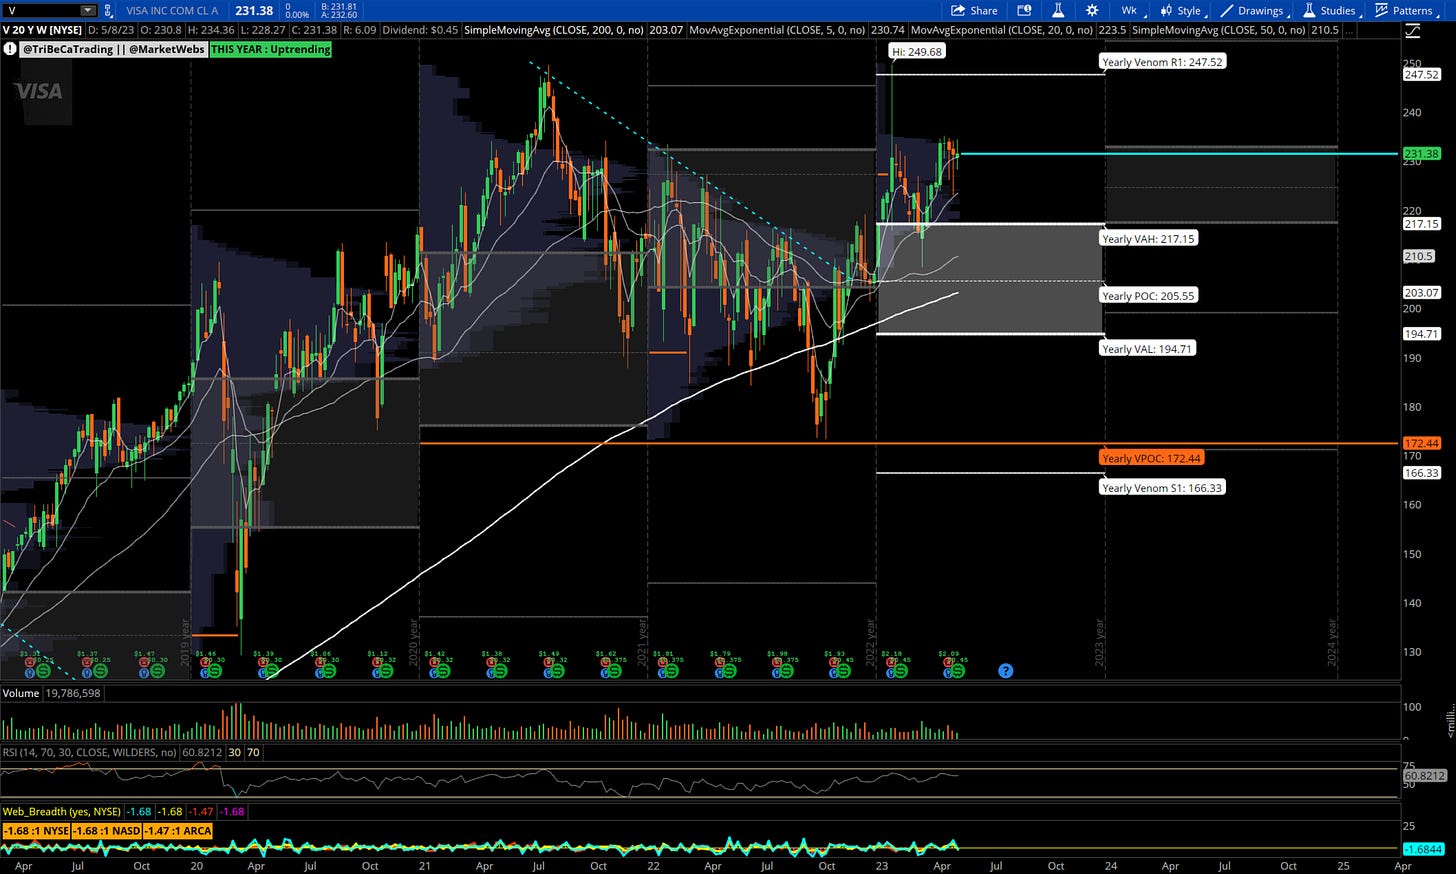
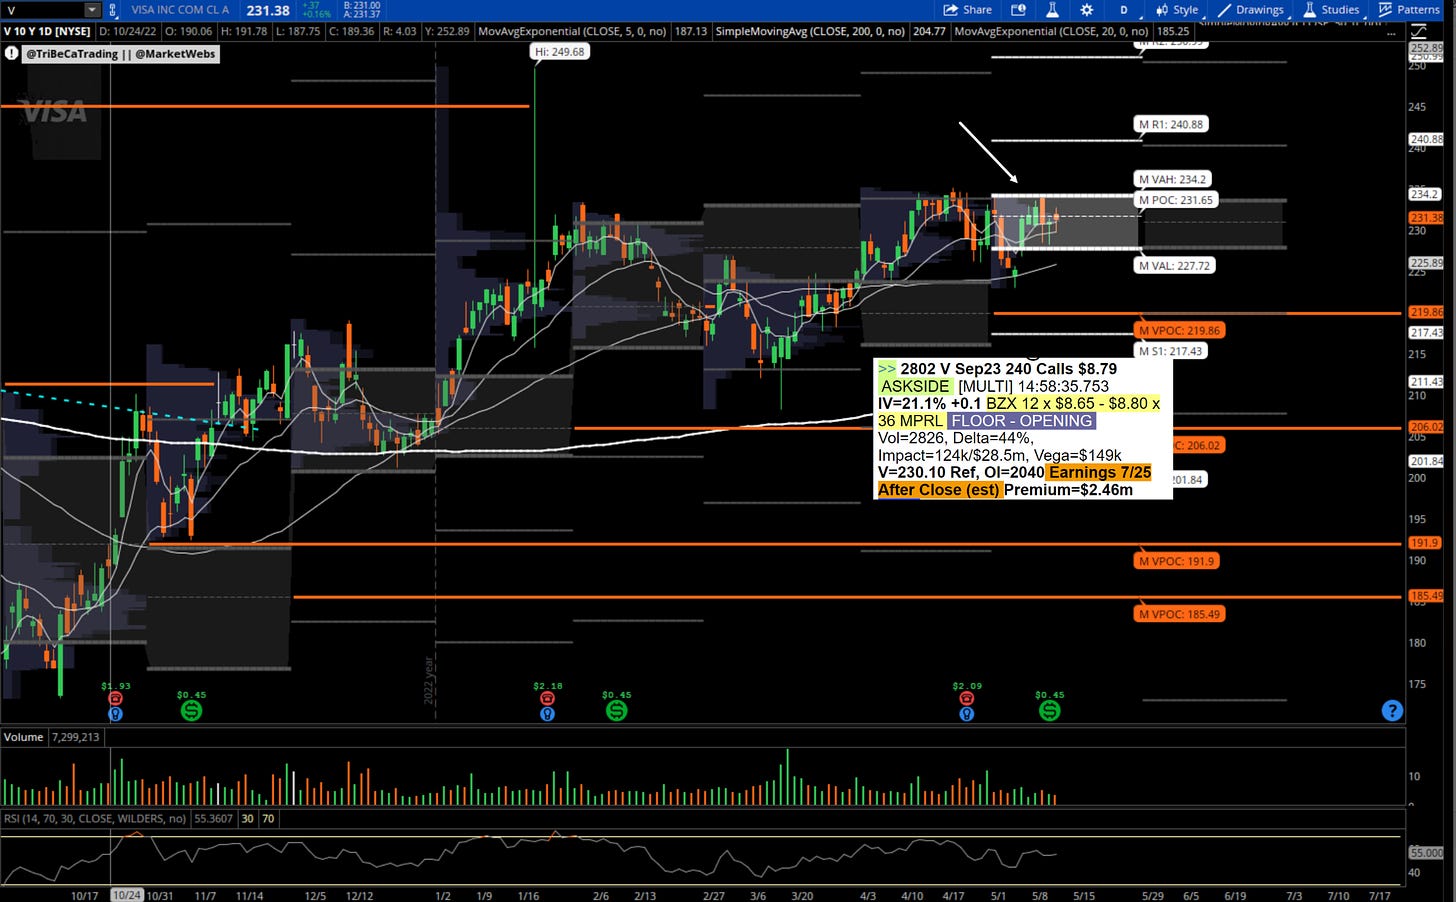
V Weekly and Daily chart
Visa Inc. operates a retail electronic payments network and manages global financial services. The Company also offers global commerce through the transfer of value and information among financial institutions, merchants, consumers, businesses, and government entities. customers worldwide. (Bloomberg)
-watch for a break of the May Value Area (2nd chart) $234.2, suggested stop price $227 from the TTG MarketWebs
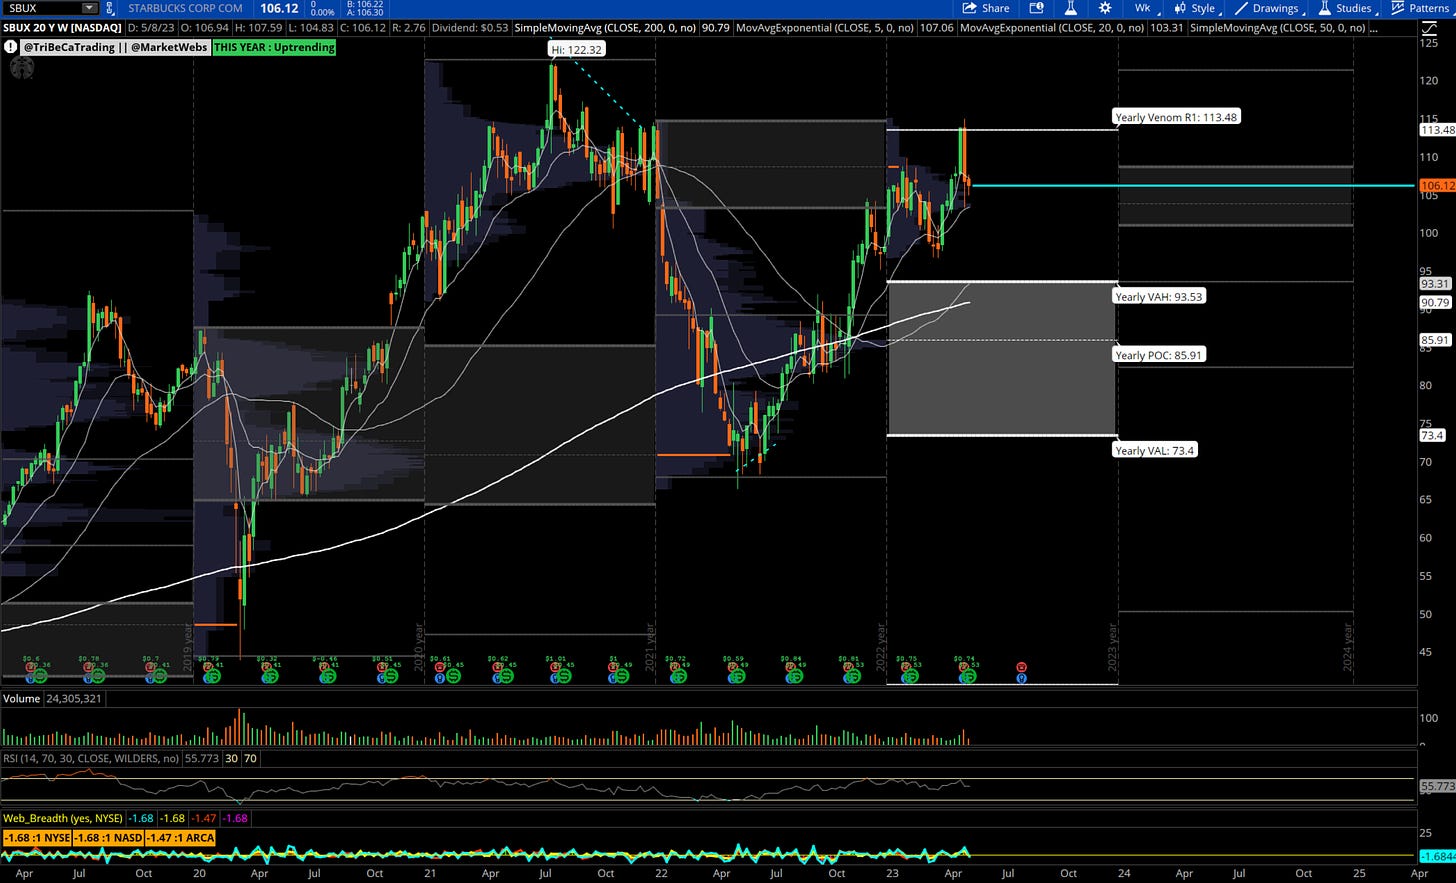
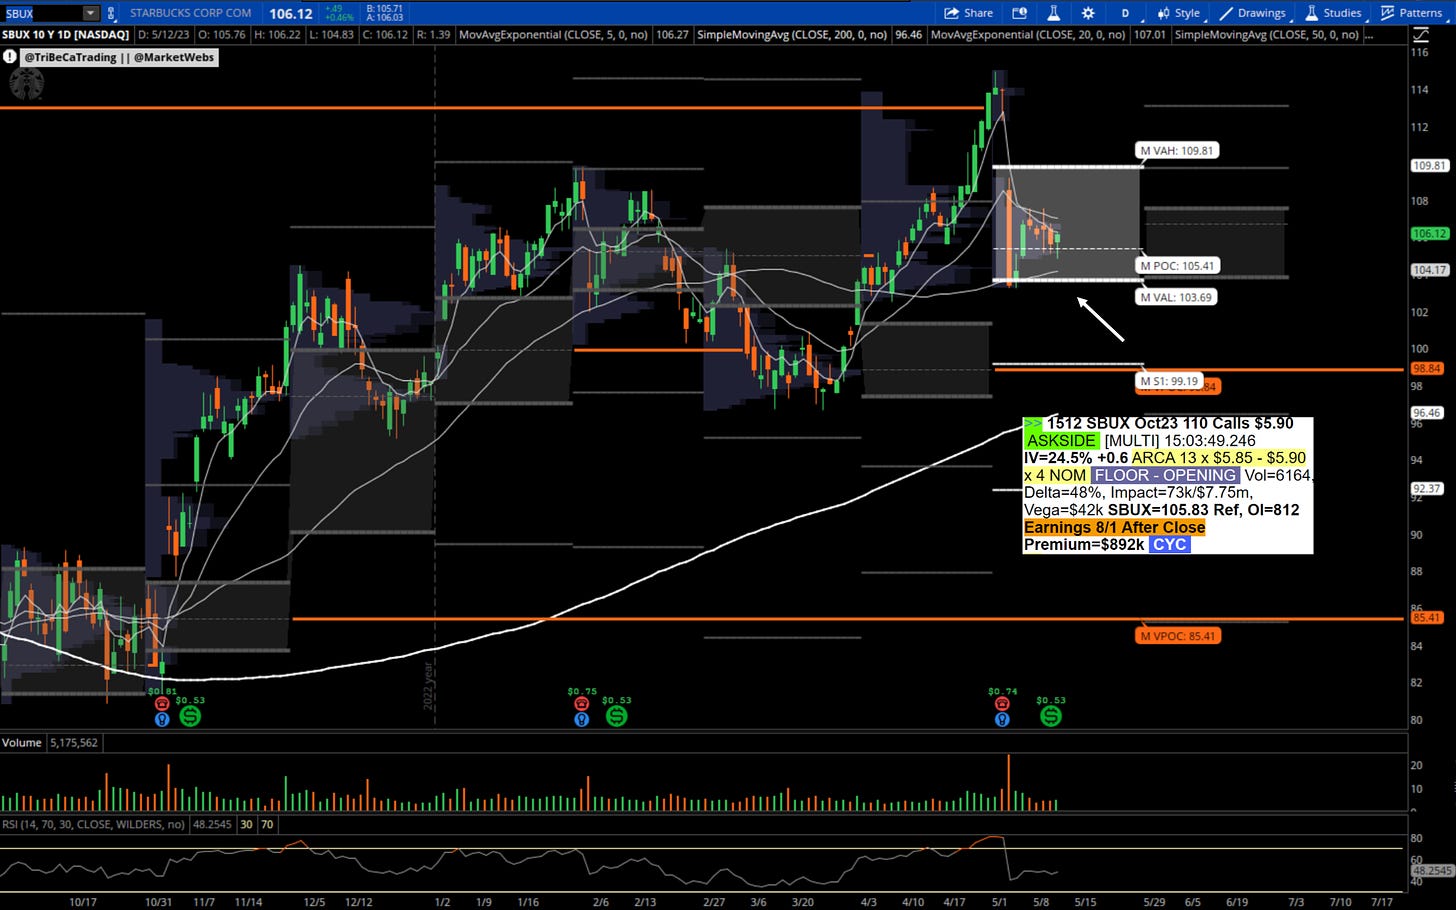
SBUX Weekly and Daily chart
Starbucks Corporation is the premier roaster, marketer, and retailer of specialty coffee. The Company offers packaged and single-serve coffees and teas, beverage-related ingredients, and ready-to-drink beverages, as well as produces and sells bottled coffee drinks and a line of ice creams. (Bloomberg)
-suggested stop price $103 from the TTG MarketWebs
Remember, this is just one type of screen / setup that I focus on in my analysis!
Copyright © Tribeca Trade Group. All of the information in this newsletter is for entertainment and educational purposes only and is not to be construed as investment or trading advice. None of the information in this newsletter is guaranteed to be accurate, complete, useful or timely. IMPORTANT NOTICES AND DISCLAIMERS TriBeCa Trade Group is not an investment advisor and is not registered with the U.S. Securities and Exchange Commission or the Financial Industry Regulatory Authority. Further, owners, employees, agents or representatives of TriBeCa Trade Group are not acting as investment advisors and might not be registered with the U.S. Securities Authority


