

TTG Index Charts & Out of the Box Stock Screen 2/28/24 $AOS
TTG Index Charts & Out of the Box Stock Screen 2/28/24 $AOS
Out of the Box MarketWebs Screen
US Dollar -0.1% / 30yr Bonds +0.4% / Crude -0.1% & Nat Gas -1% / Gold +0.3% / Copper +0.4% / BTC +4.5%
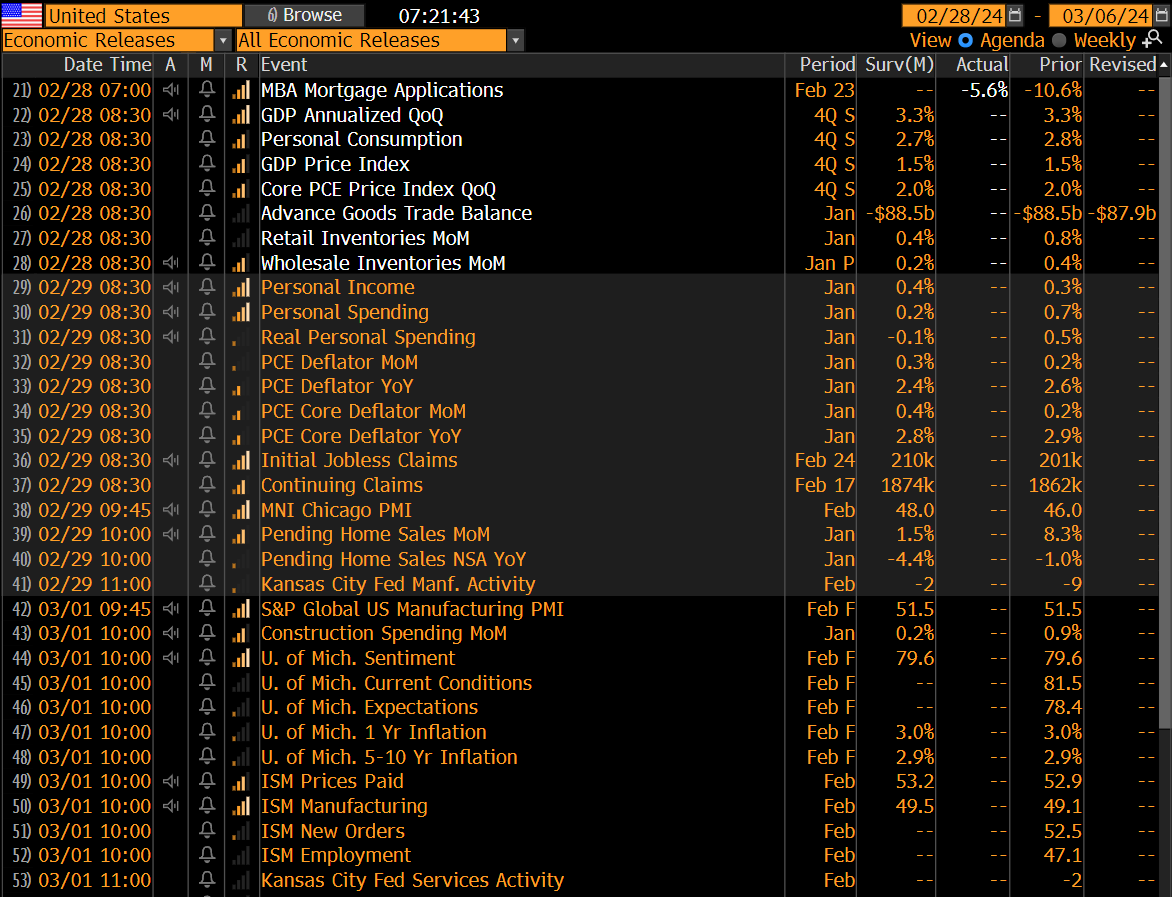
US Upcoming Economics
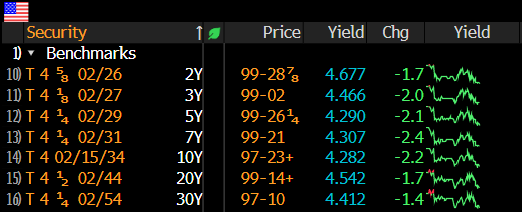
US Bond Yields & Bond Auctions
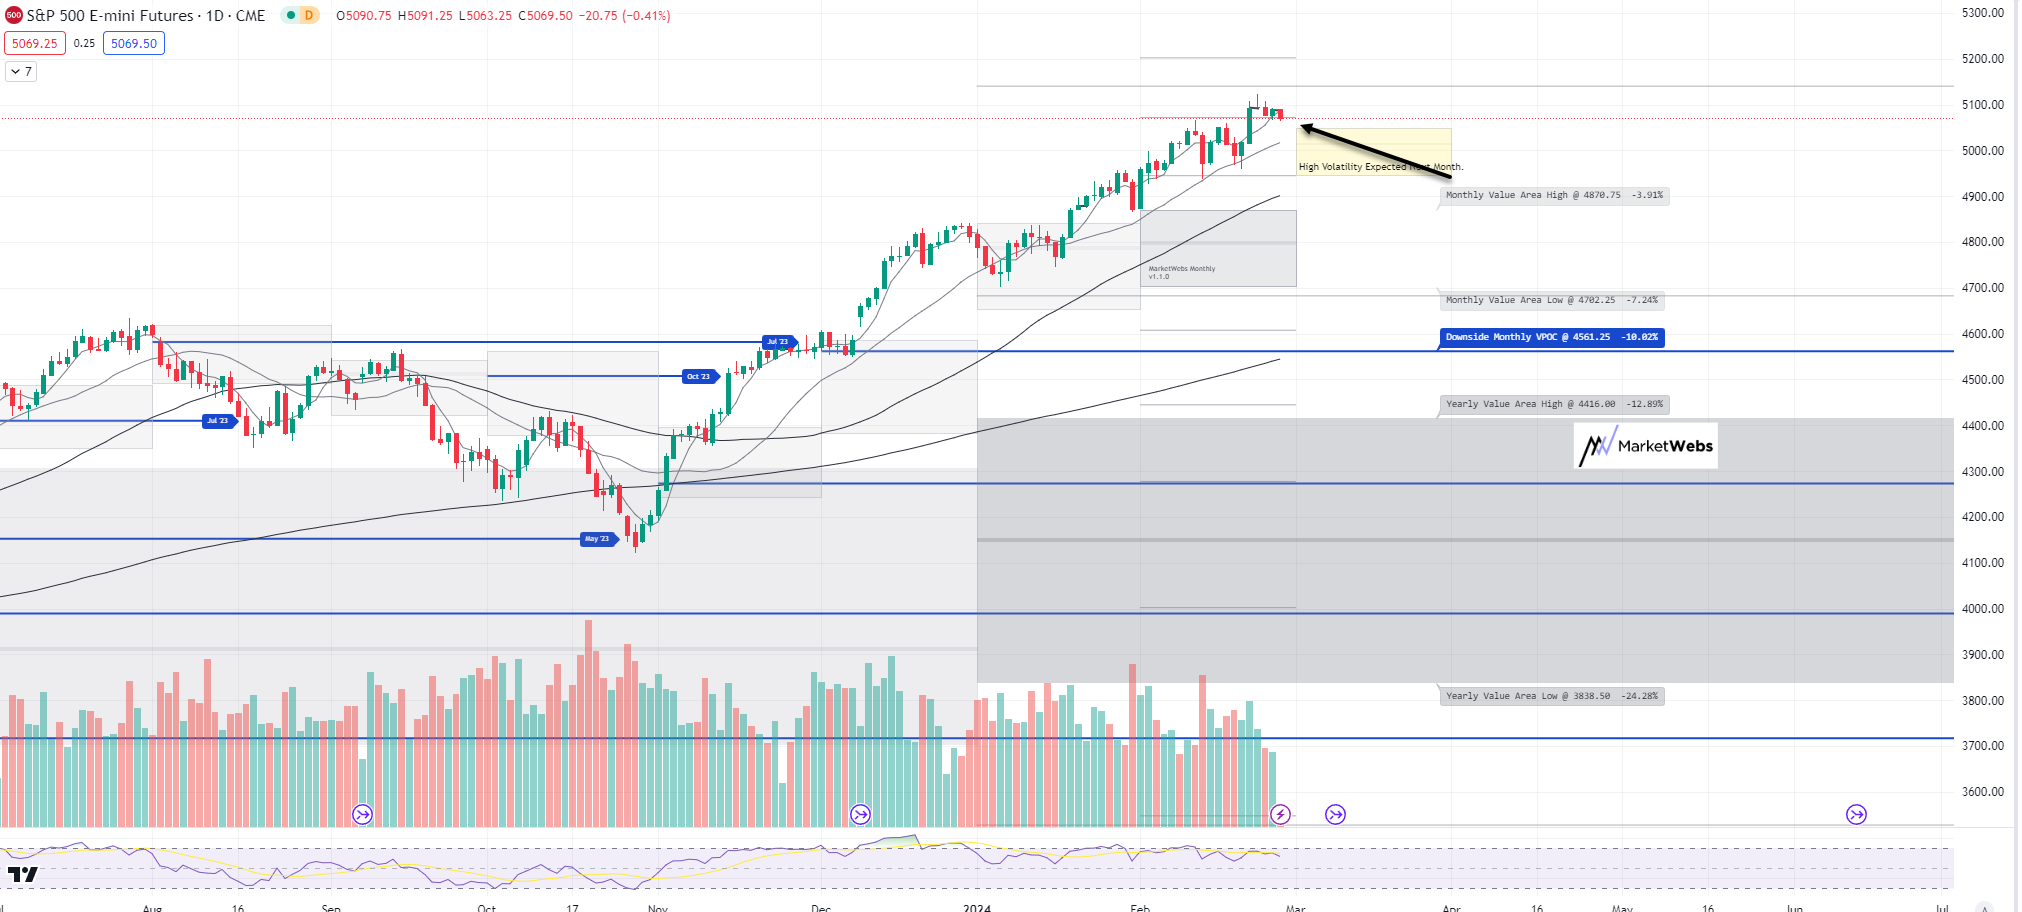
Index Updates
At TTG, I use Volume At Price in my chart analysis and I use the MarketWebs Indicator to provide Value Areas & VPOCs which indicate significant support & resistance levels. Learn More Here about Volume At Price and the MarketWebs.
ES_F - SPX Futures - Price softer this morning, -0.4% as the Dollar is stronger +0.3% and price is starting to lose its 5d MA (Moving Average)
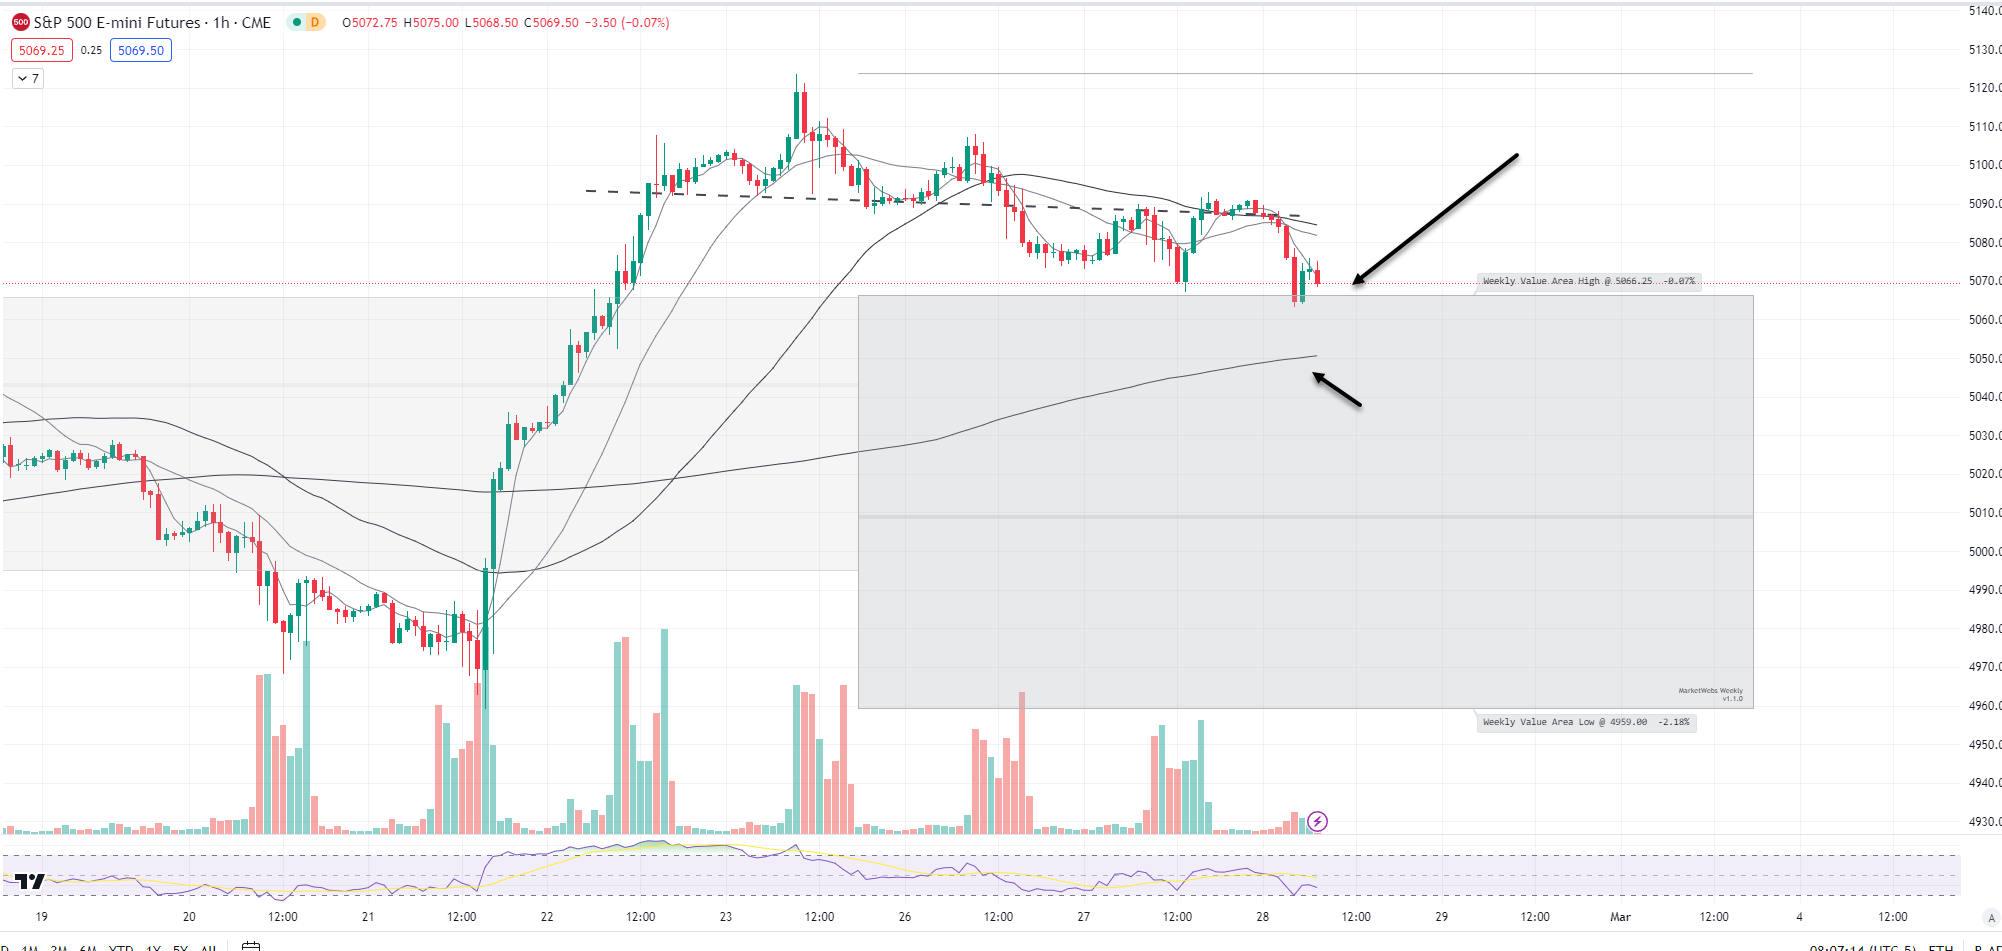
1hr chart: Price drifting lower to to that to of this week's Value Area support , watch 5066.25 and next the 200 period MA
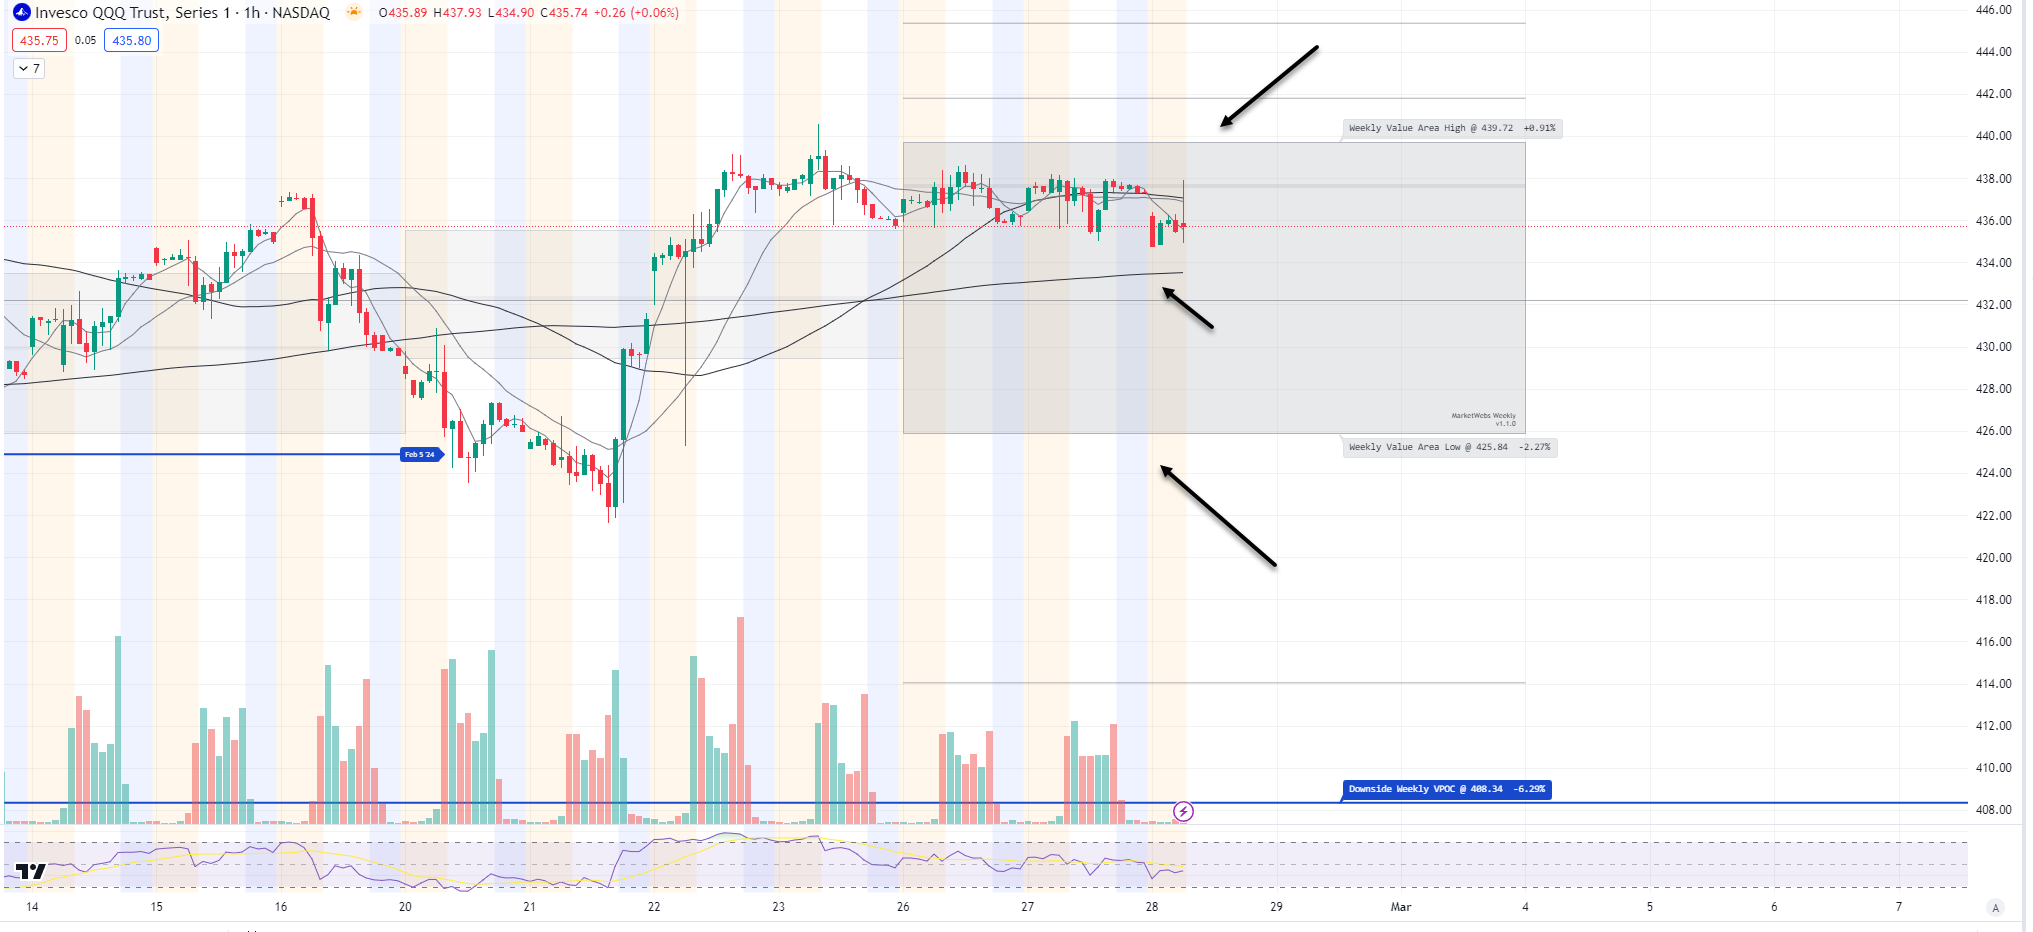
QQQ - NDX 100 ETF - Daily chart: Price ind. -0.5% and testing its 5d MA and remains locked in a range so far this week
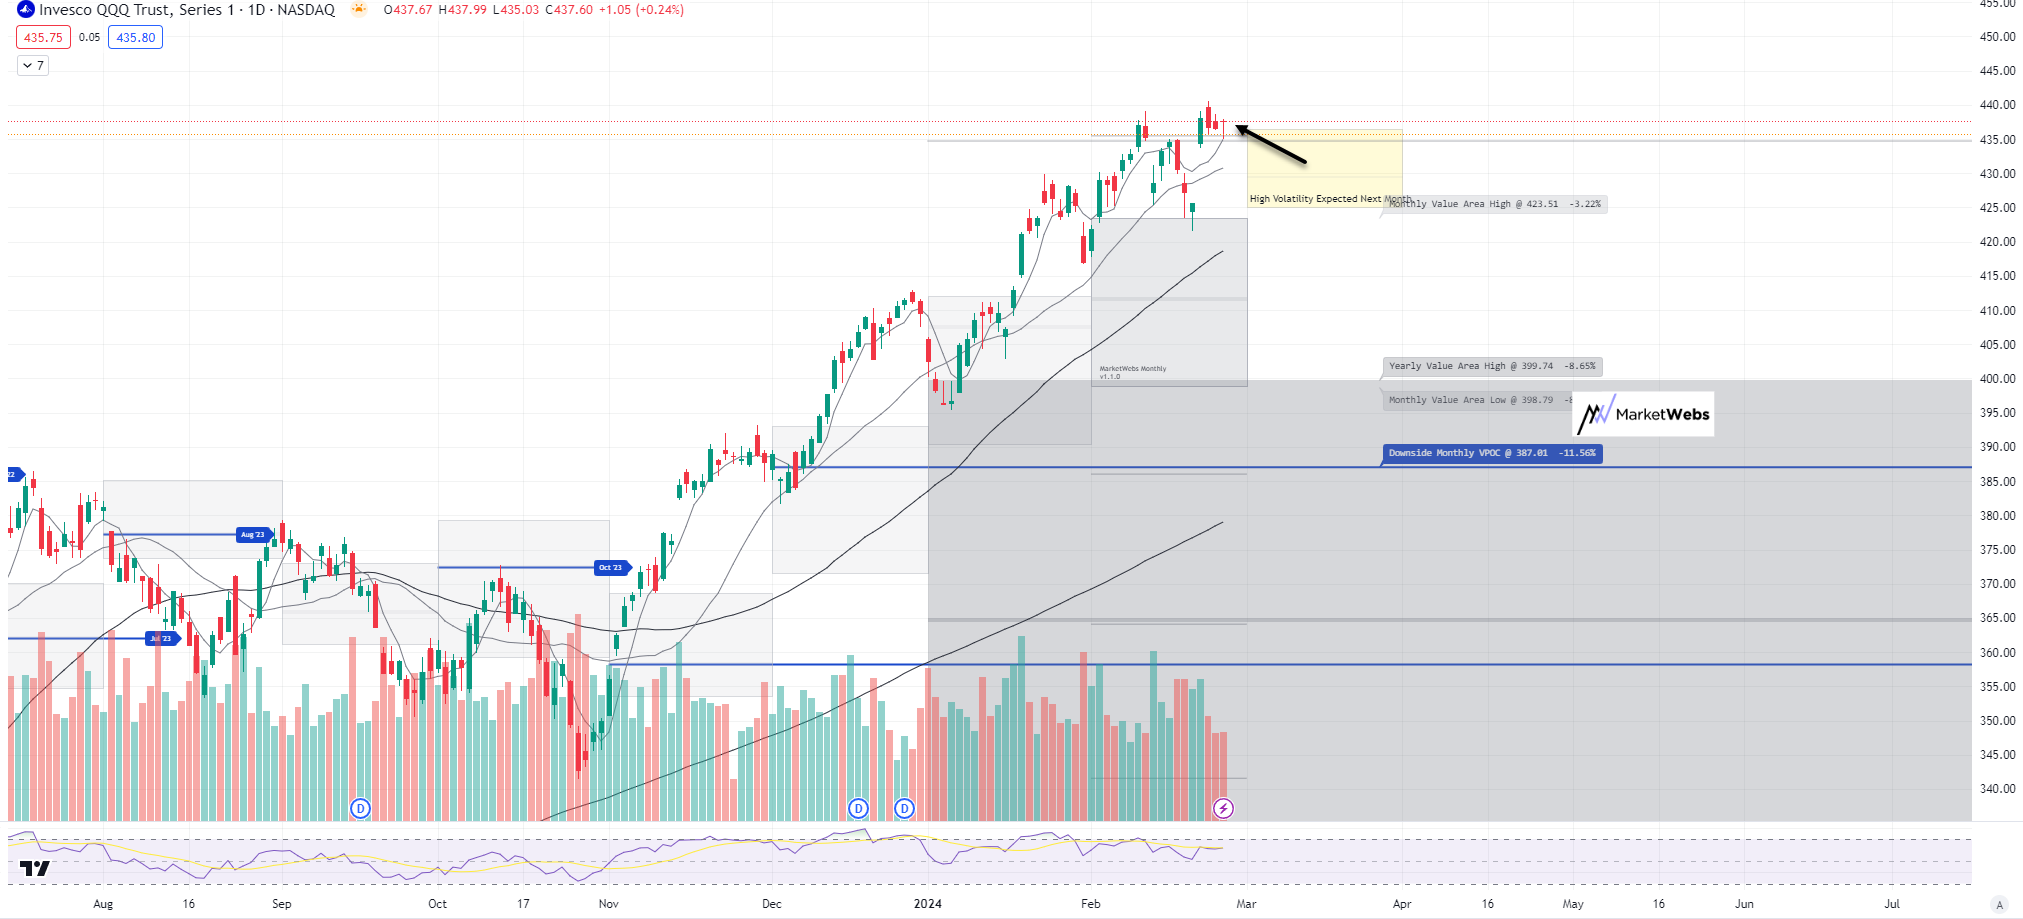
1hr chart: Price remains inside its Value Area for the week but starting to lean lower, level to watch below
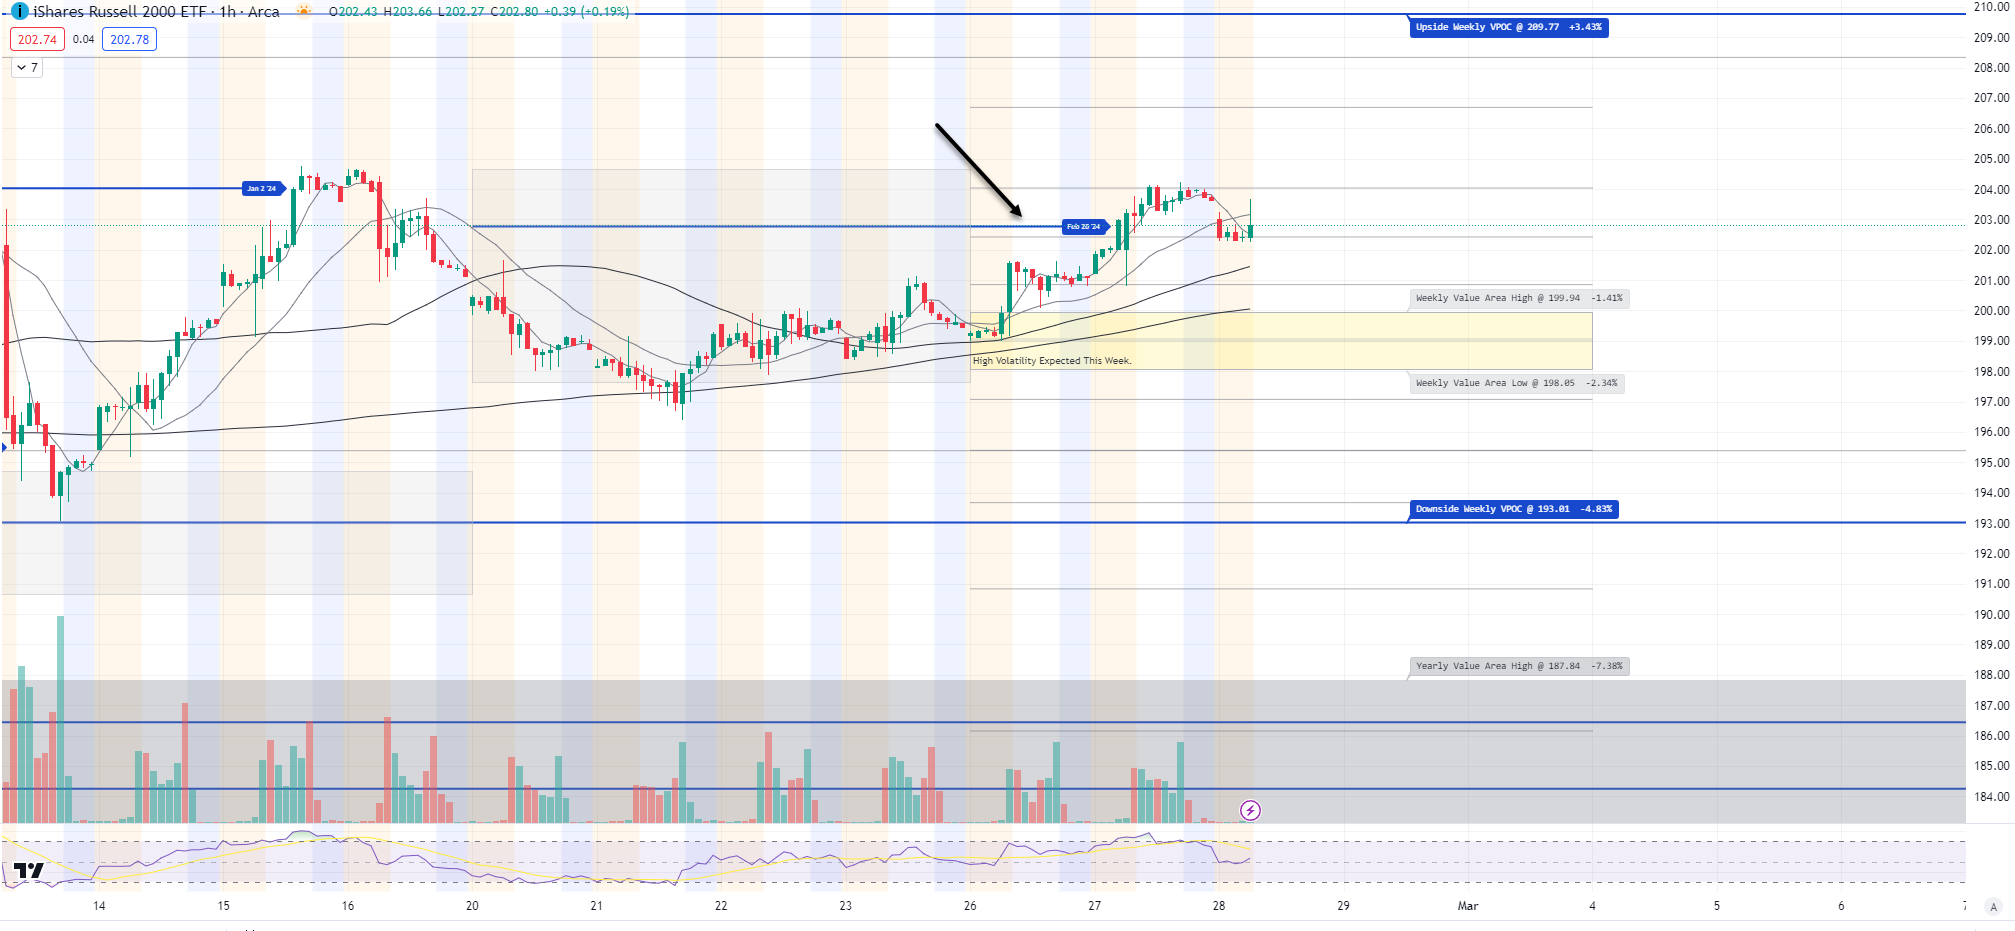
IWM - Russell Small Cap ETF- Price cooling off a bit this morning after 4 up days, ind -0.6% - due to the sideways nature of the Small Caps.. do we see another check back to its 50d MA? My thought is this stays sideways unless we see a meaningful move lower in interest rates
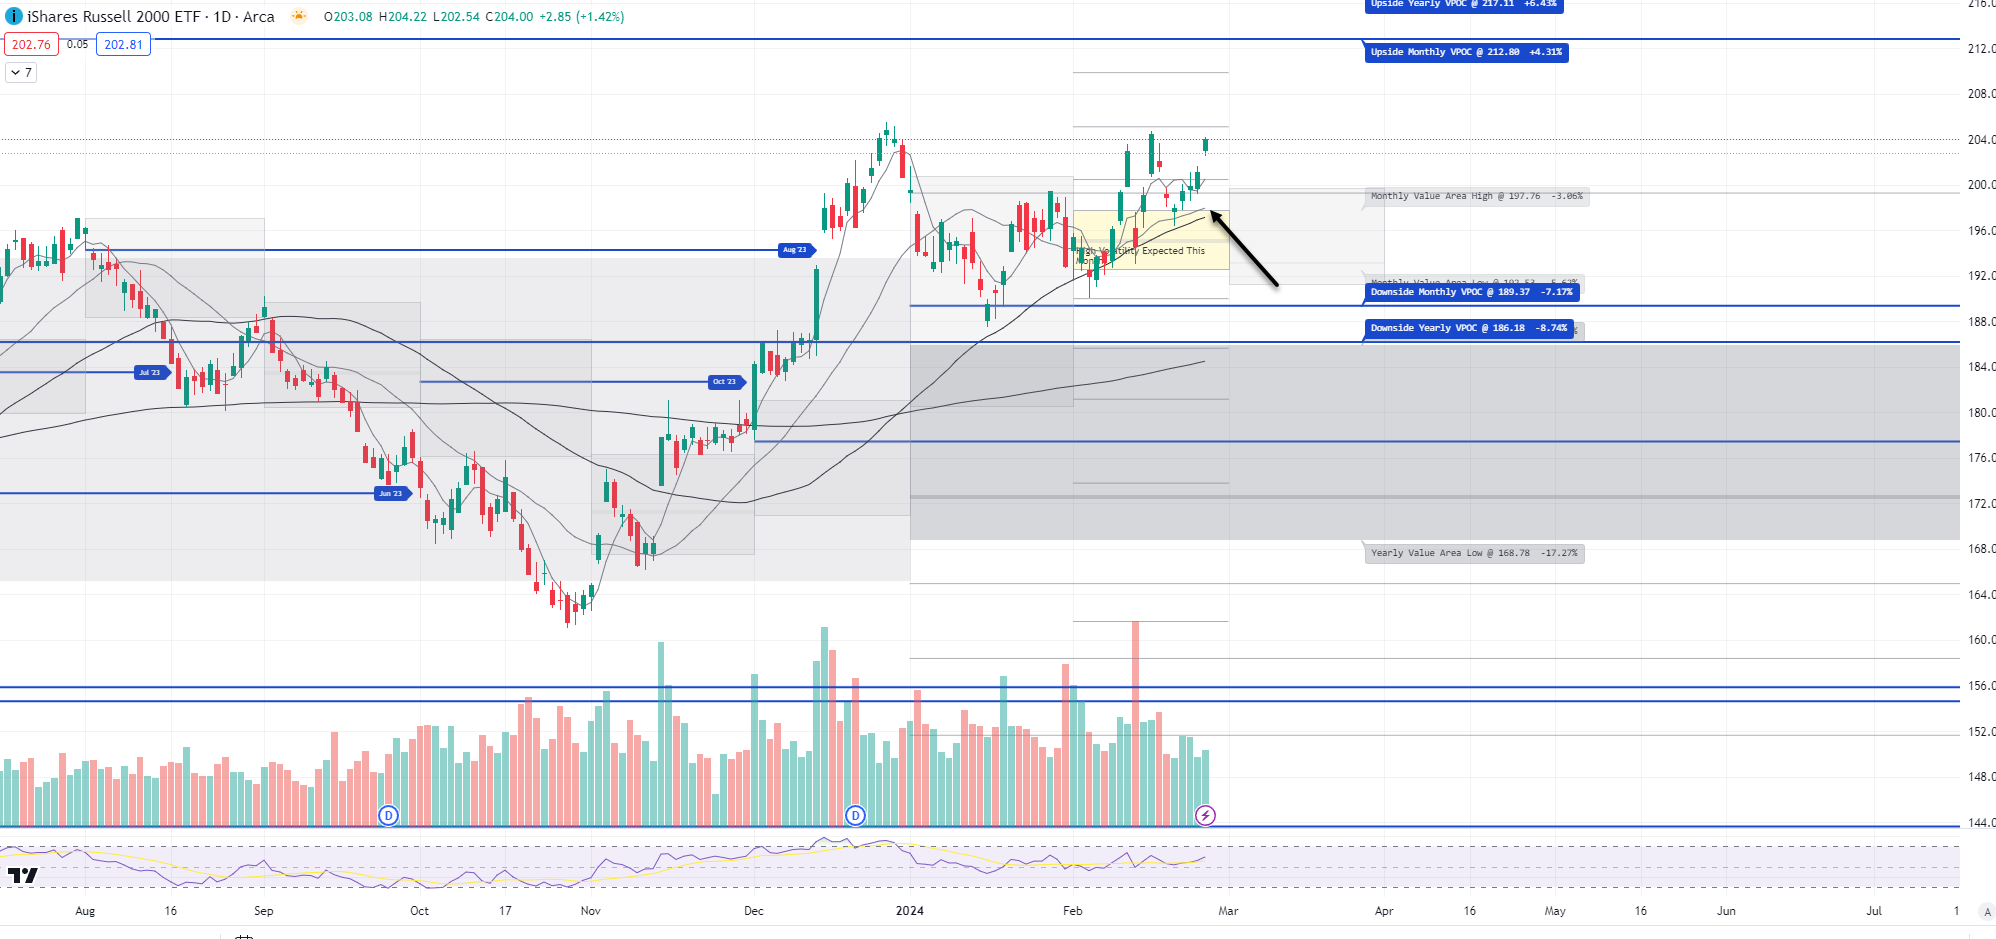
1hr chart: Price moving back towards that 1hr VPOC (remember, this often act as magnets unless there is new info / catalyst)
Here is today’s TTG Proprietary Stock Screen “Out of the Box” using Volume At Price
names trending above their Value Areas (on 3 multiple timeframes & not super extended)
Keep reading with a 7-day free trial
Subscribe to The Tribeca Trade Group to keep reading this post and get 7 days of free access to the full post archives.