

TTG Index Charts & Out of the Box Stock Screen 01/16/24 $VCEL $INFY
TTG Index Charts & Out of the Box Stock Screen 01/16/24 $VCEL $INFY
Out of the Box MarketWebs Screen
US Dollar +0.8% / 30yr Bonds -0.56 / Crude +1.0% & Nat Gas -7.0% / Gold -0.6% / Copper +0.8% / BTC -1.1%
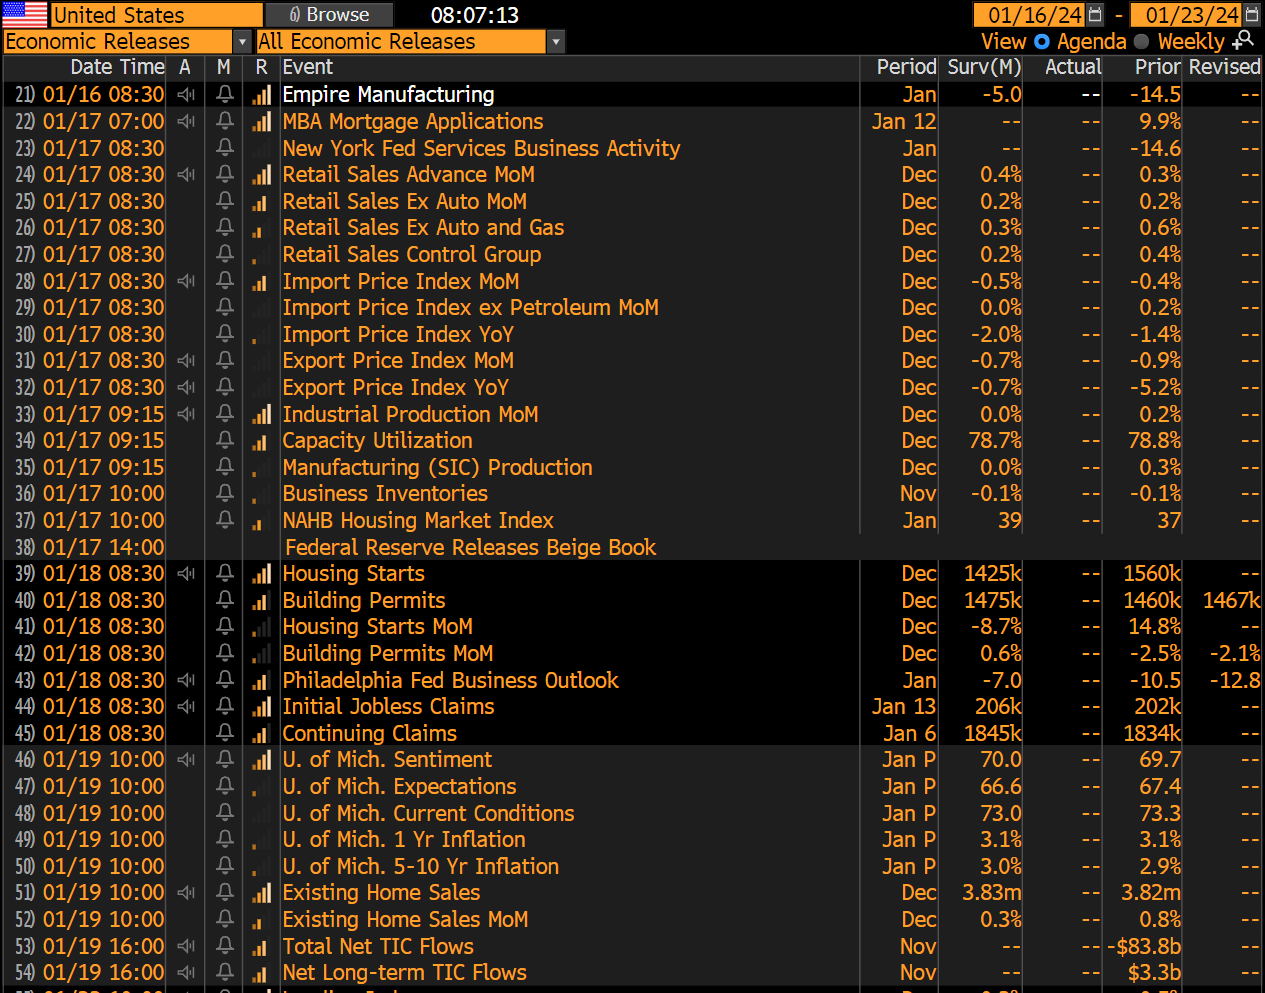
US Upcoming Economics
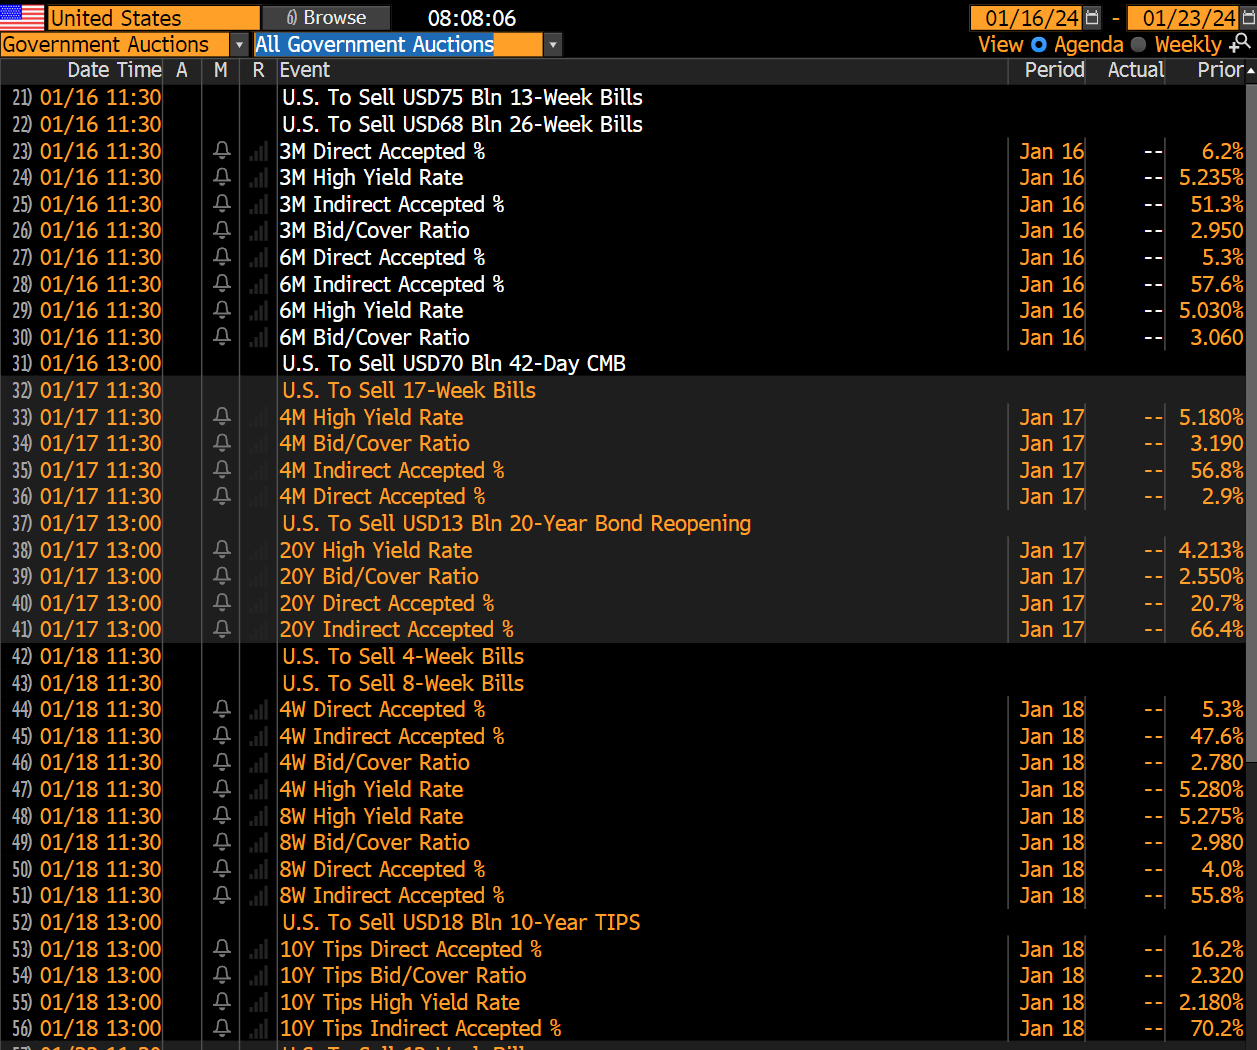
US Bond Yields & Auction Schedule

Index Updates
At TTG, I use Volume At Price in my chart analysis and I use the MarketWebs Indicator to provide Value Areas & VPOCs which indicate significant support & resistance levels. Learn More Here about Volume At Price and the MarketWebs.
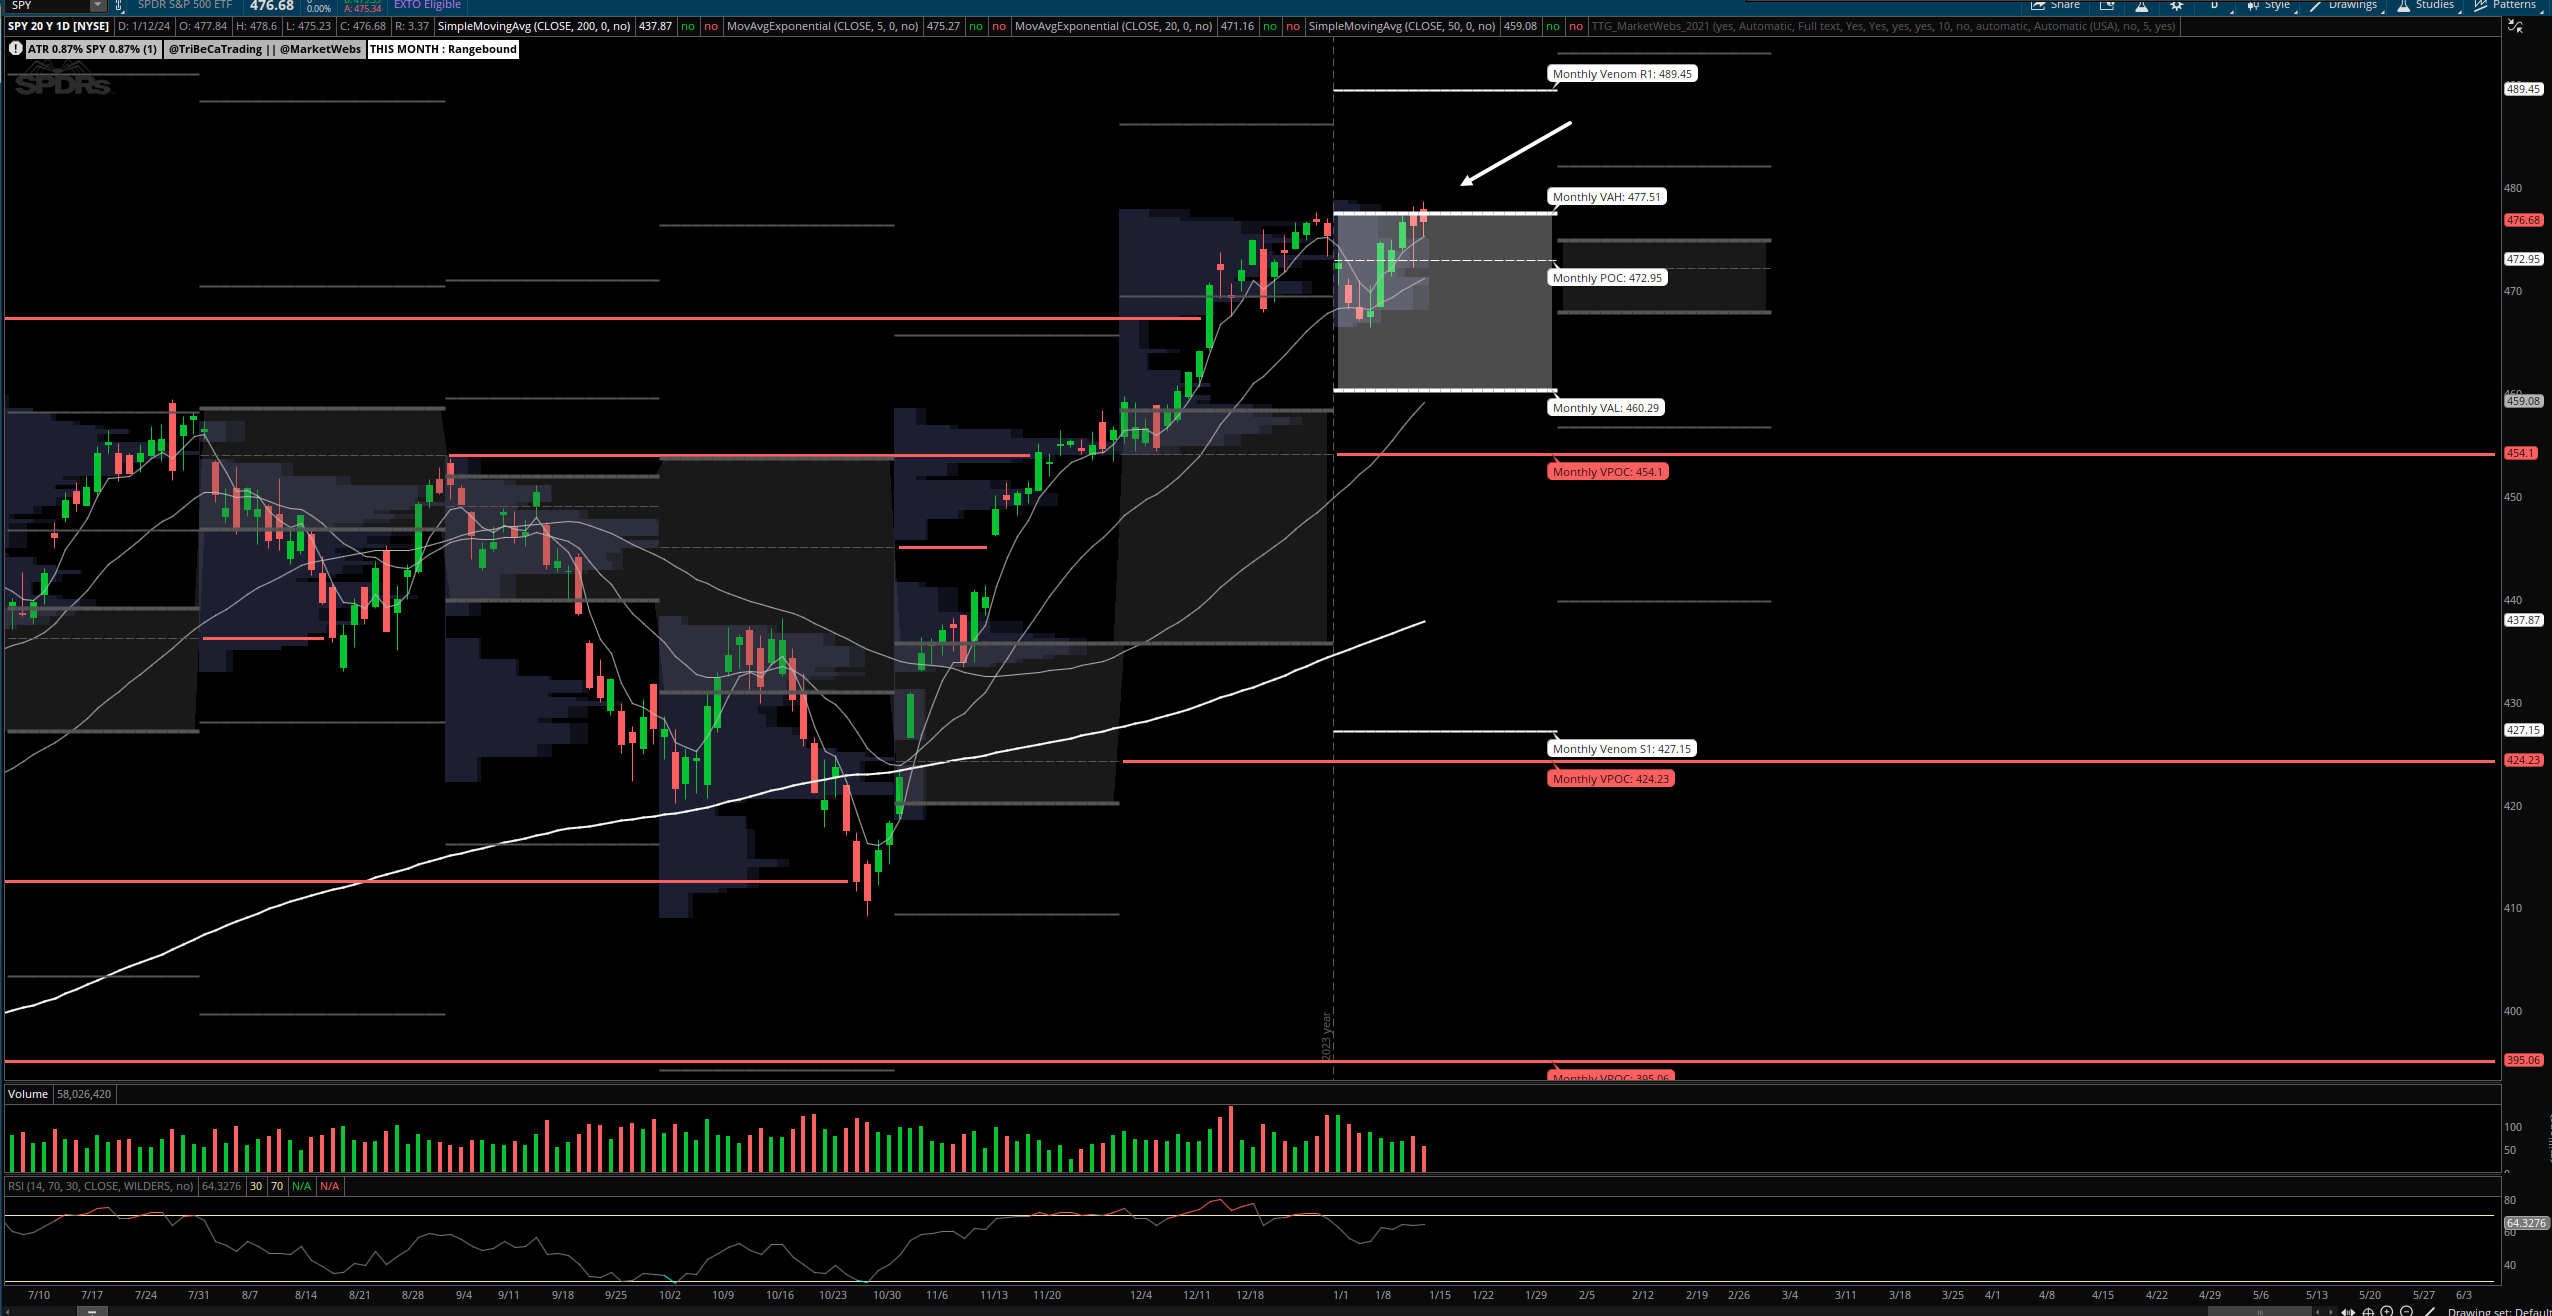
SPY- S&P ETF - Price ind -0.3% after a 3d weekend and continues to hang around the top of Jan Value Area... level to watch here is $477.51
Note, there is significant strength in the US Dollar this morning +0.8% indicating “risk off” this morning
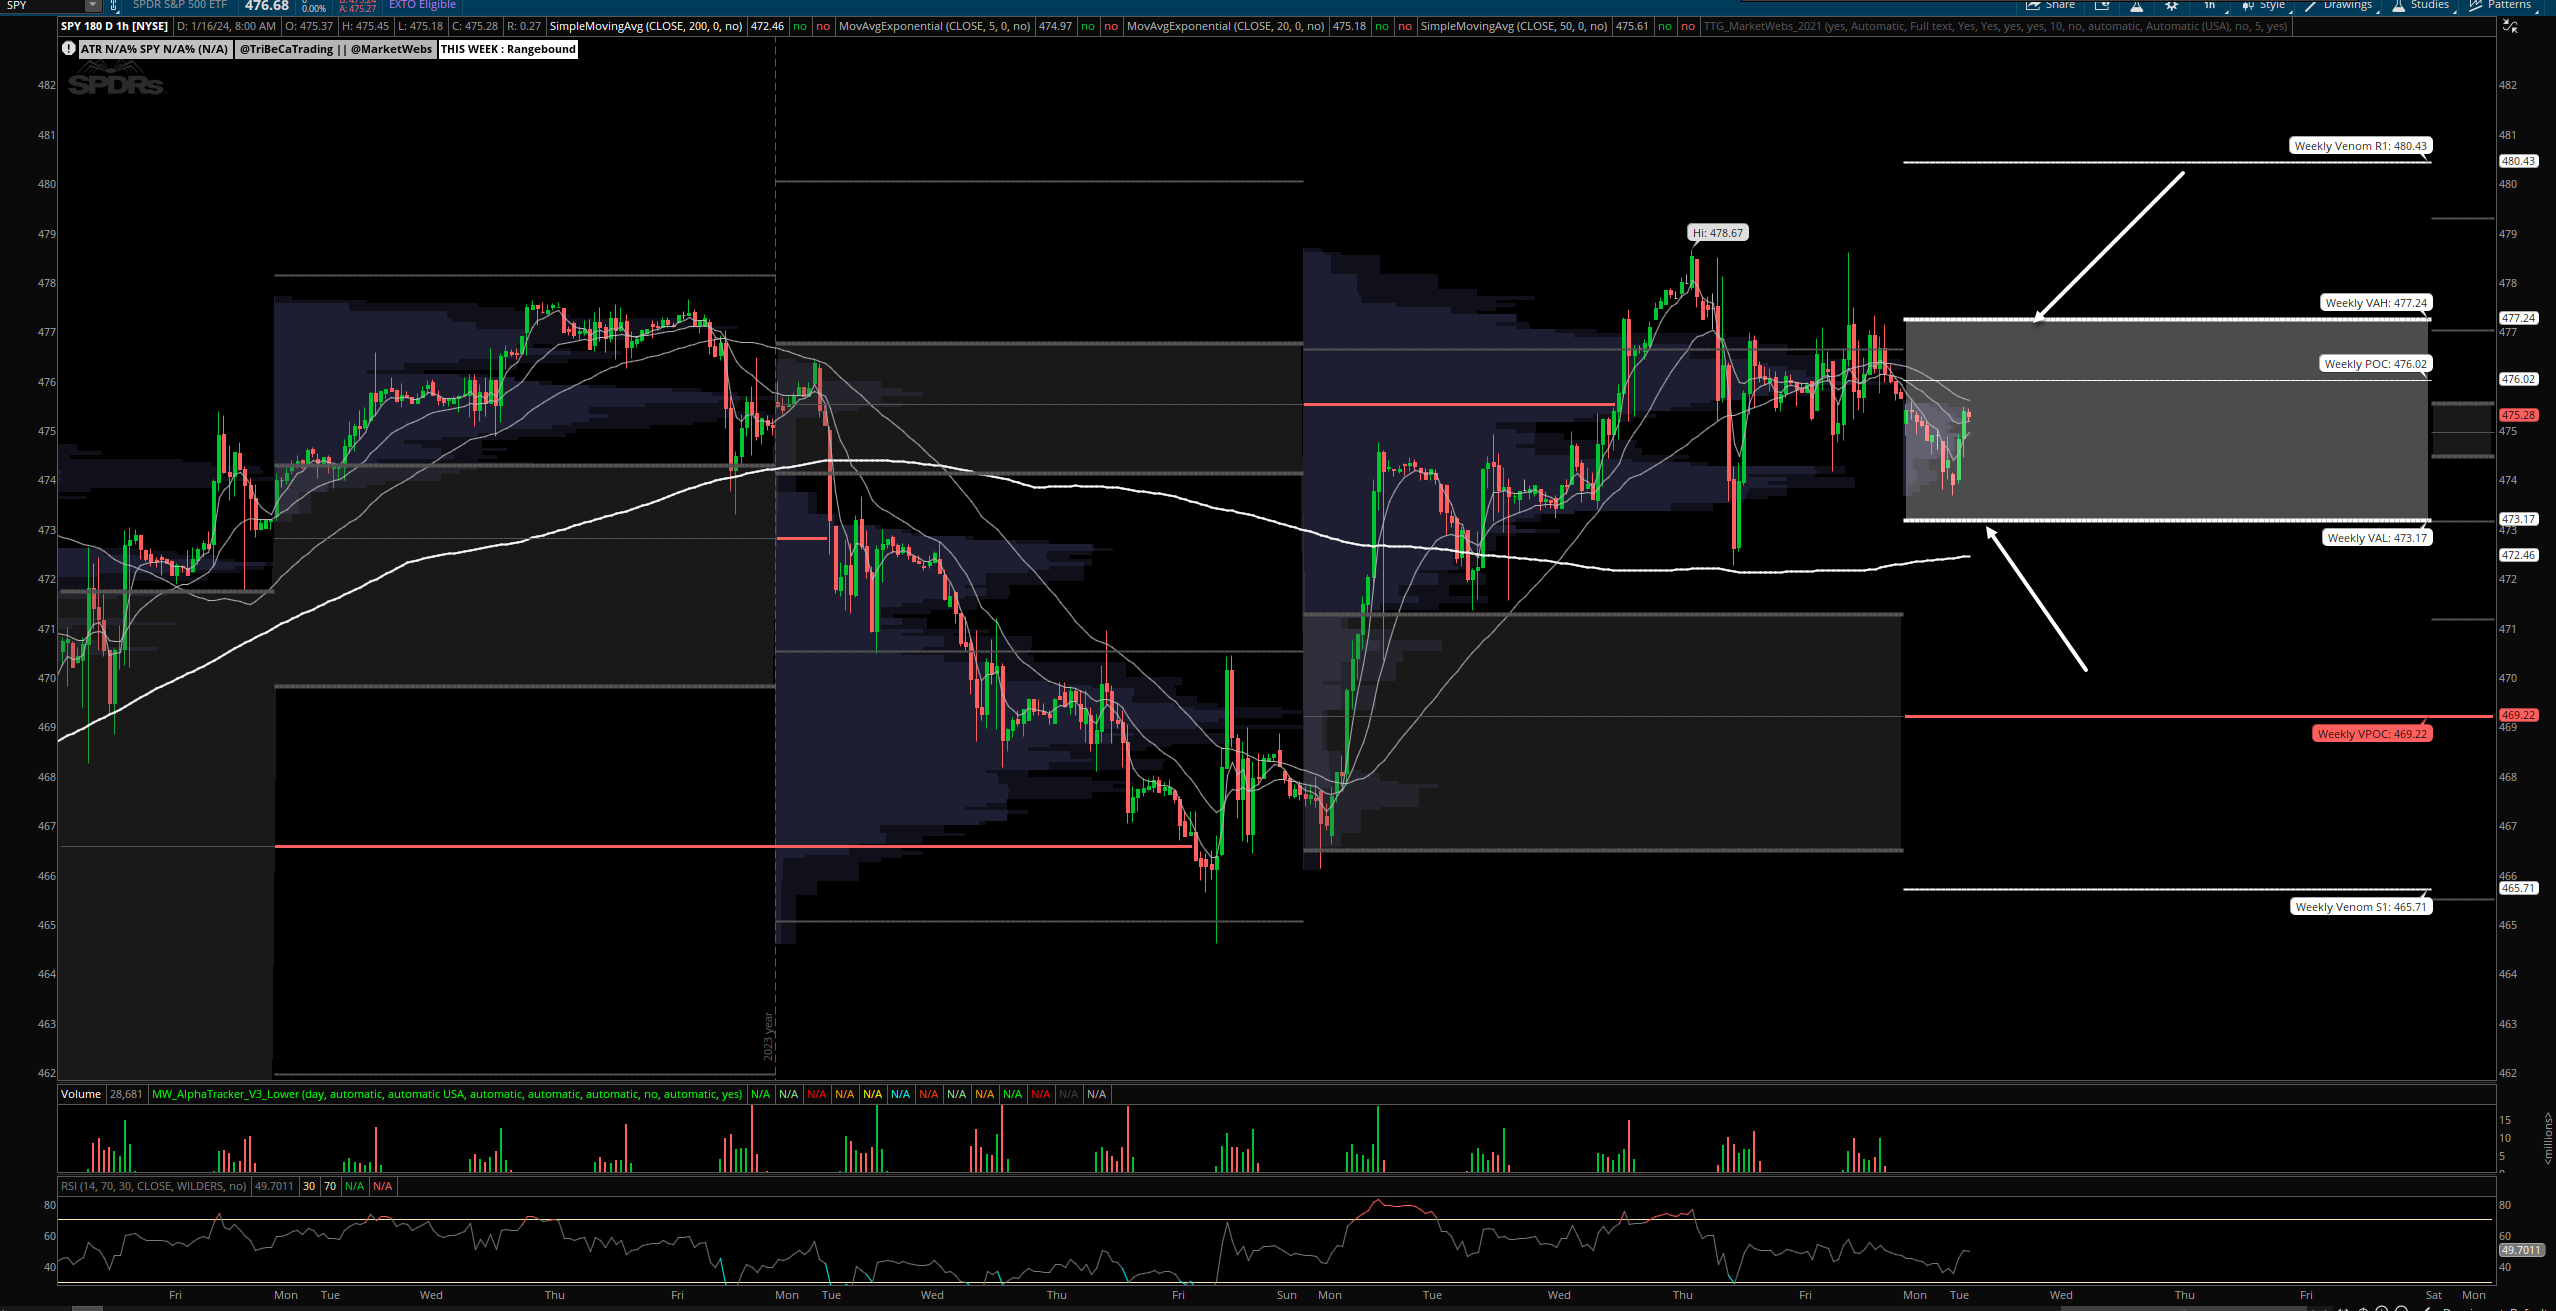
1hr chart: Price starts inside its new Value Area for the week, resistance $477.24 / support $473.17
QQQ - NDX 100 ETF - Daily chart: Price ind -0.5% and similar to the S&P has a fight with the top of the Jan Value Area, the upside level to watch here is $412.23

1hr chart: Price starts inside its new Value Area for the week, resistance $410.37 / support $404.75
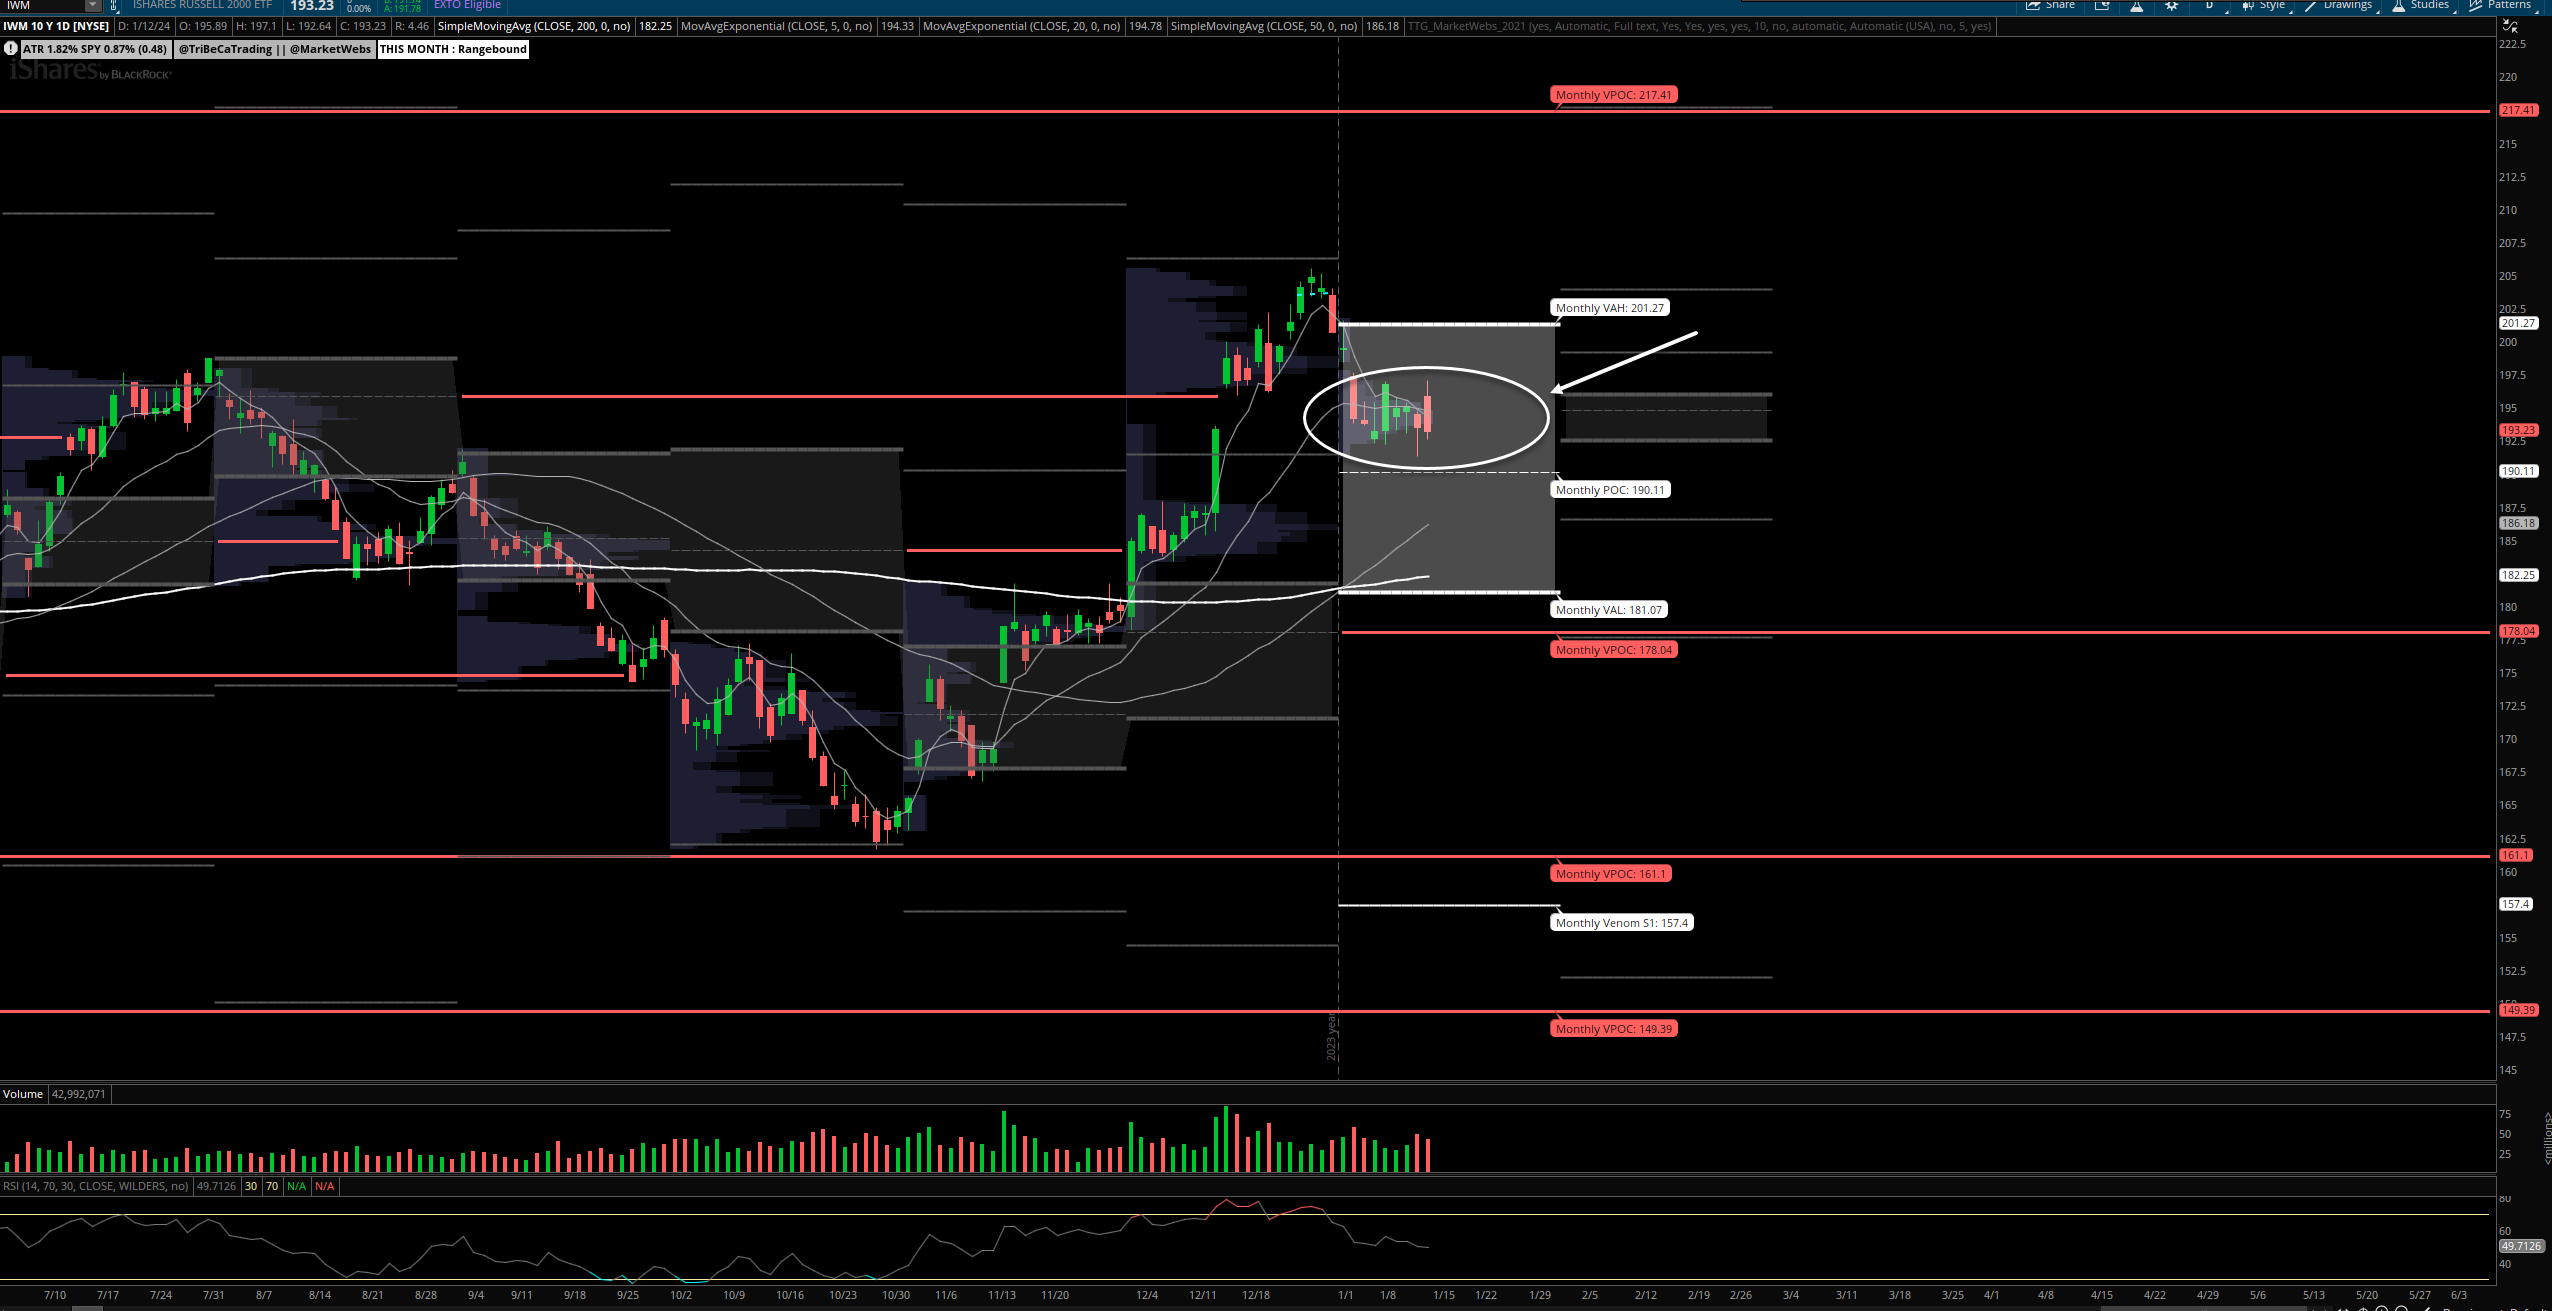
IWM - Russell Small Cap ETF- Price ind -0.7% and trailing once again & failed to move higher on Friday is below its short term 5 & 20d MAs (Moving Averages)
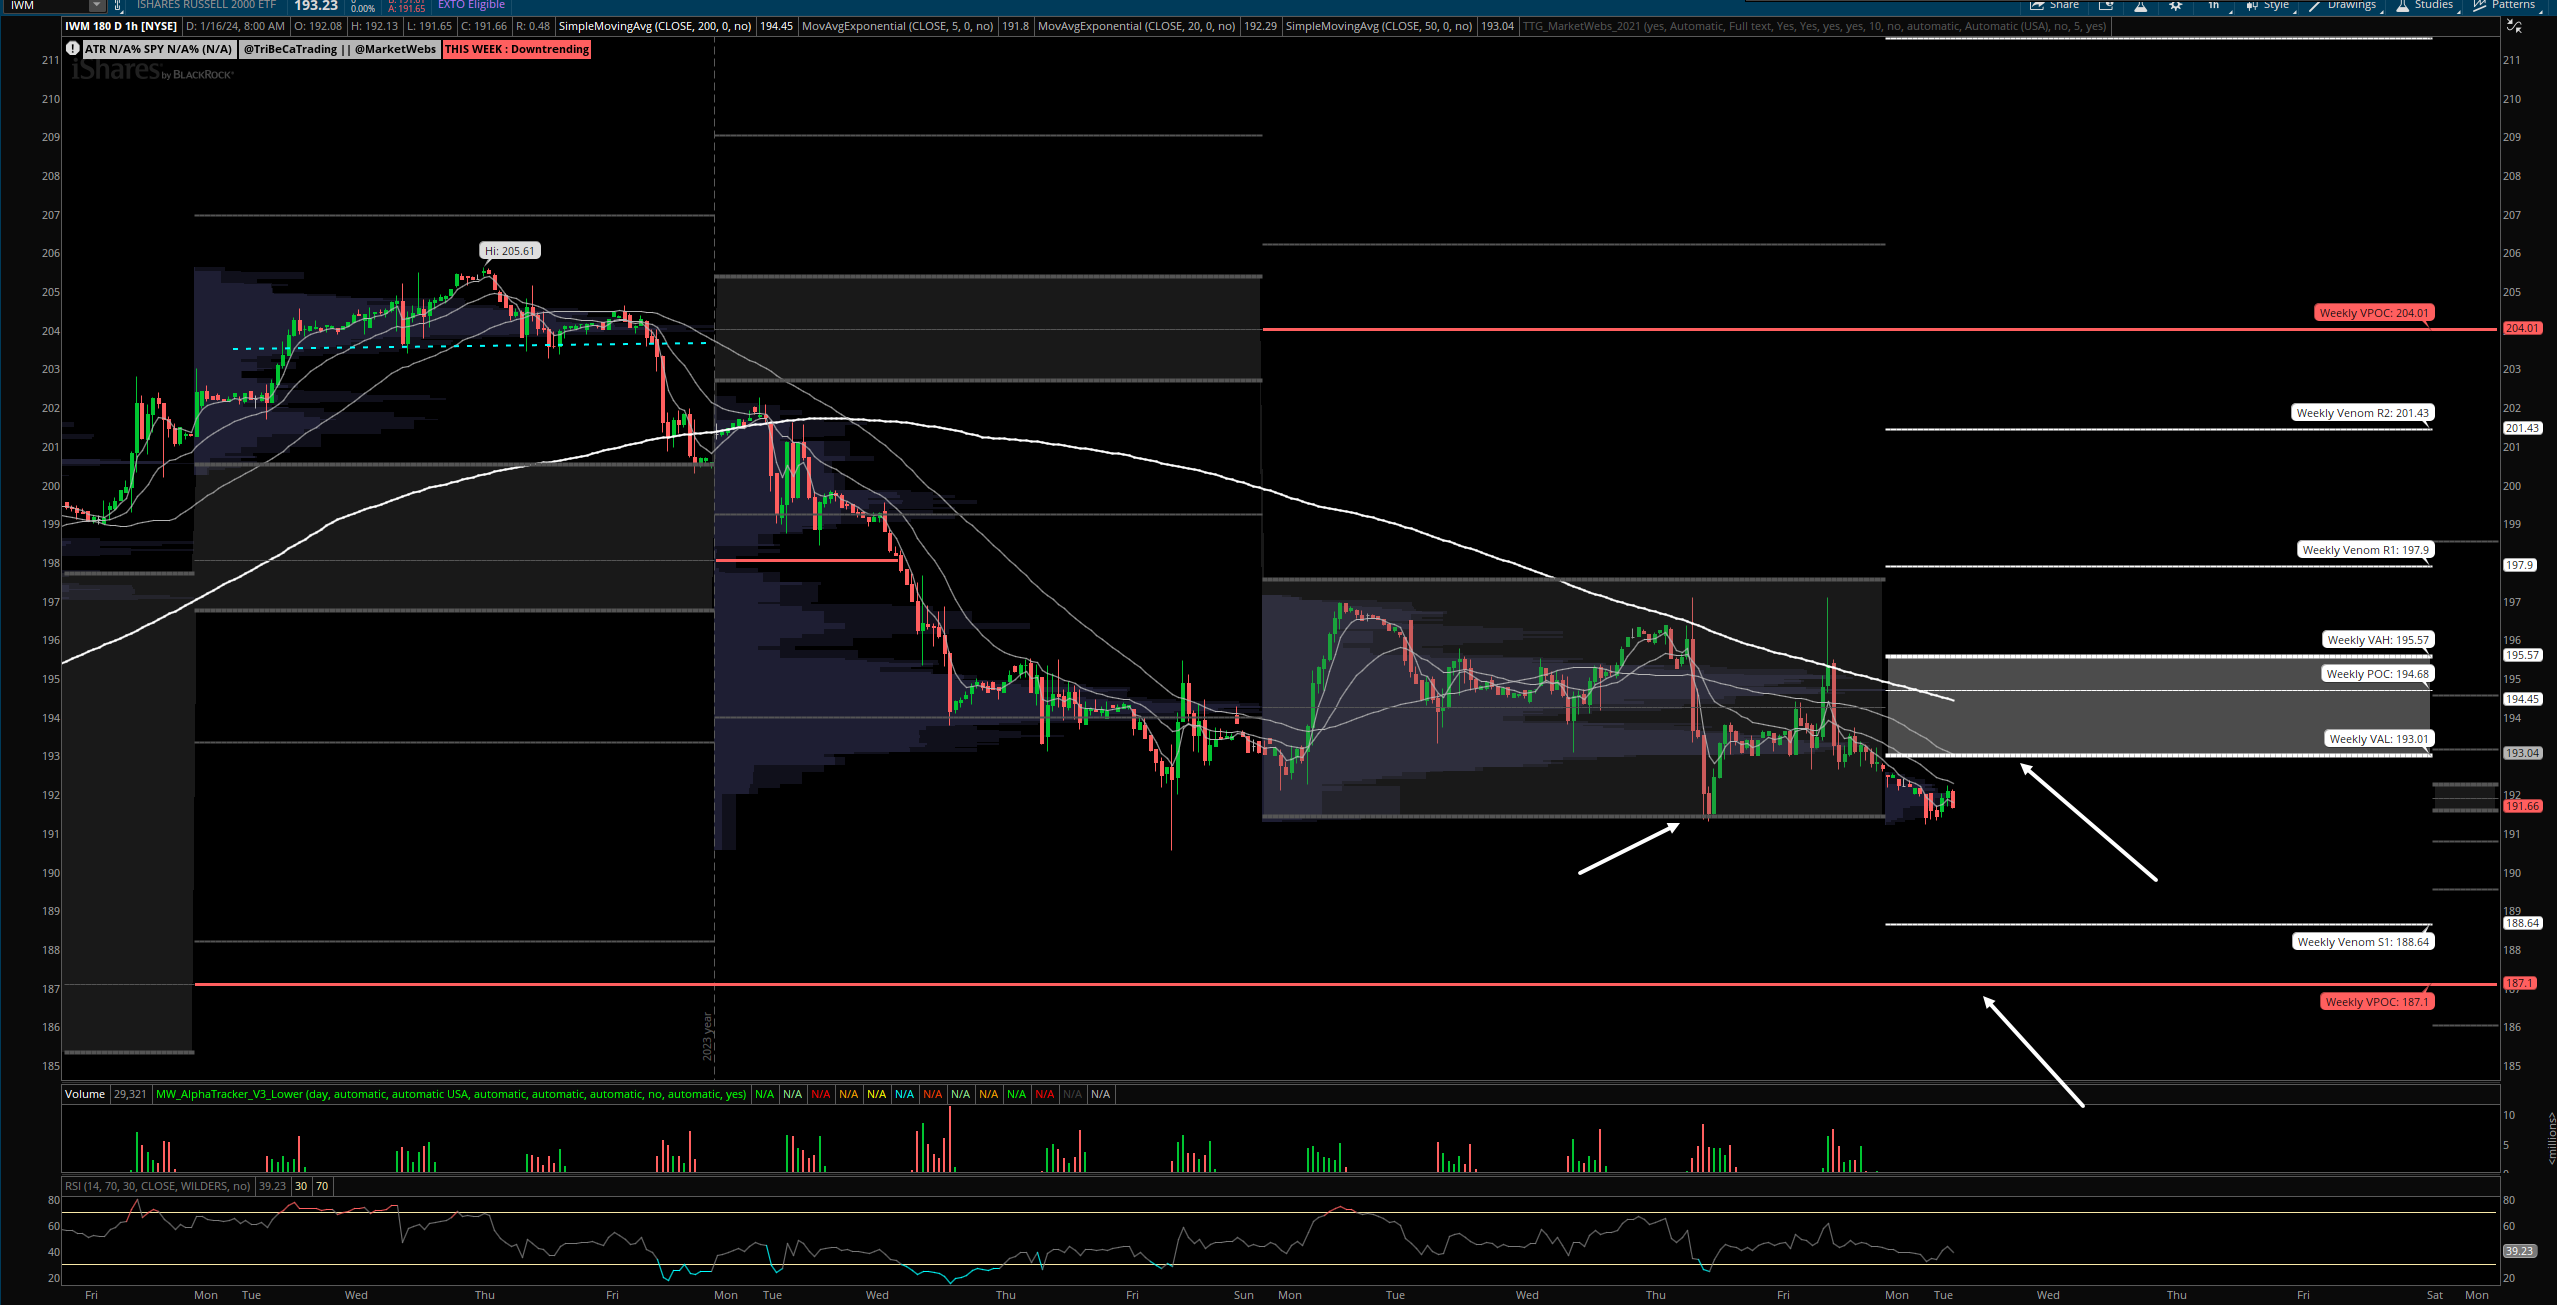
1hr chart: Price starting the week below its Value Area, resistance $193.01 and support to watch is last week's low and further lower is a VPOC (red line) $187.1
Here is today’s TTG Proprietary Stock Screen “Out of the Box” using Volume At Price
names trending above their Value Areas (on 3 multiple timeframes & not super extended)
Keep reading with a 7-day free trial
Subscribe to The Tribeca Trade Group to keep reading this post and get 7 days of free access to the full post archives.