

TTG Index Charts & Out of the Box Stock Screen 3/13/24 $SCCO
TTG Index Charts & Out of the Box Stock Screen 3/13/24 $SCCO
Out of the Box MarketWebs Screen
US Dollar -0.1% / 30yr Bonds -0.2% / Crude +1.6% & Nat Gas -1.3% / Gold +0.2% / Copper +2.0% / BTC +2.7%
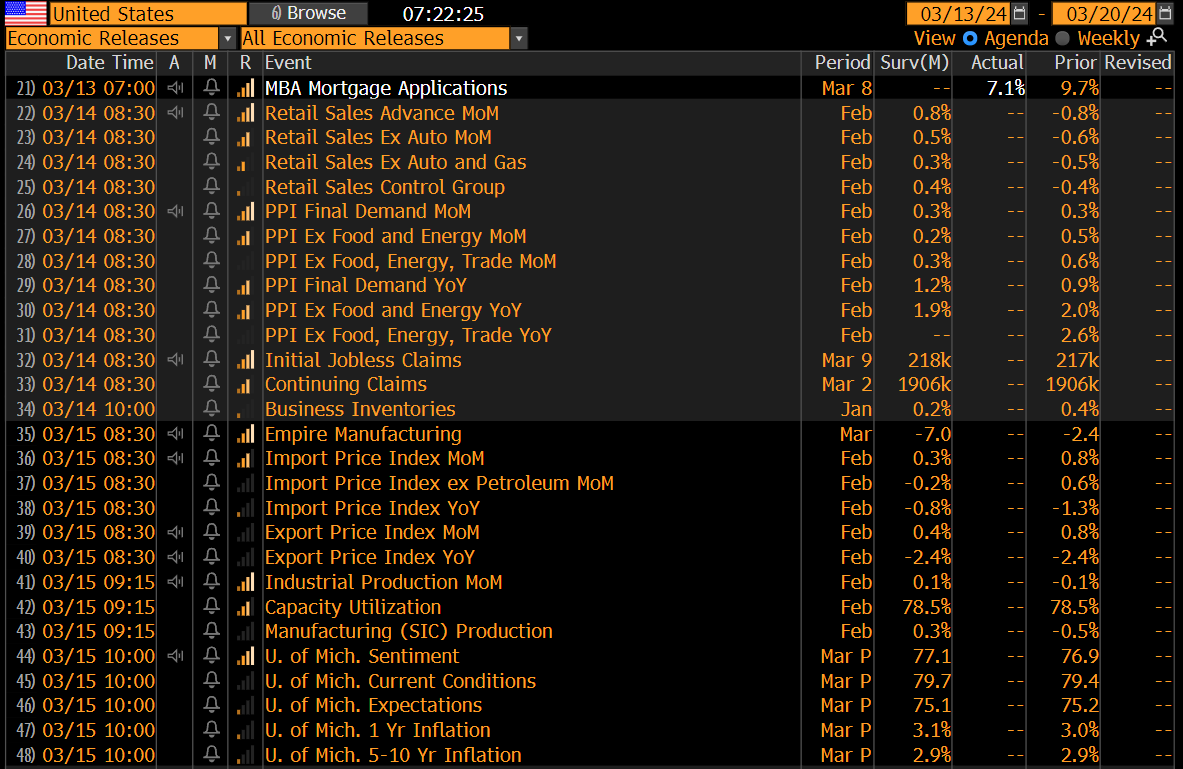
US Upcoming Economics
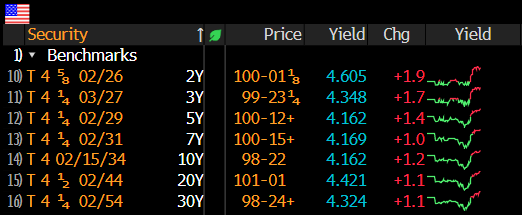
US Bond Yields
Index Updates
At TTG, I use Volume At Price in my chart analysis and I use the MarketWebs Indicator to provide Value Areas & VPOCs which indicate significant support & resistance levels. Learn More Here about Volume At Price and the MarketWebs.
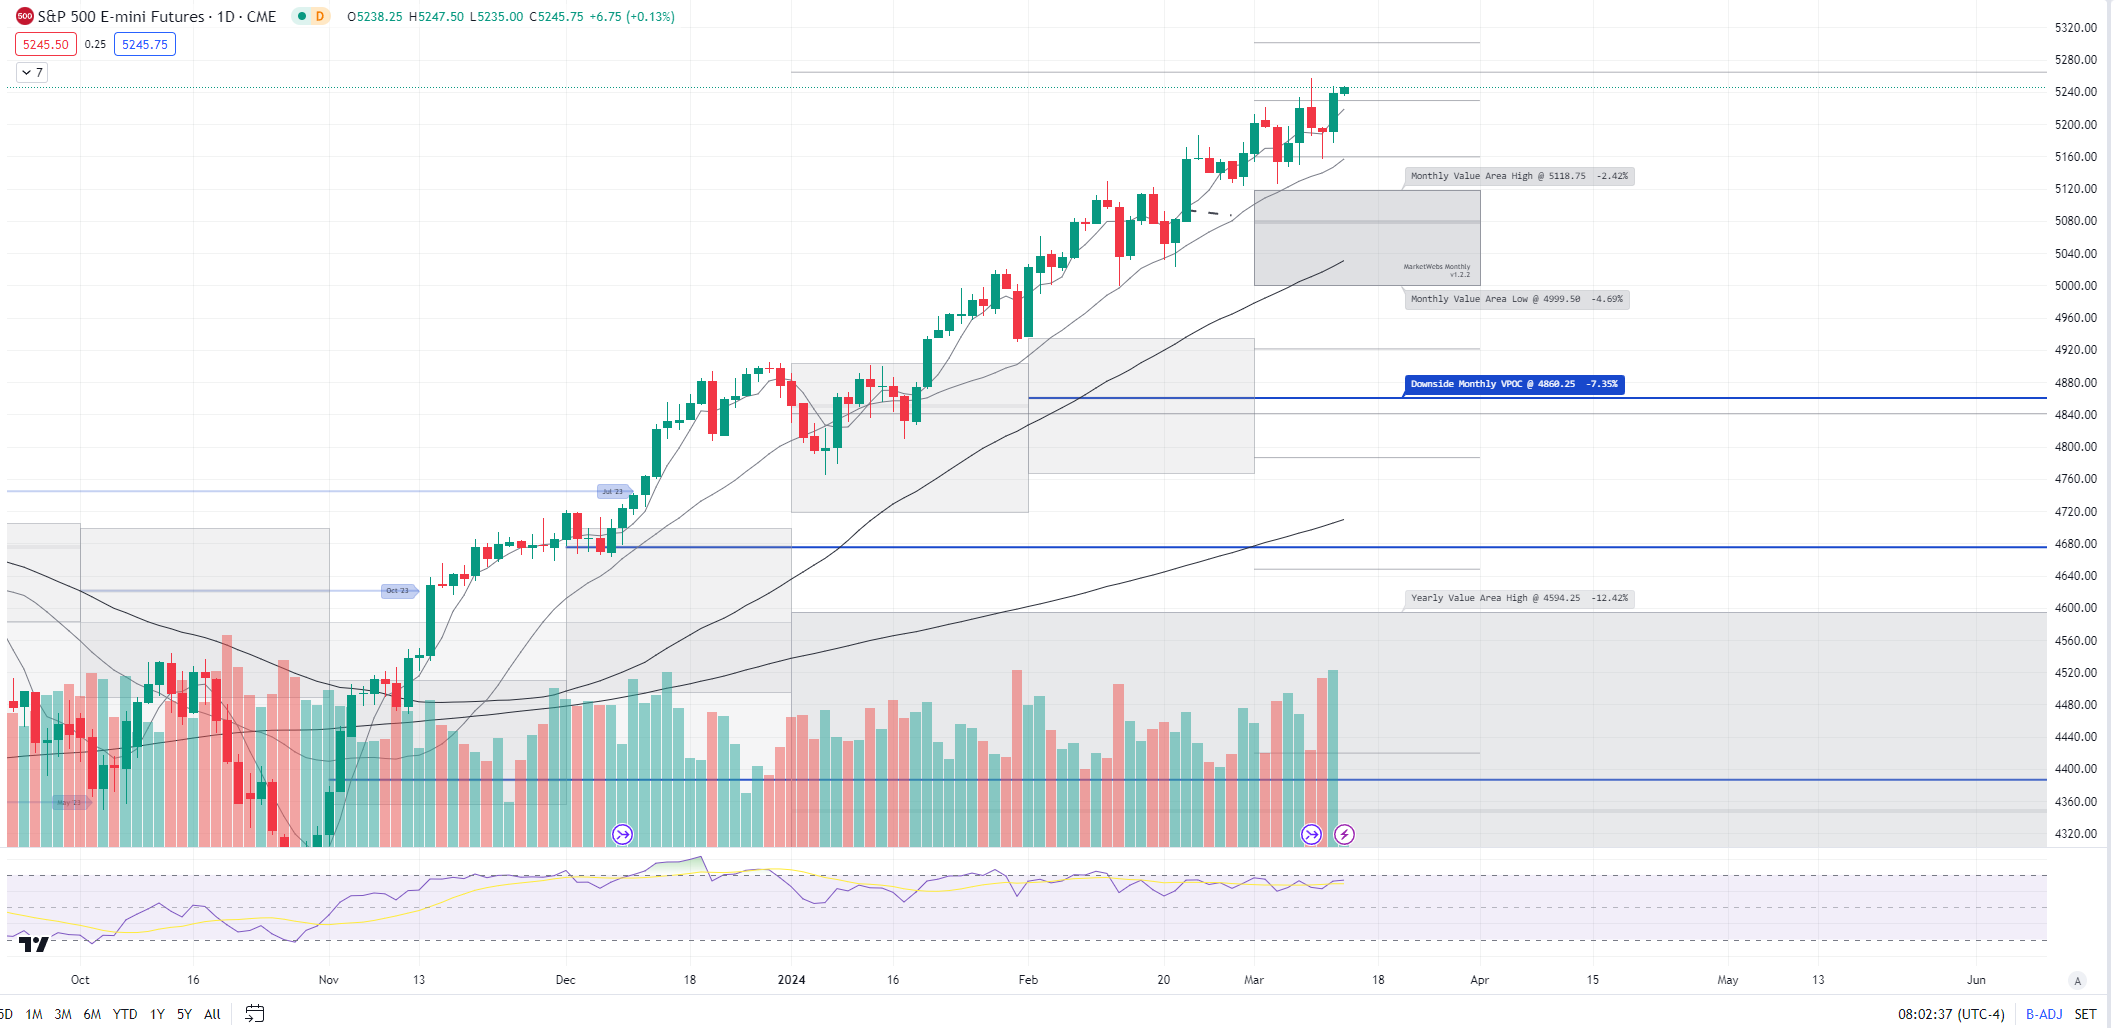
ES_F - SPX Futures - Price flattish to start Wednesday and now back up at the upper end of the channel - note this is previously been a rejection area when price gets to the upper end of the channel so something to be mindful of...
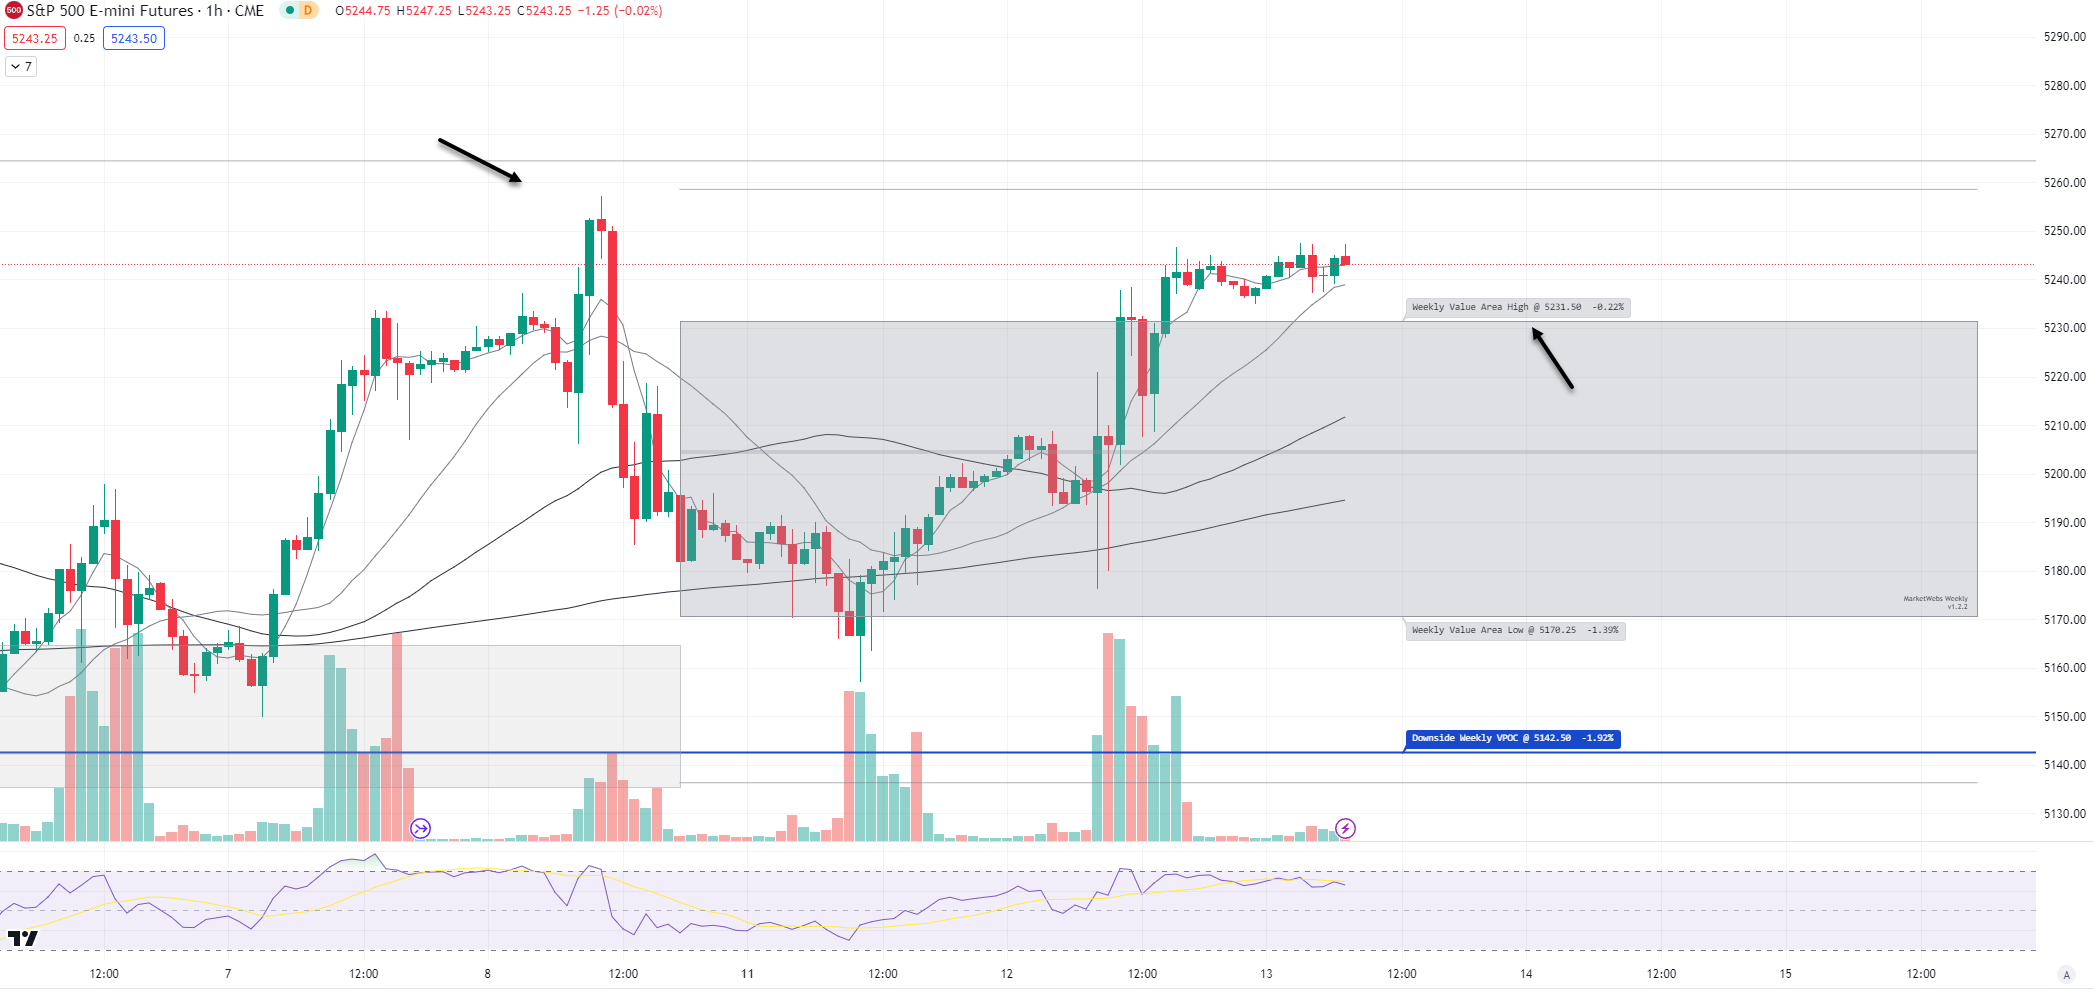
1hr chart: Price is now above its Value Area for the week, support is now 5231.5 and also note the last week's highs as short term resistance
QQQ - NDX 100 ETF - Daily chart: Price also flat after a big move yesterday (QQQ +1.4%) and price is back above its Mar Value Area, support is now $439.06
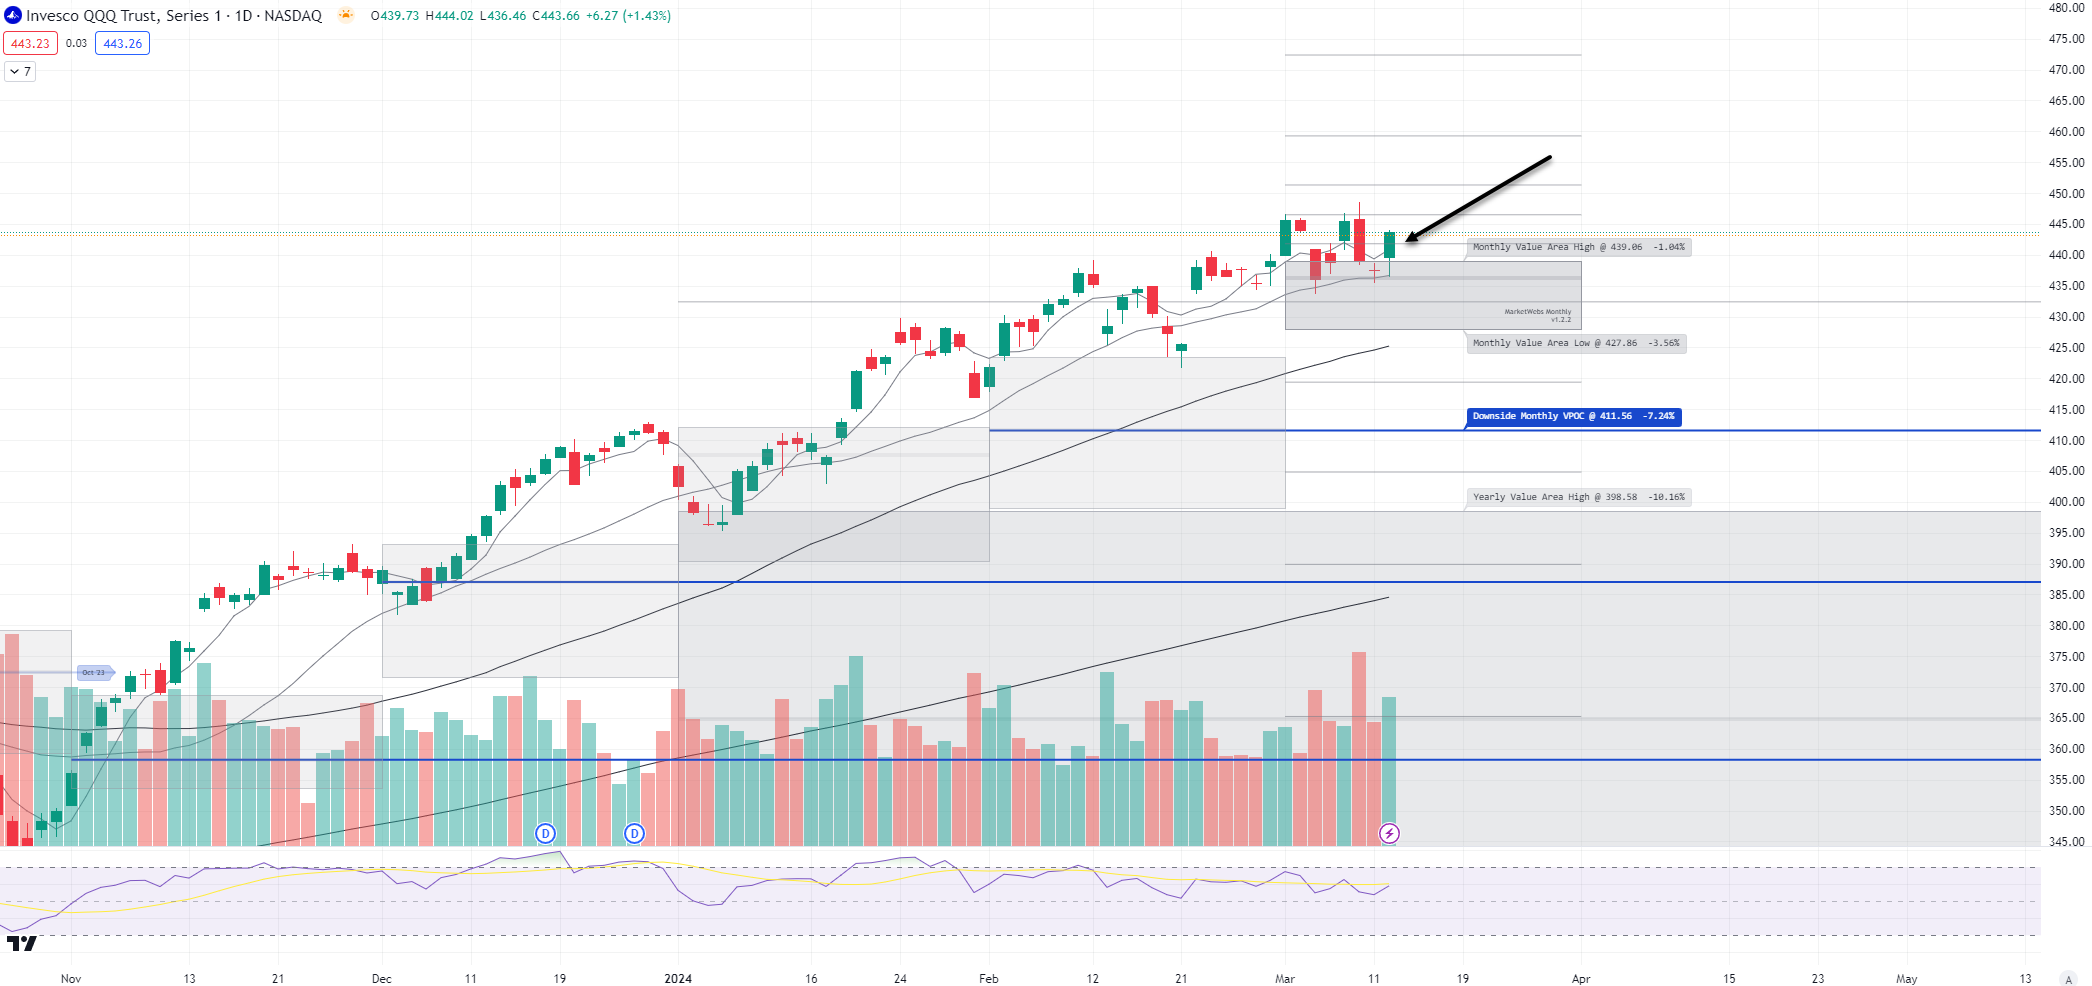
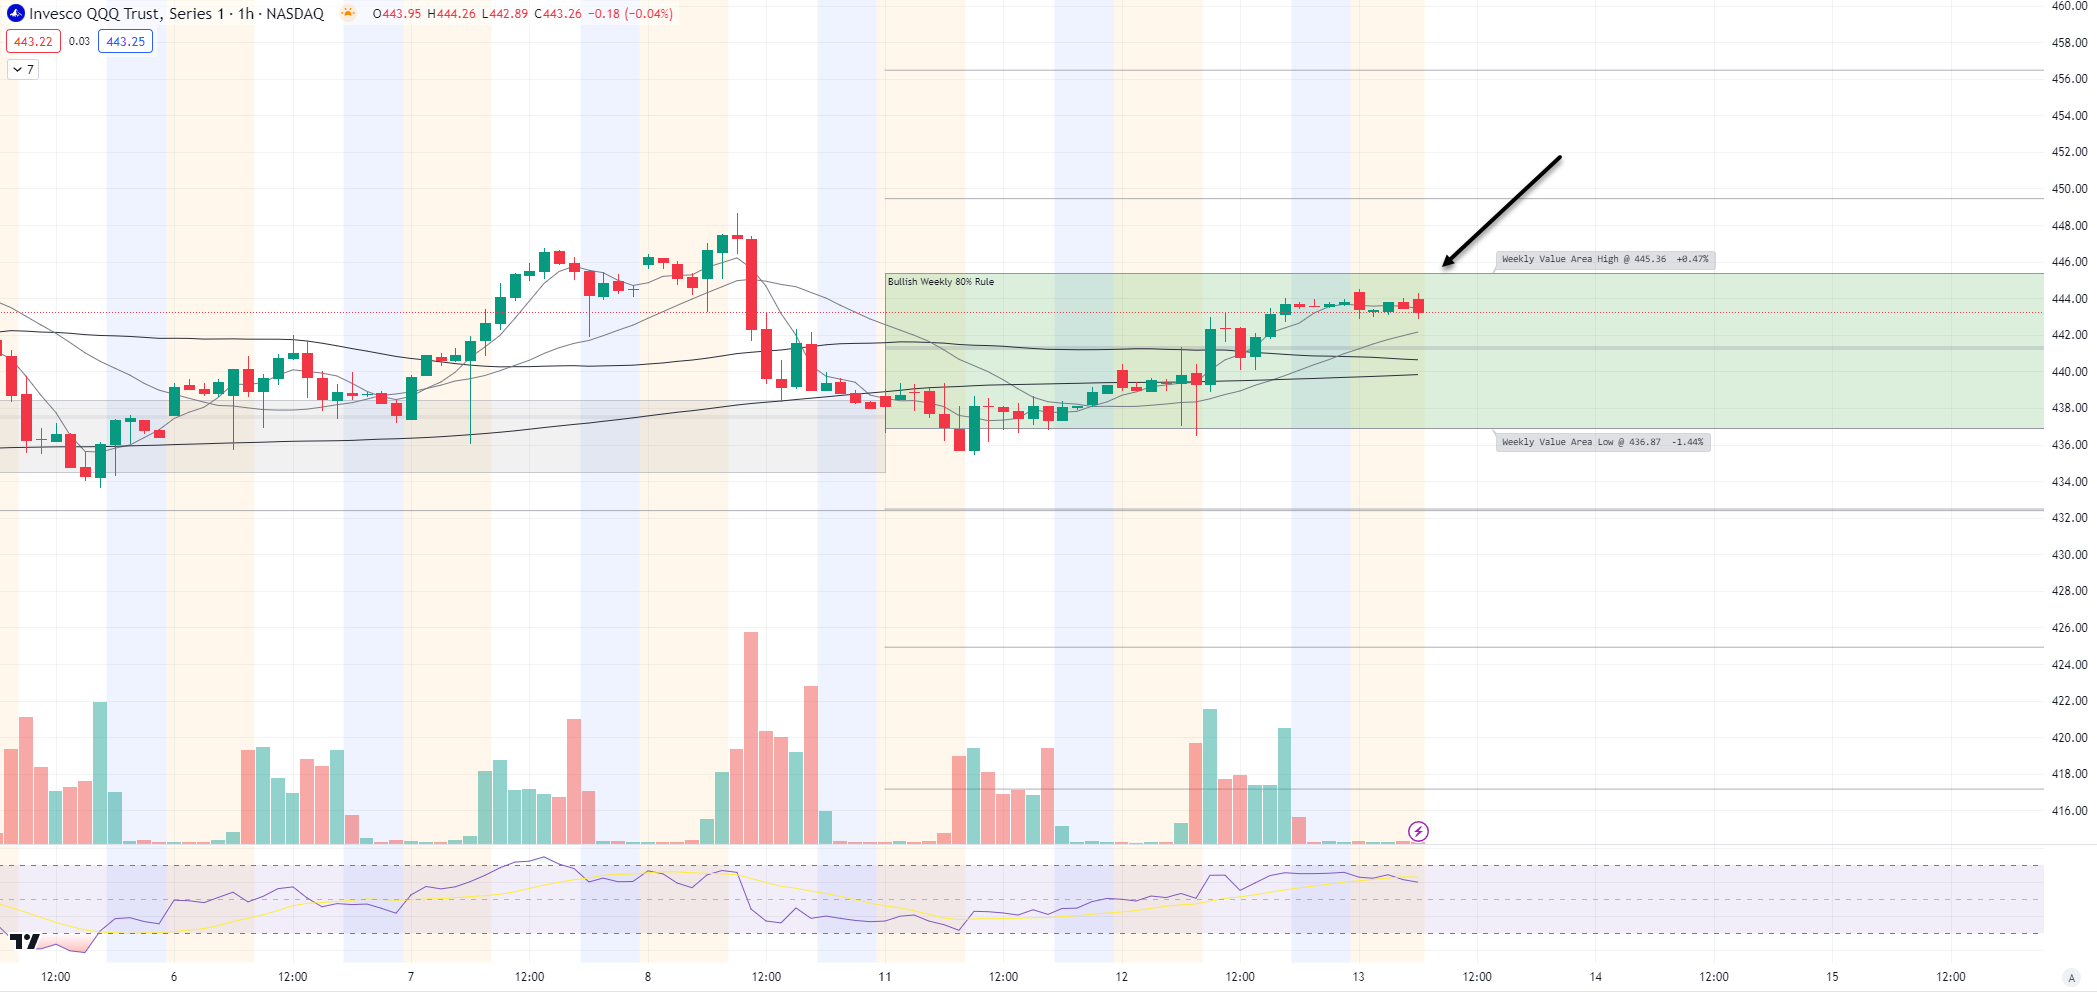
1hr chart: Bullish 80% rule still in effect and watch for a move to $445.36 for the rule to complete.
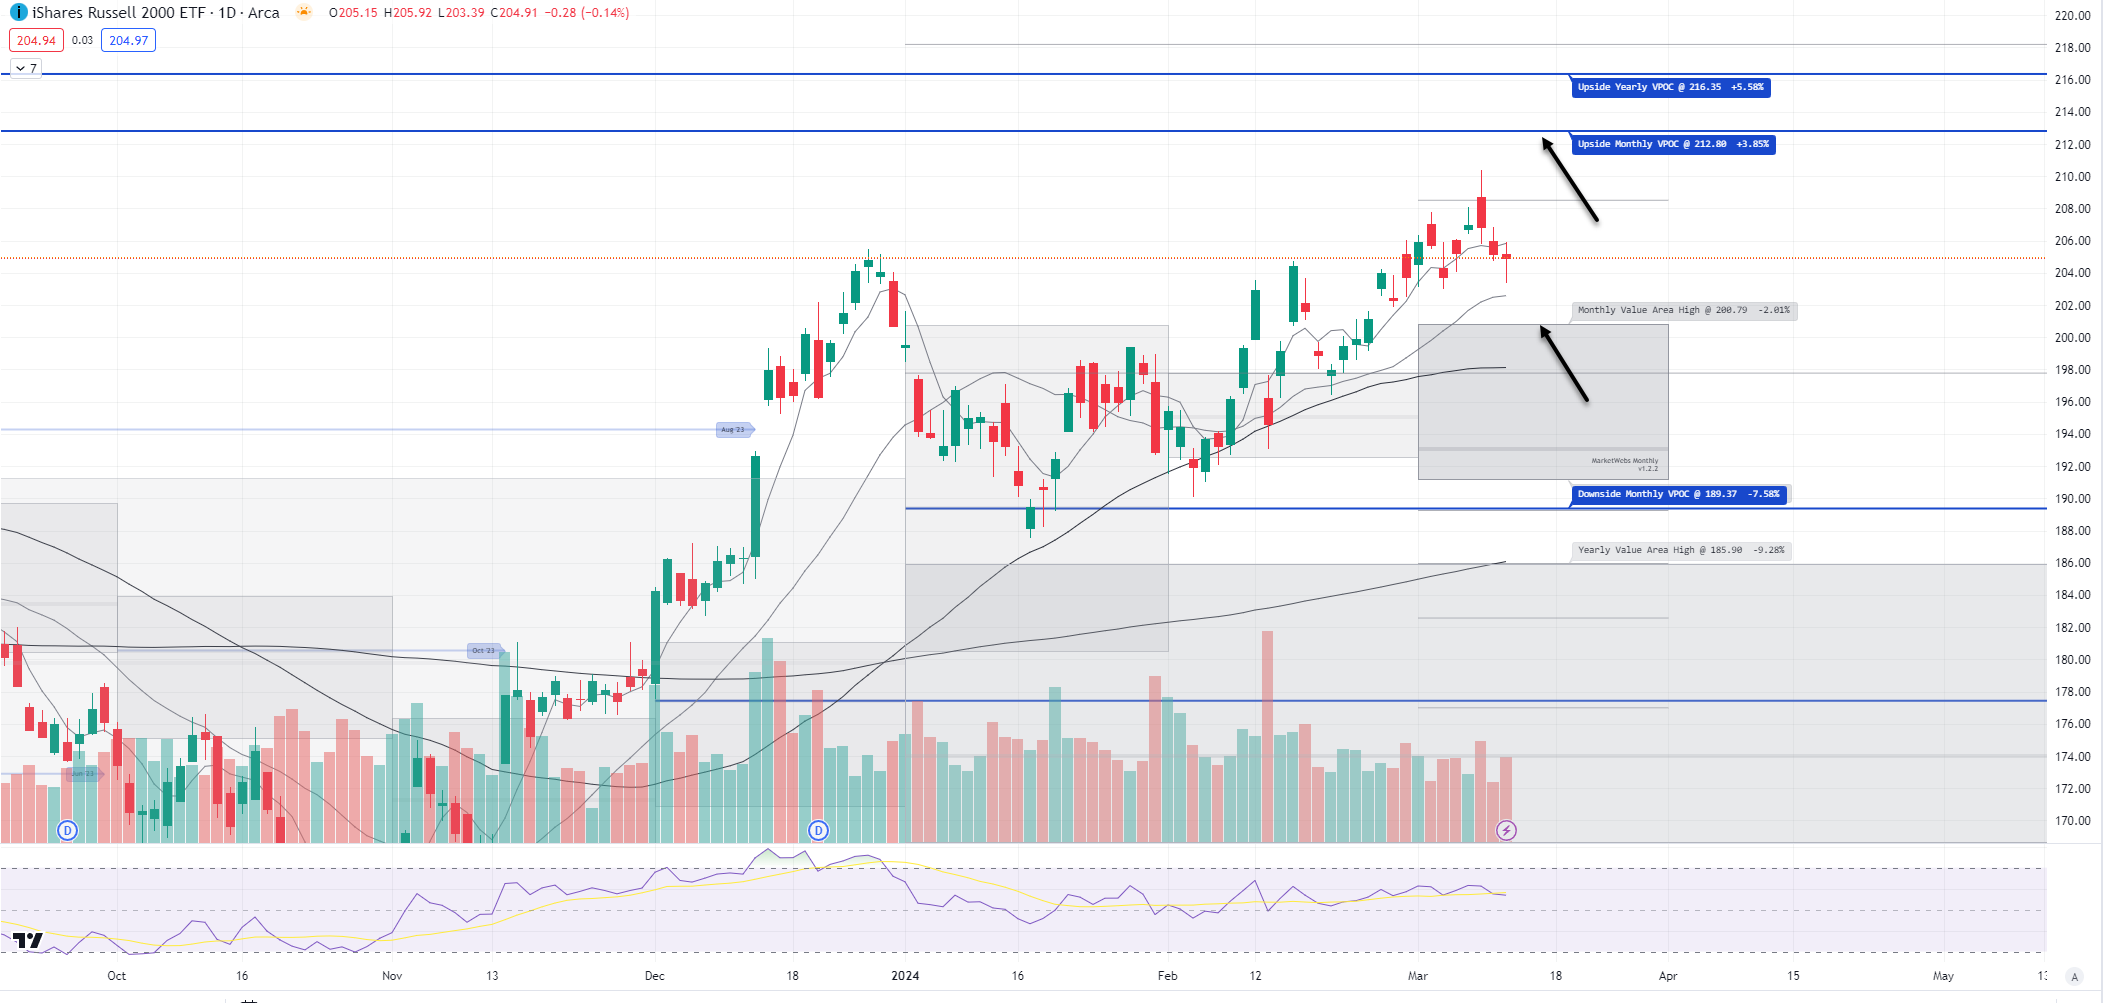
IWM - Russell Small Cap ETF- Price also ~ flat this morning - the Small Caps underperformed yesterday as Rates went higher (TNX +1.2%) as rates are having more of an impact on IWM. For now, price remains above its 20d MA (Moving Average) and Mar Value Area.
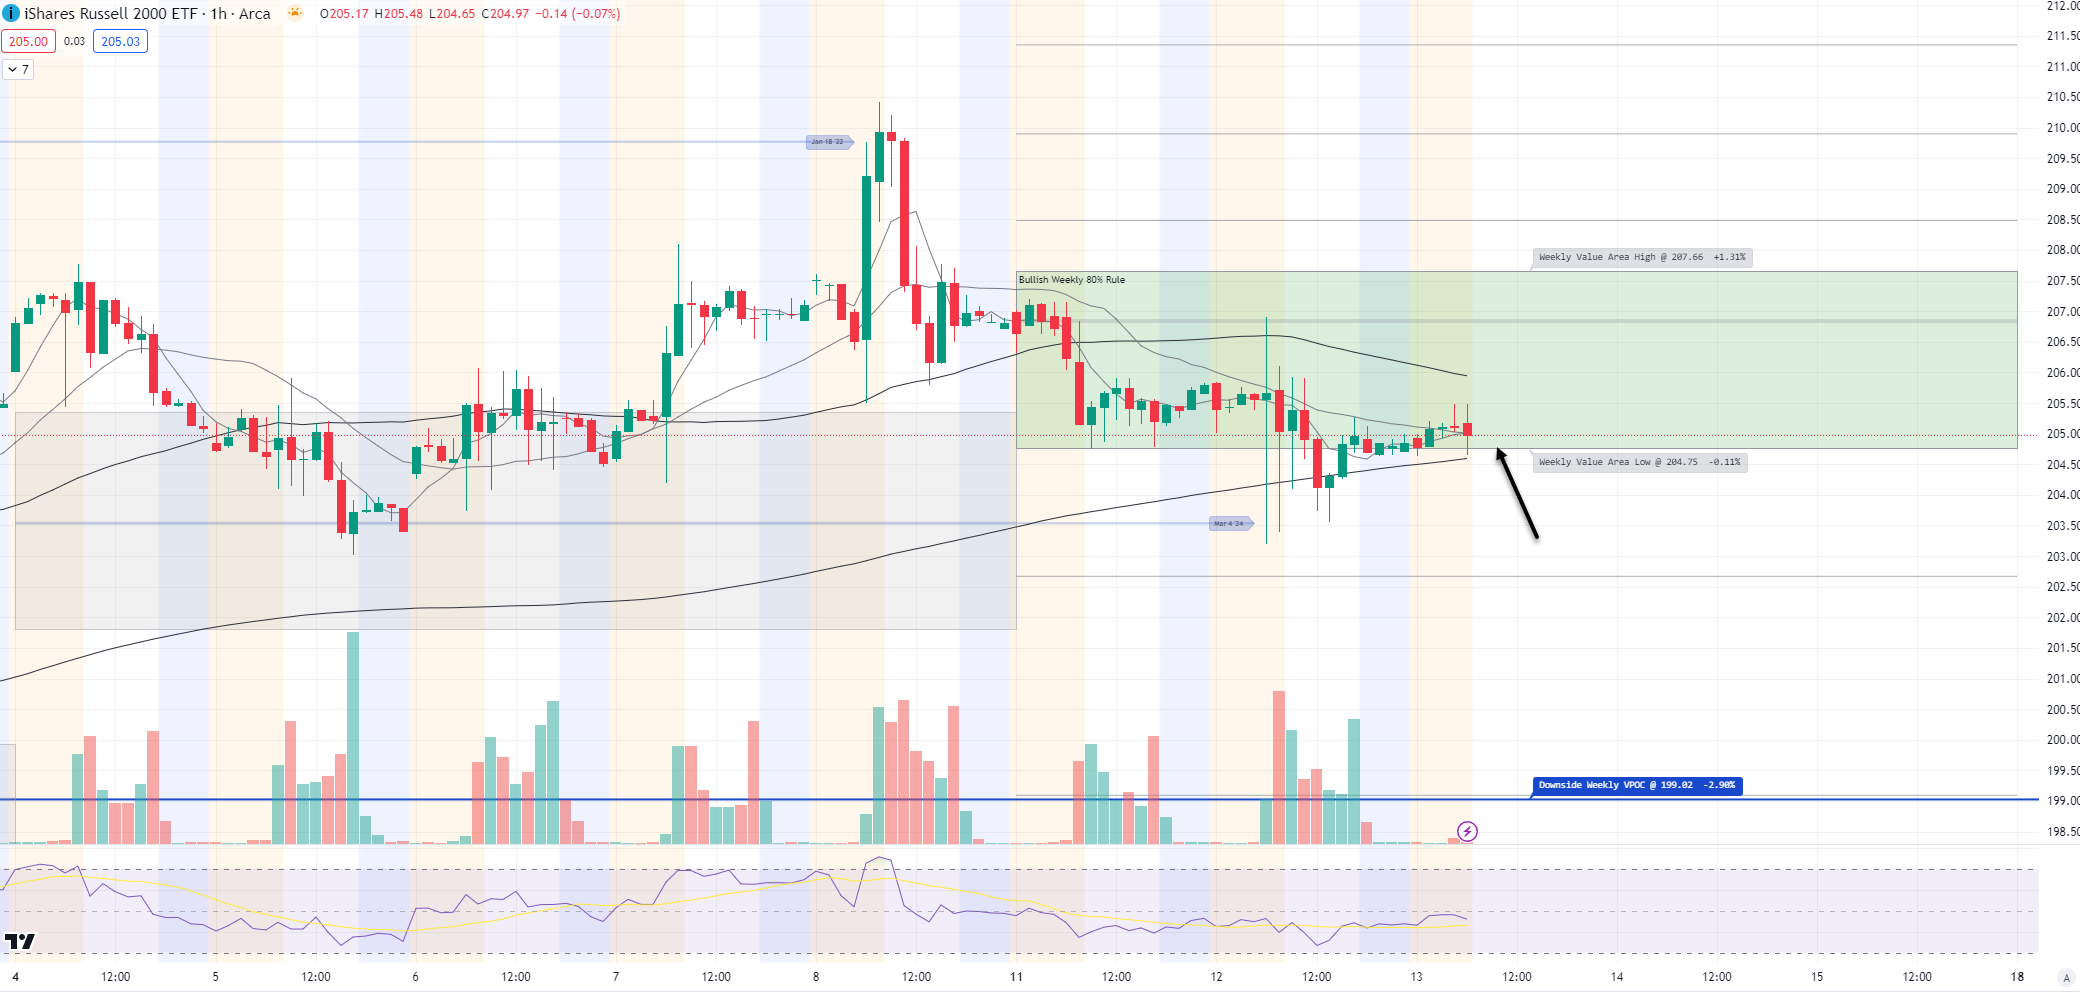
1hr chart: Price inside its Value Area, support to watch $204.75
Here is today’s TTG Proprietary Stock Screen “Out of the Box” using Volume At Price
names trending above their Value Areas (on 3 multiple timeframes & not super extended)
Keep reading with a 7-day free trial
Subscribe to The Tribeca Trade Group to keep reading this post and get 7 days of free access to the full post archives.