

TTG Index Charts & Out of the Box Stock Screen 3/26/24 $TRN
TTG Index Charts & Out of the Box Stock Screen 3/26/24 $TRN
Out of the Box MarketWebs Screen
US Dollar -0.1% / 30yr Bonds +0.3% / Crude +0.3% & Nat Gas +0.5% / Gold +1.0% / Copper -0.1% / BTC -0.5%
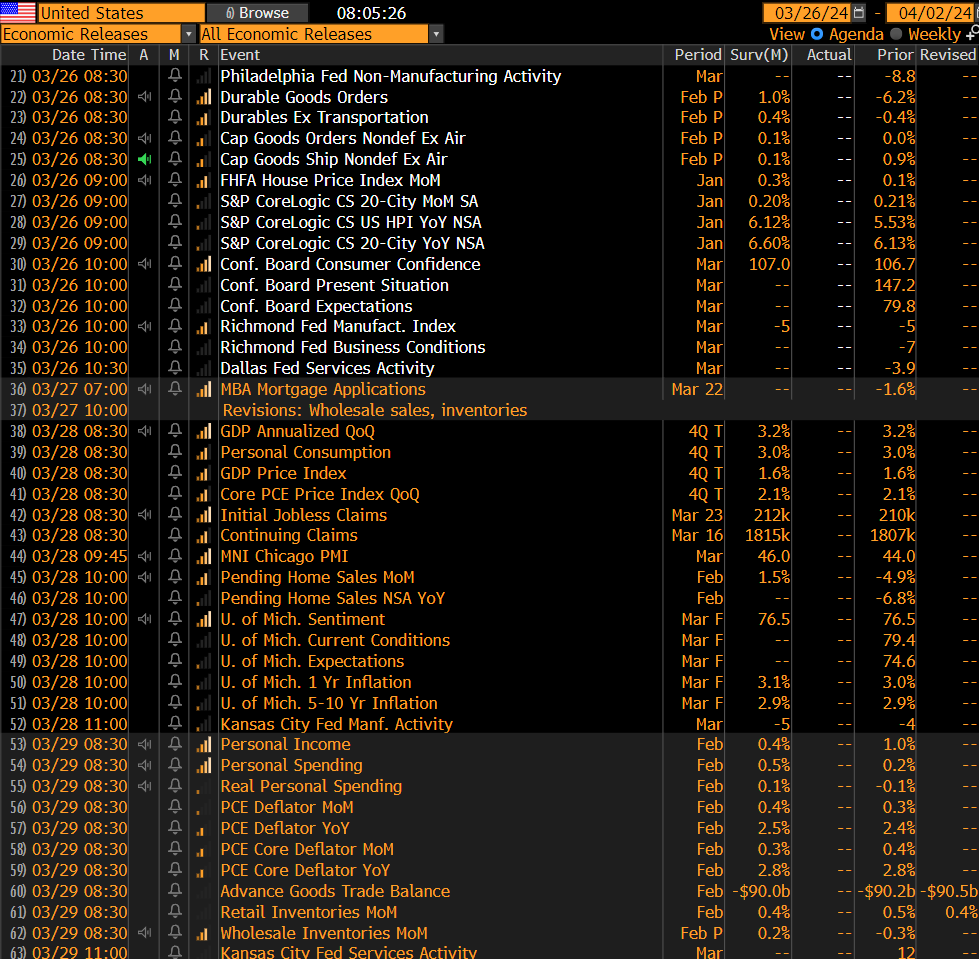
US Upcoming Economics
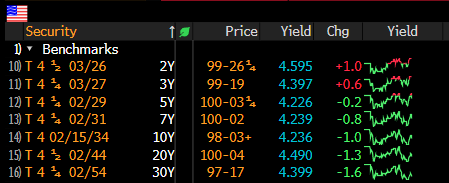
US Bond Yields
Index Updates
At TTG, I use Volume At Price in my chart analysis and I use the MarketWebs Indicator to provide Value Areas & VPOCs which indicate significant support & resistance levels. Learn More Here about Volume At Price and the MarketWebs.
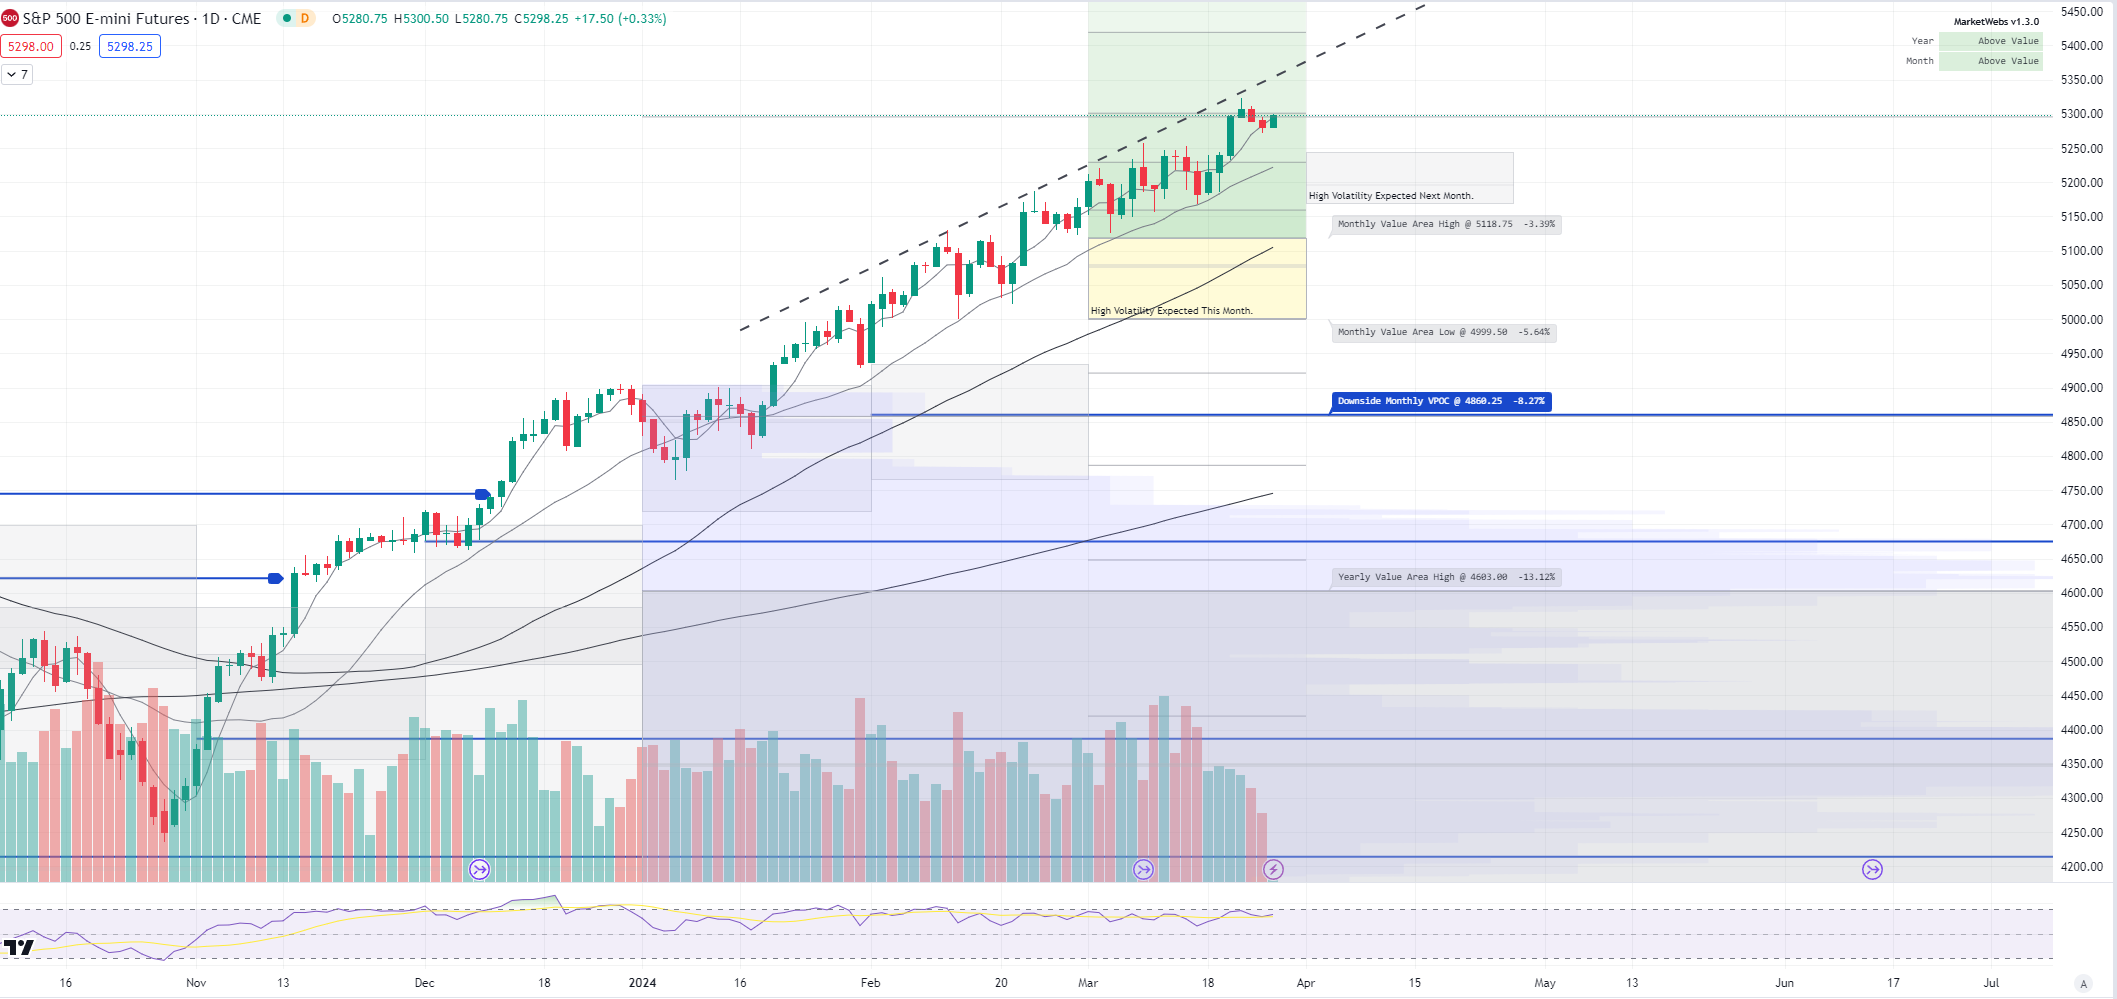
ES_F - SPX Futures - Price ind. +0.3% this morning and right in the middle of the uptrend channel
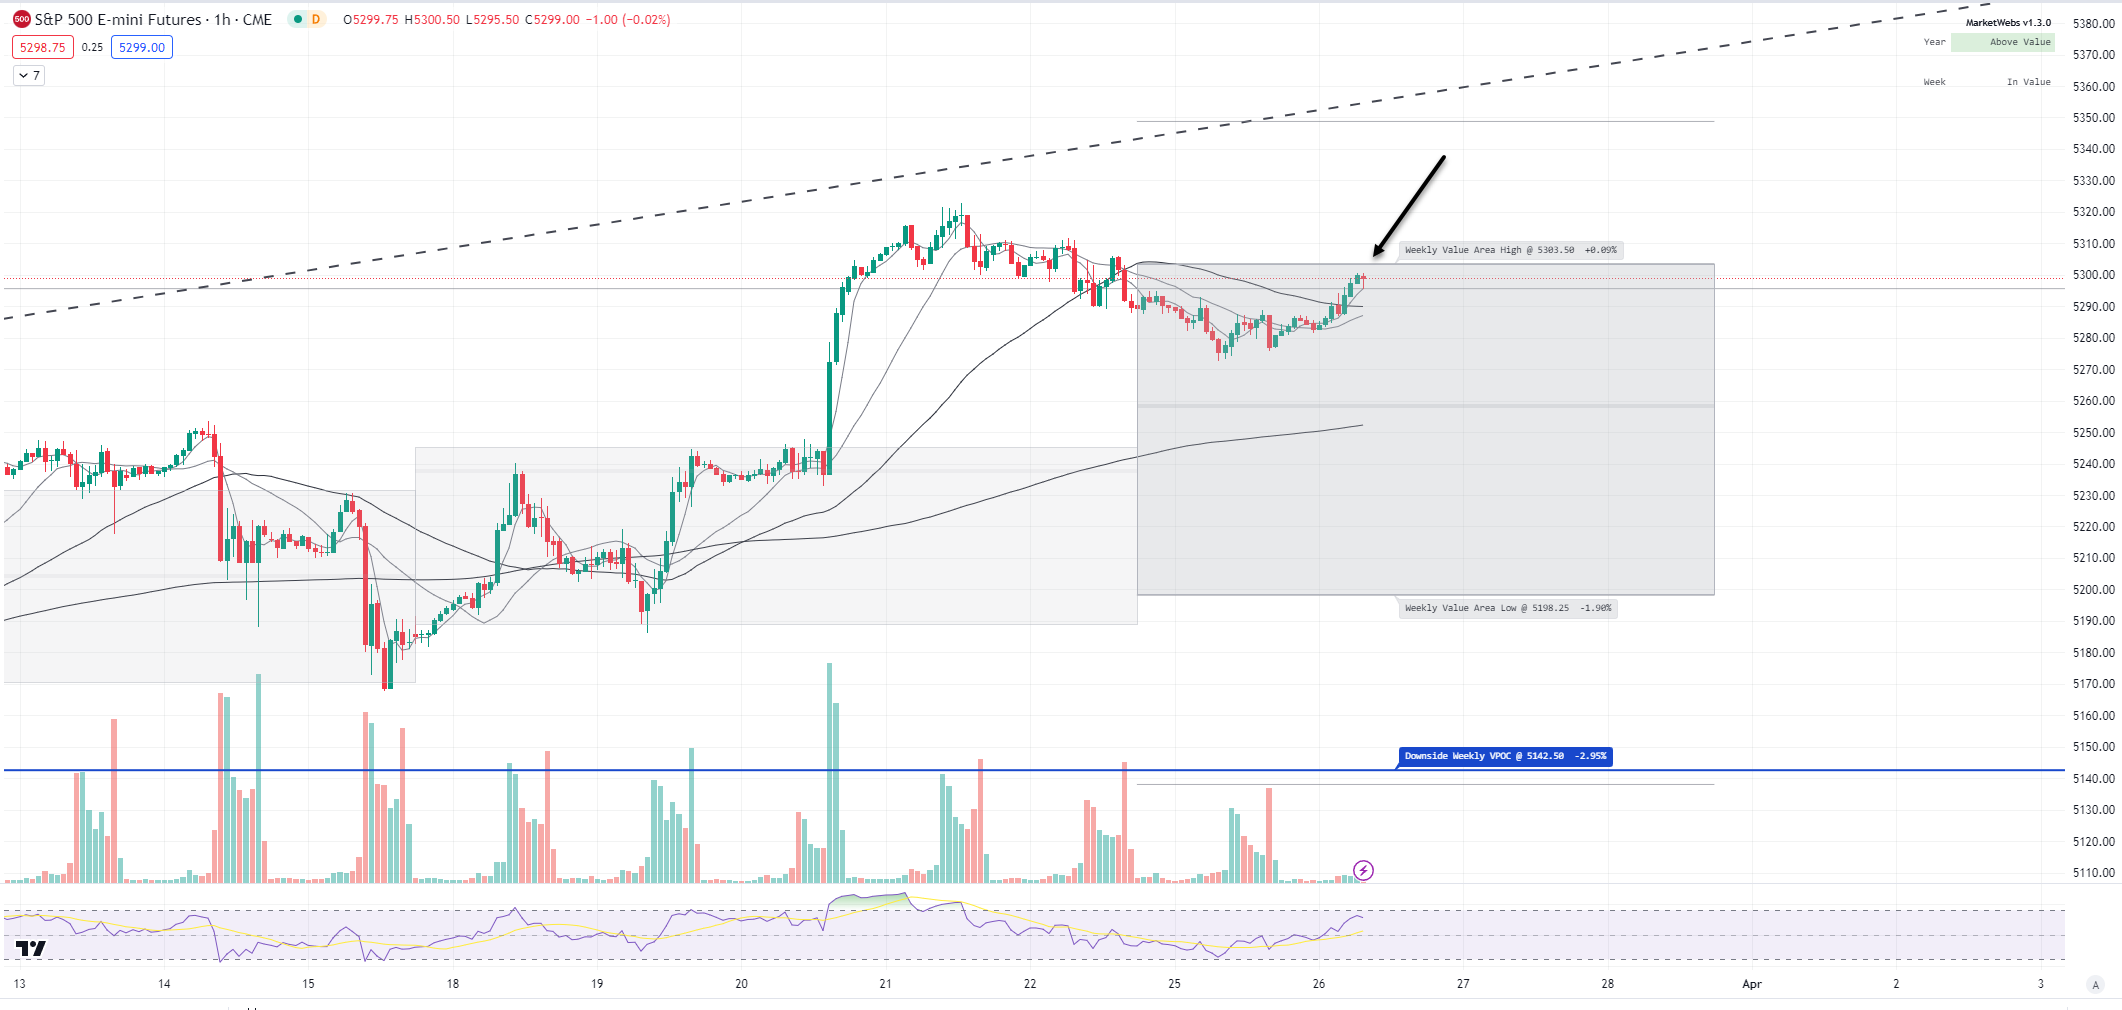
1hr chart: Price close to testing the top of Value Area for this week, watch 5303.5
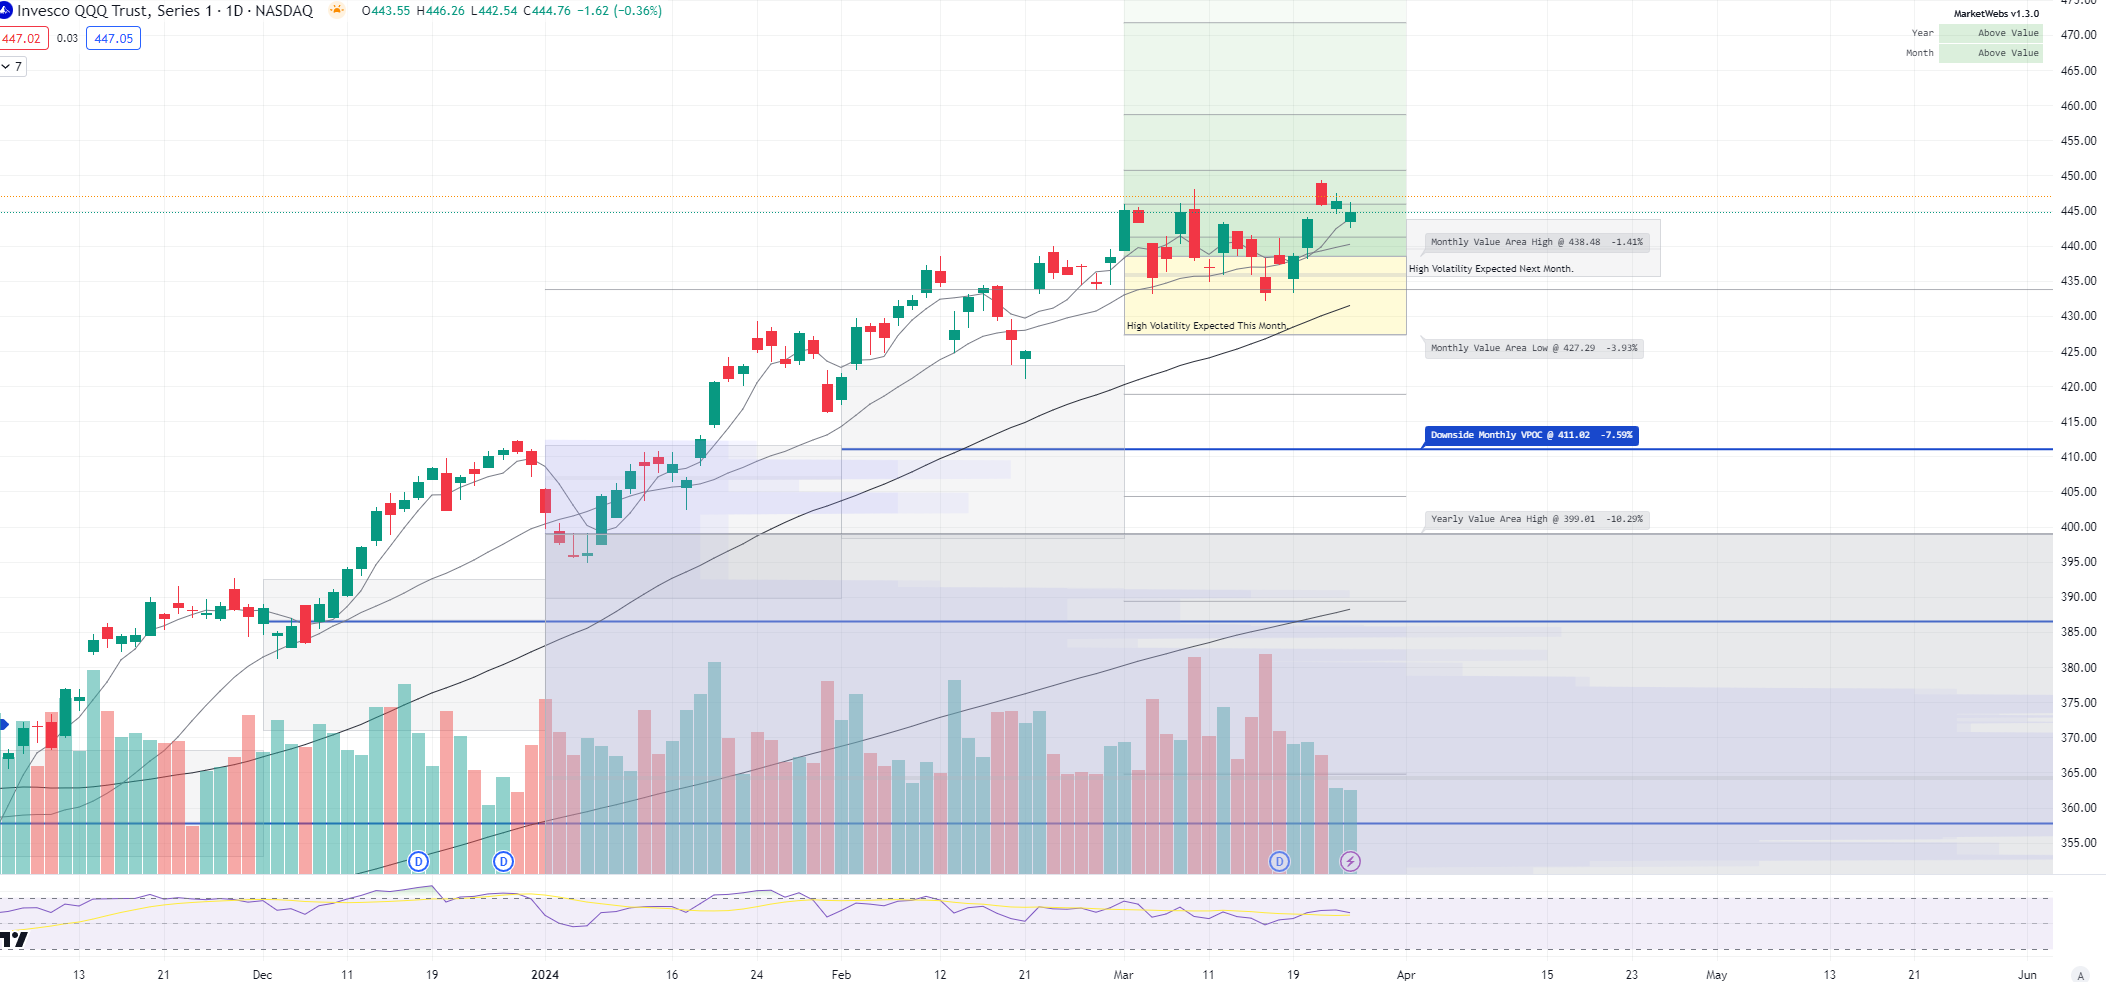
QQQ - NDX 100 ETF - Daily chart: Price ind. +0.5% and maintaining above the Mar Value Area and all short term MAs (Moving Averages)
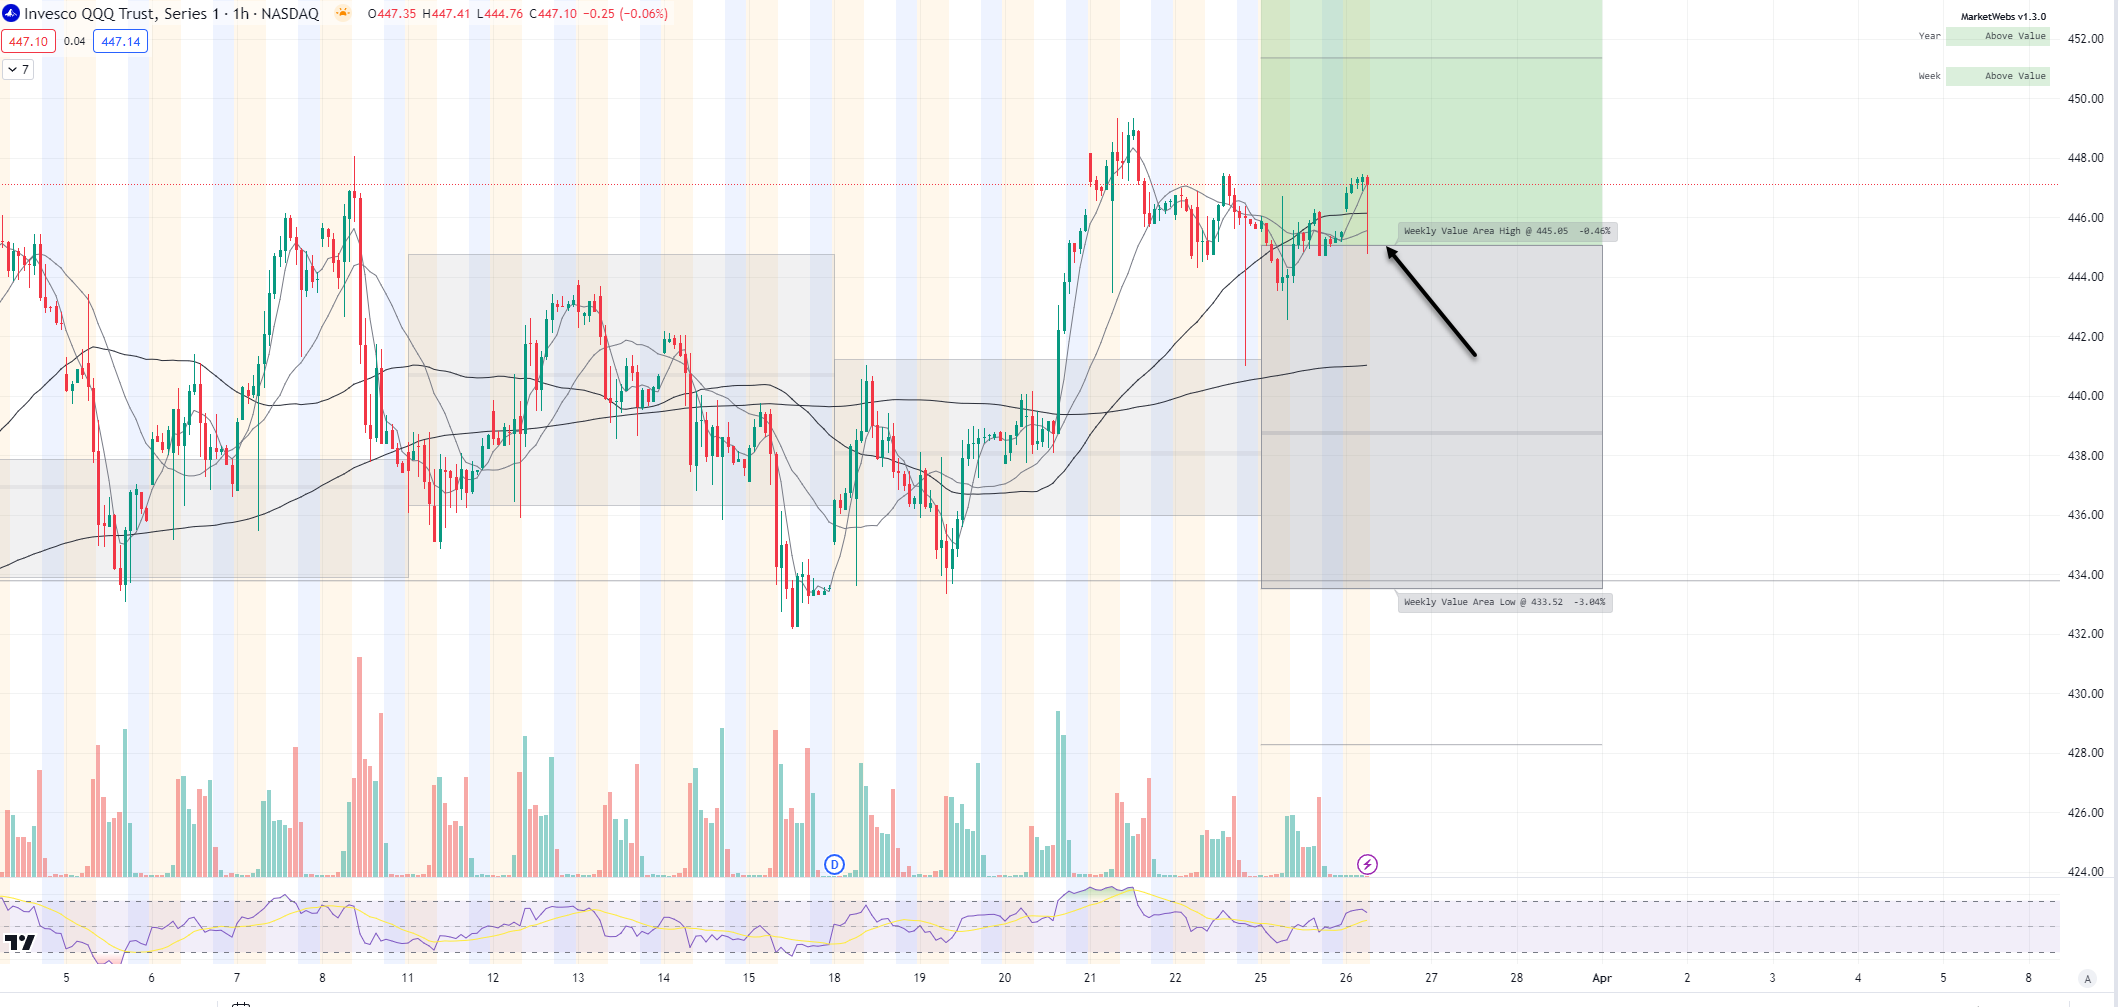
1hr chart: Price back above its Value Area for the week, watch $445.05 (sow support)
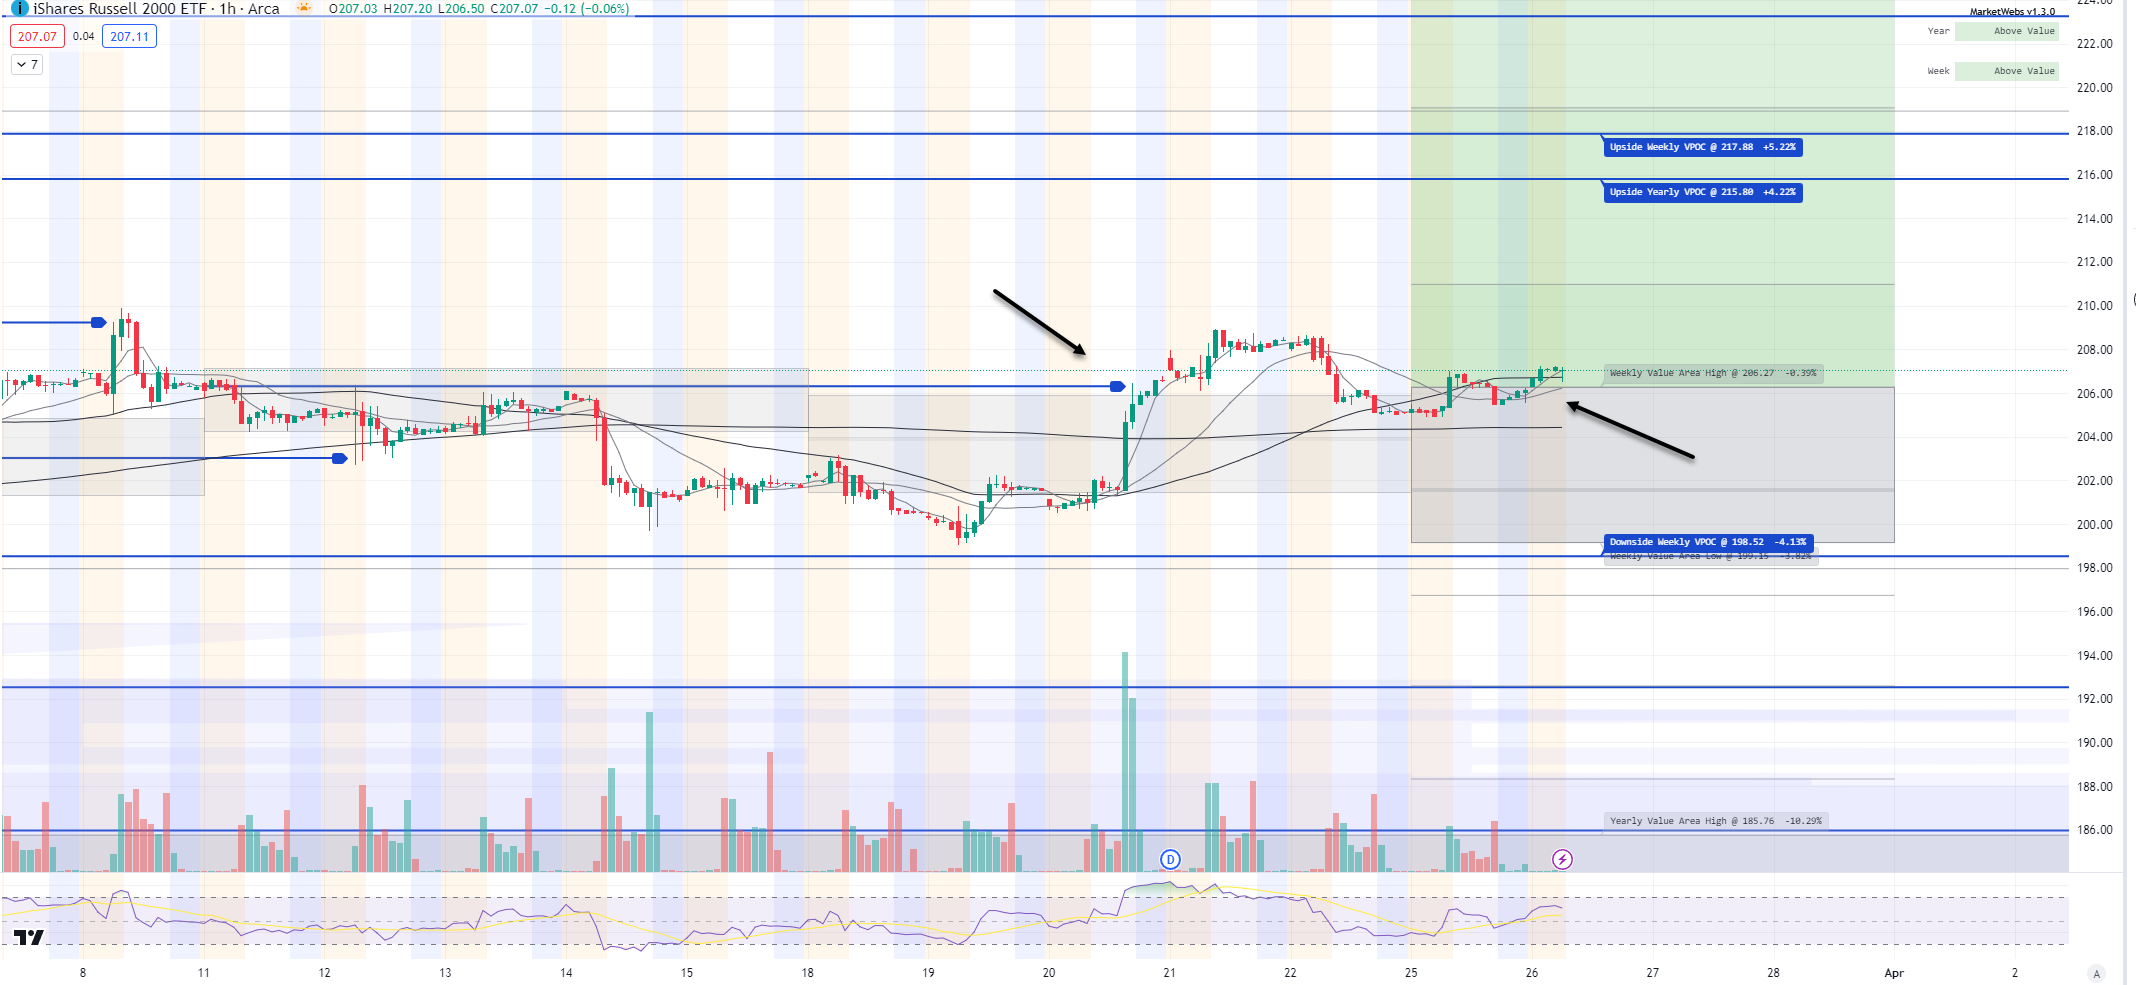
IWM - Russell Small Cap ETF- Price leading this morning, ind. +0.7% and is above all short term MAs

1hr chart: Price back above its Value Area for the week (watch $206.27), and back and forth since that VPOC (blue line) was taken out last week
Here is today’s TTG Proprietary Stock Screen “Out of the Box” using Volume At Price
names trending above their Value Areas (on 3 multiple timeframes & not super extended)
Keep reading with a 7-day free trial
Subscribe to The Tribeca Trade Group to keep reading this post and get 7 days of free access to the full post archives.