30yr Bonds +0.2% / Crude -1.7% & Nat Gas -1.9% / Gold -0.2% / Copper -0.2% / Cryptos are lower BTC -1.4%
US Upcoming Economics & Fed Speakers
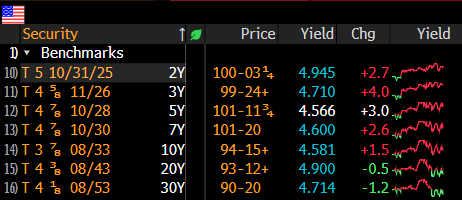
US Bond Yields
note 10yr Bond Auction at 1pm today
TTG End of Day Video
Click here for End of Day Video
Index Updates
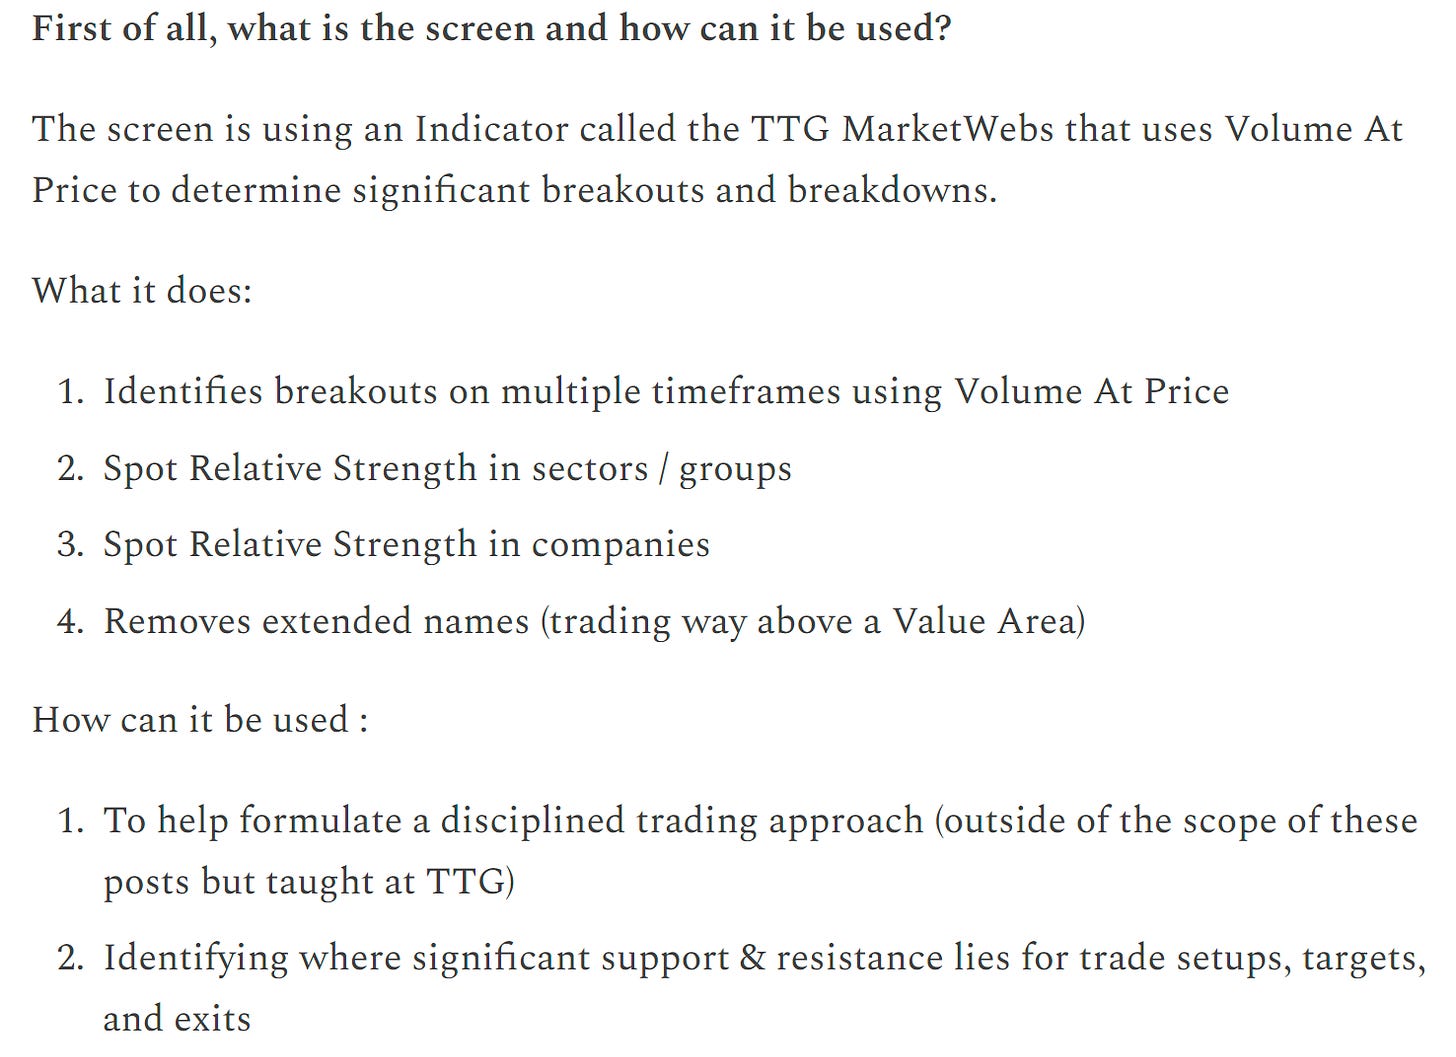
At TTG, I use Volume At Price in my chart analysis and I use the MarketWebs Indicator to provide Value Areas & VPOCs which indicate significant support & resistance levels. Learn More Here about Volume At Price and the MarketWebs.
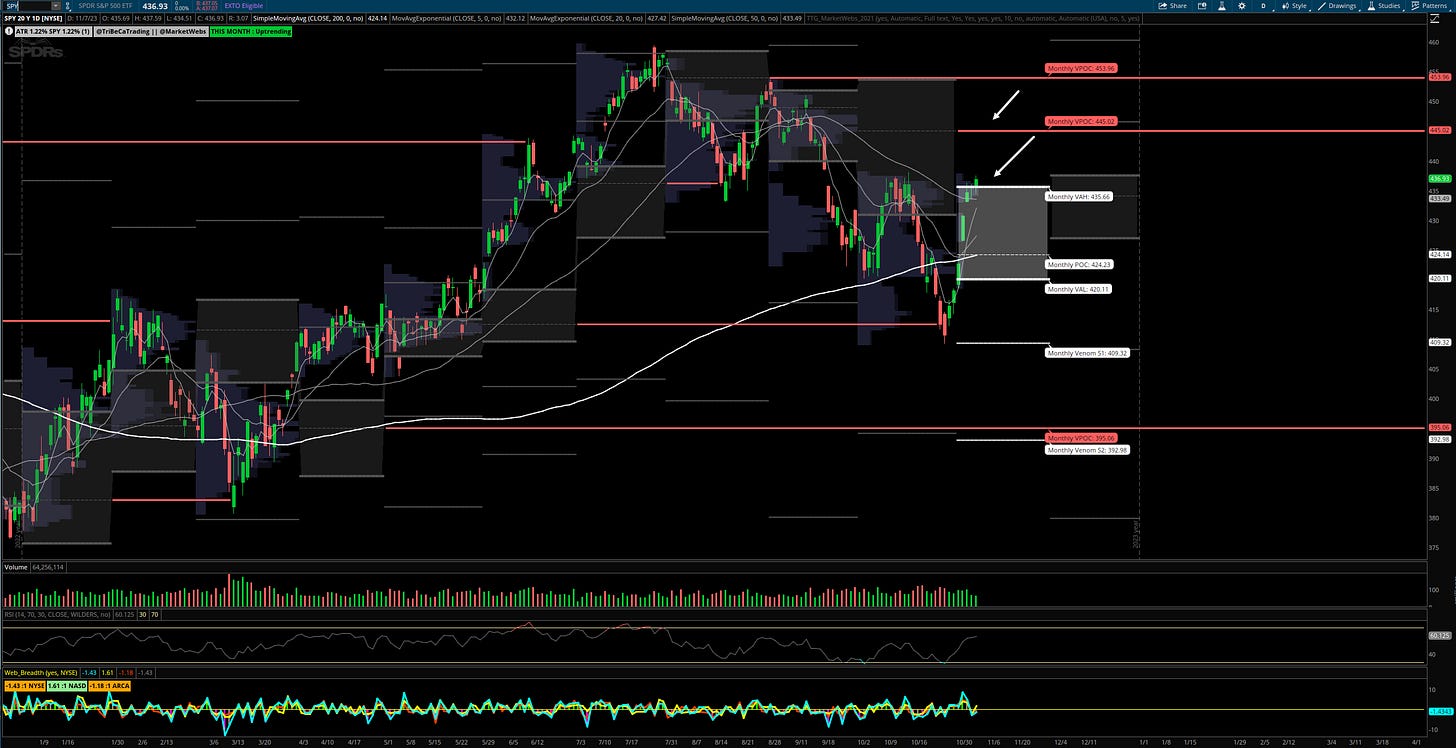
SPY - S&P ETF - Daily chart: Price closed just above the Nov Value Area for the first time this month, now $435.66 will be the support level to watch & upside VPOC (red line) to target $445
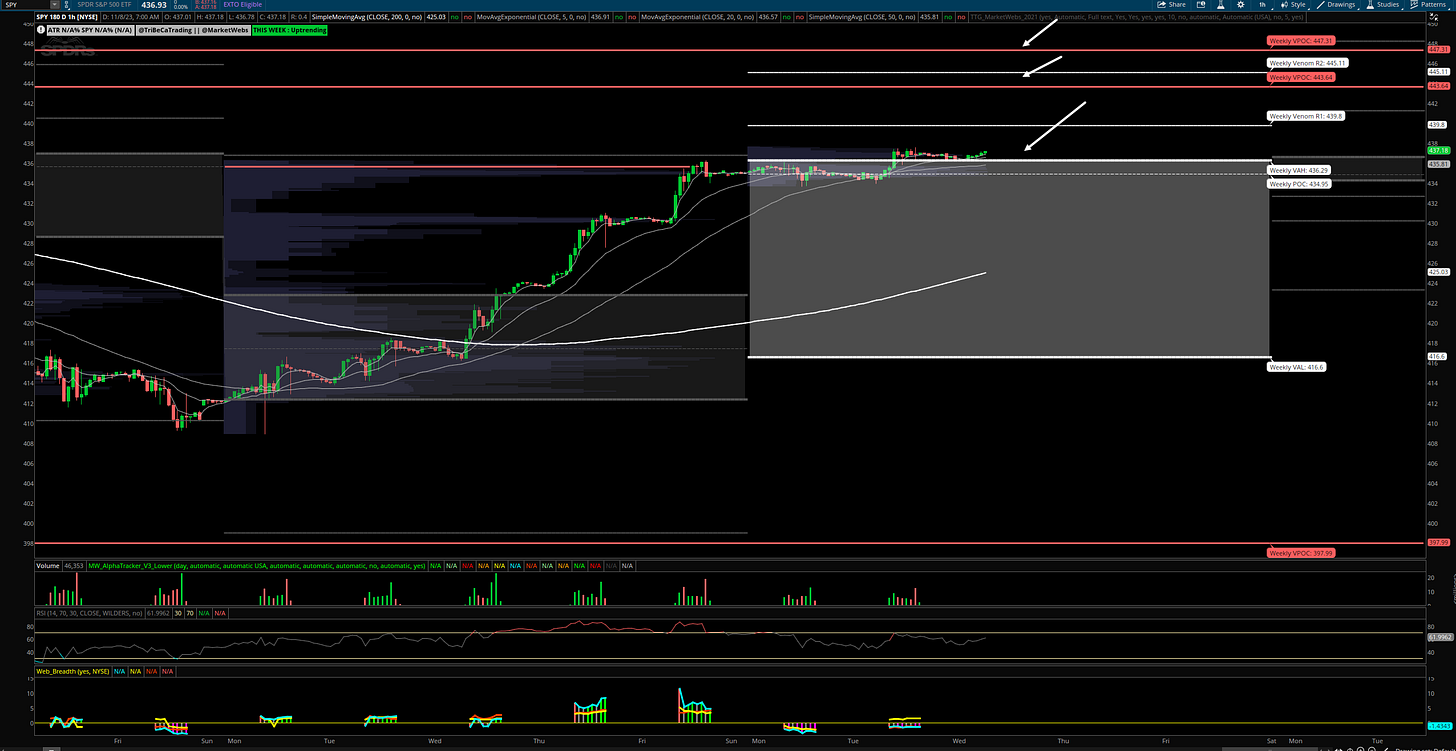
1hr chart: Price also made it above its Value Area for the week, support to watch $436.29
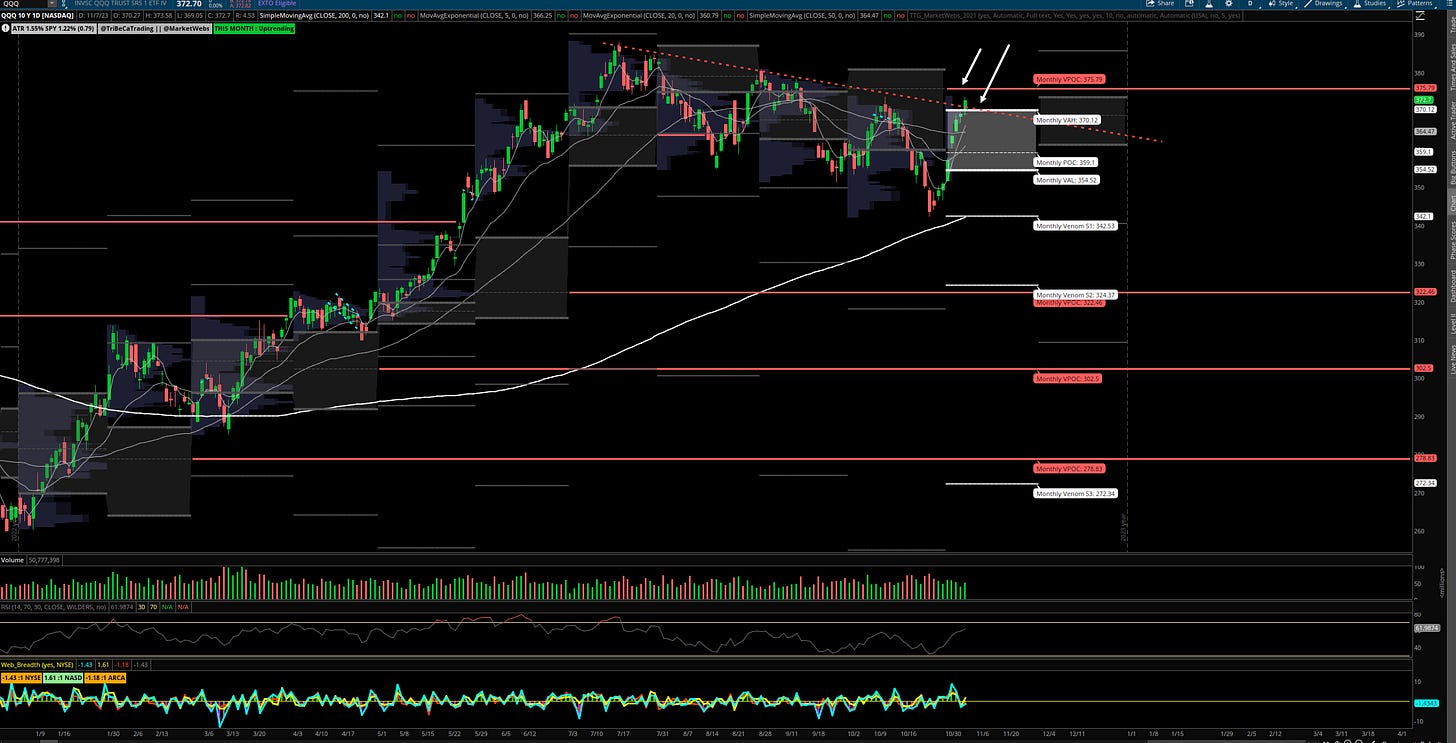
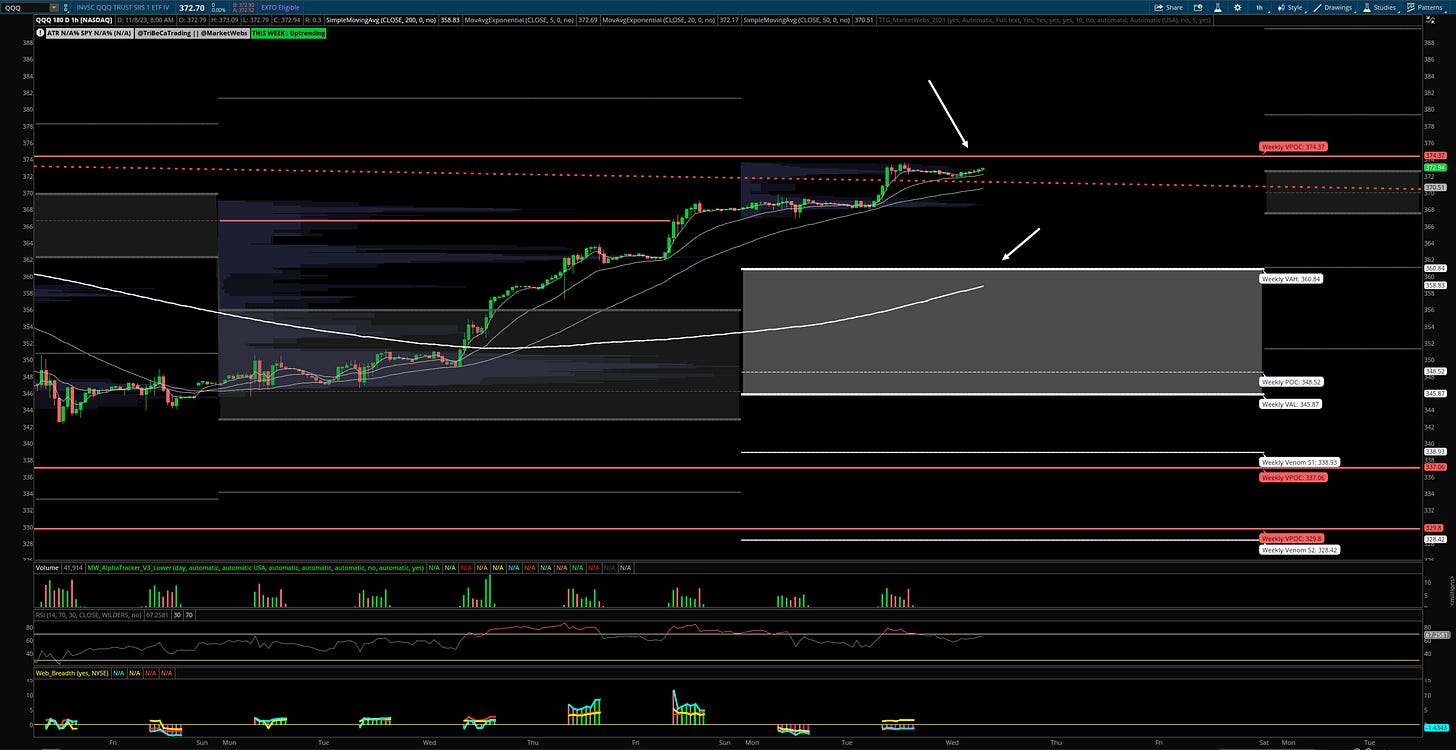
QQQ - NDX 100 ETF - Daily chart: Price rallied through the Nov Value Area & next upside level to watch is $375.79 , support now $370.12 top of Value
1hr chart: Price trending above its Value Area for the week, upside VPOC to watch $374.37 - again, VPOCs can represent overhead supply
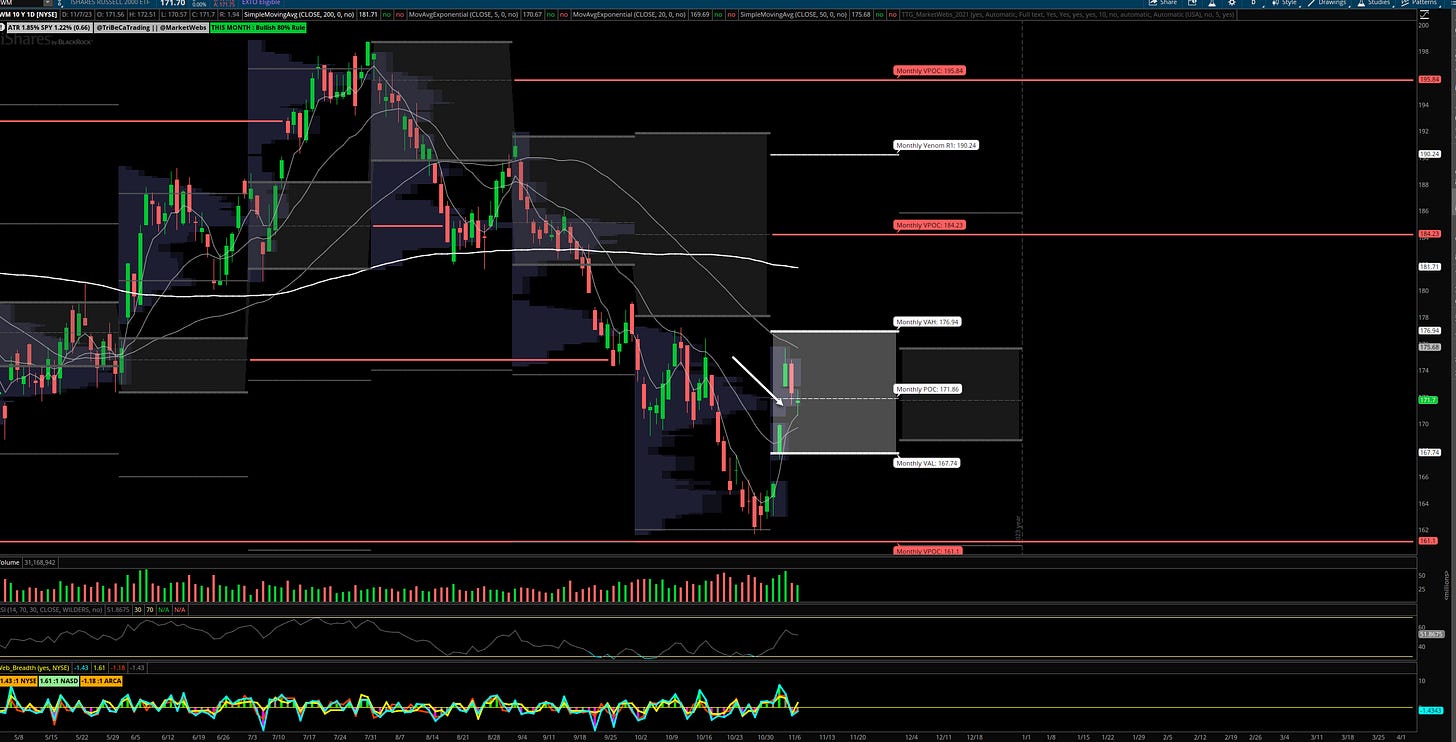
IWM- Russell Small Cap ETF- Daily Chart: Price lagged yesterday, IWM -1.25% and is underperforming again this morning, ind -0.3% and may watch to fill that gap from last week. Resistance remains $176.94 top of value.
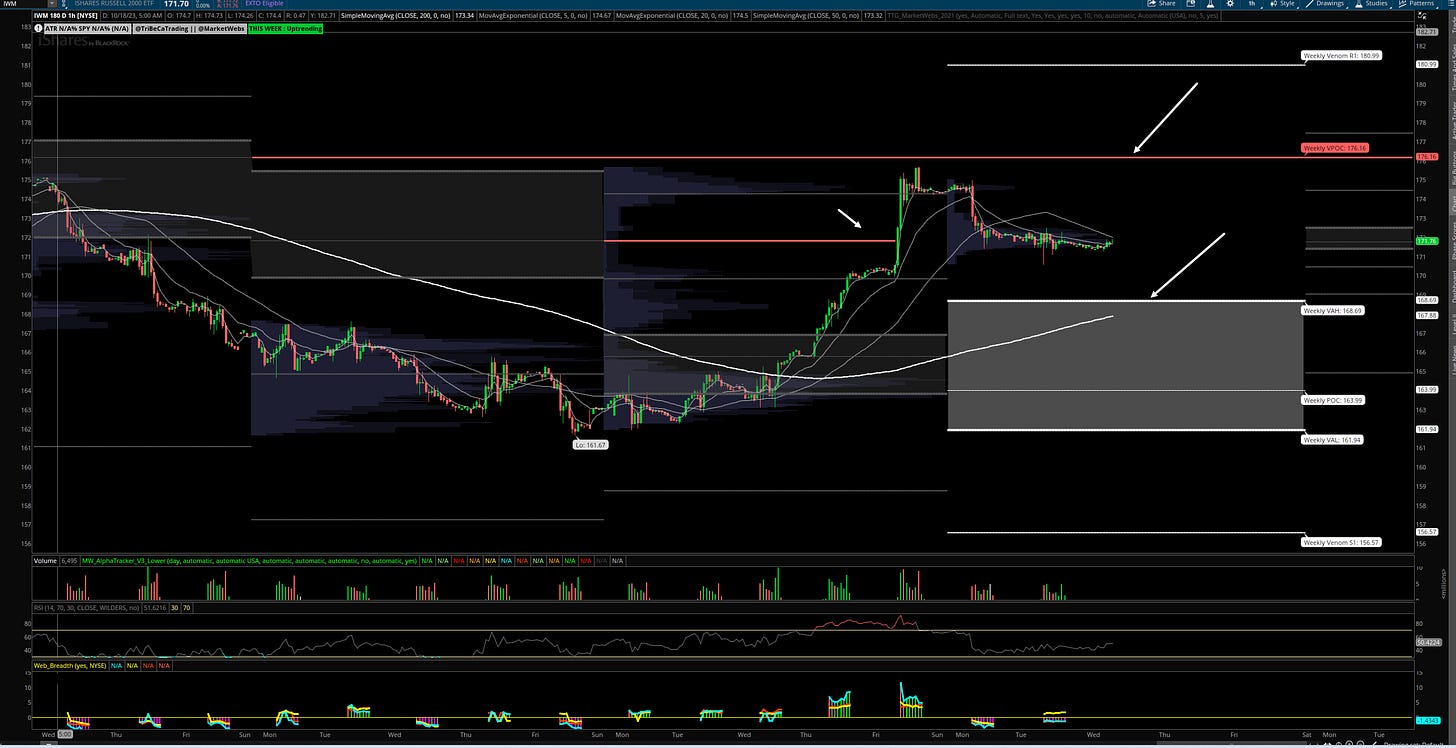
1hr chart: Price remains above its Value Area for the week, and support down at $168.69 and is centered around that last VPOC take out at $171.8 & upside VPOC to watch / target is $176.16
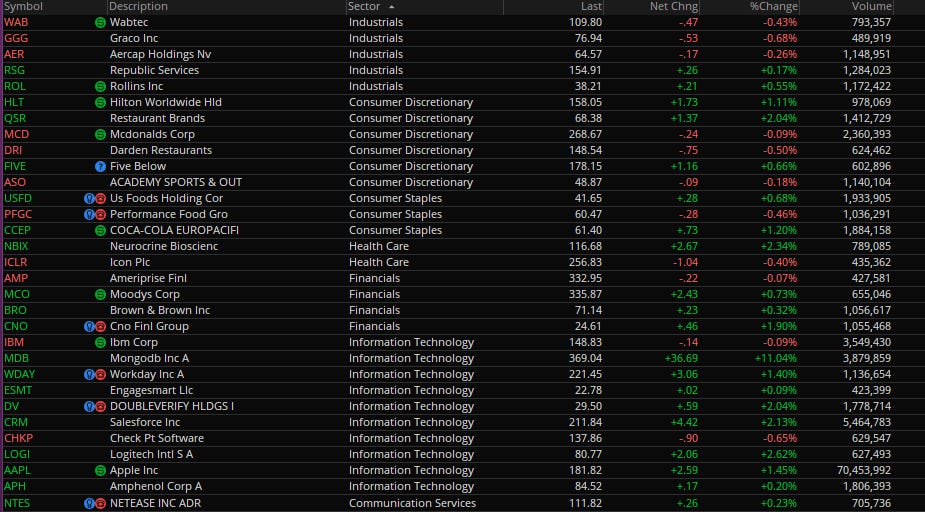
Here is today’s TTG Proprietary Stock Screen “Out of the Box” using Volume At Price
names trending above their Value Areas (on 3 multiple timeframes & not super extended)
Charts
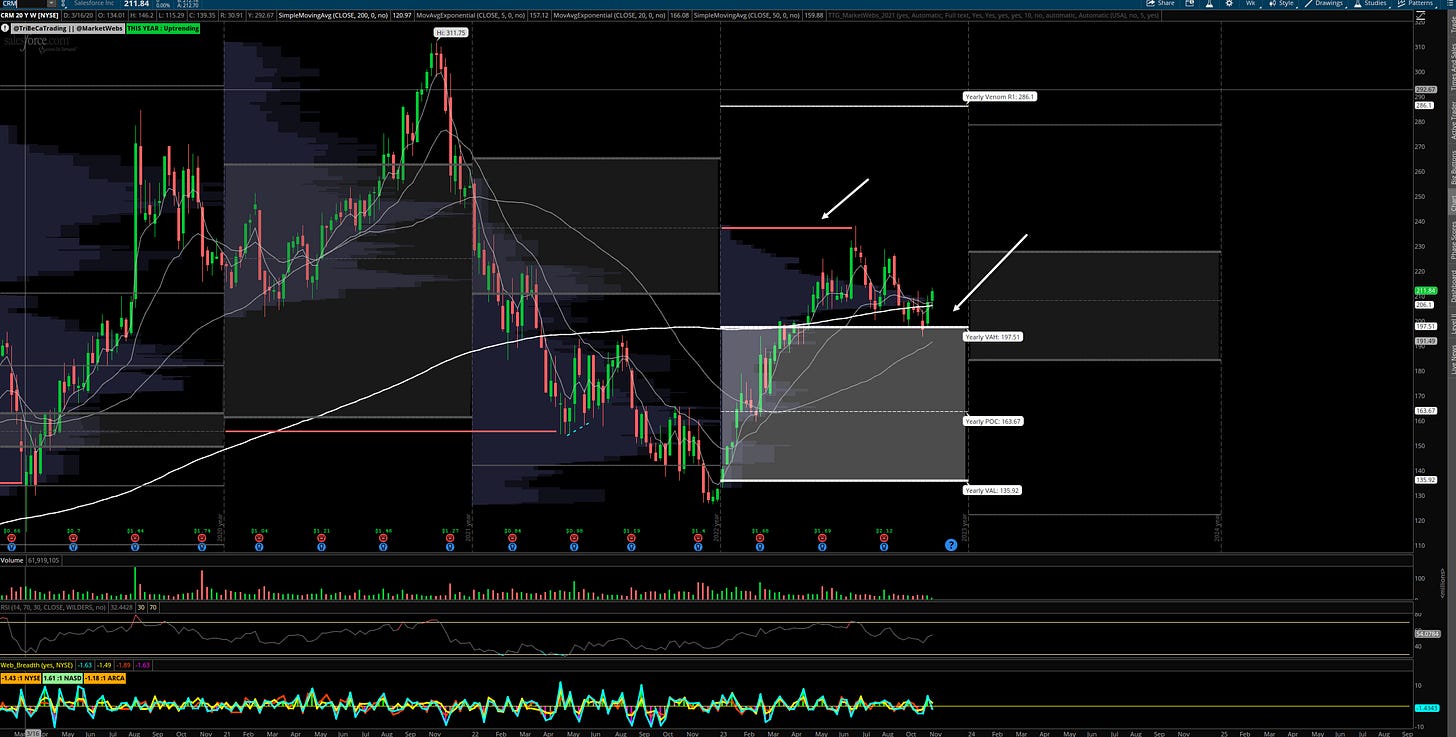
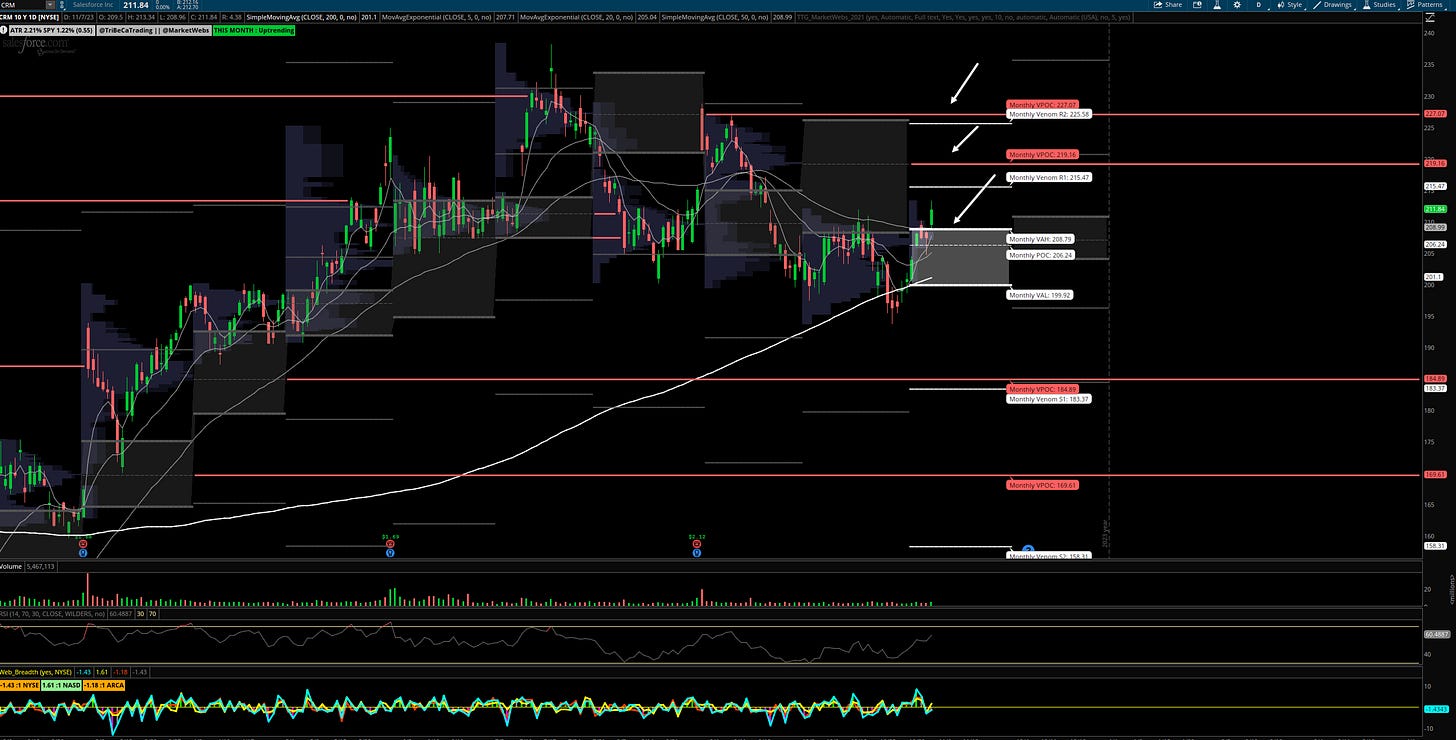
CRM Weekly & Daily chart
Salesforce, Inc. operates as a cloud-based software company. The Company develops customer relationship management software and applications focused on sales, customer service, marketing automation, analytics, and application development. Salesforce serves customers worldwide (Bloomberg)
-suggested stop price $208 using the TTG MarketWebs & upside price target $219 & $227 VPOC (red line). Note on the Weekly chart price was capped by that VPOC take out at $237 which perfectly defined the highs for this year.
Sign up here to get access to 50% off your first month of the The Tribeca Trade Group, coupon code TTGNEW
Copyright © Tribeca Trade Group. All of the information in this newsletter is for entertainment and educational purposes only and is not to be construed as investment or trading advice. None of the information in this newsletter is guaranteed to be accurate, complete, useful or timely. IMPORTANT NOTICES AND DISCLAIMERS TriBeCa Trade Group is not an investment advisor and is not registered with the U.S. Securities and Exchange Commission or the Financial Industry Regulatory Authority. Further, owners, employees, agents or representatives of TriBeCa Trade Group are not acting as investment advisors and might not be registered with the U.S. Securities Authority


