US Dollar -0.3% / 30yr Bonds -0.4% / Crude +1.1% & Nat Gas -1.2% / Gold +0.2% / Copper+0.9% / Cryptos are lower BTC -1.0%
US Upcoming Economics
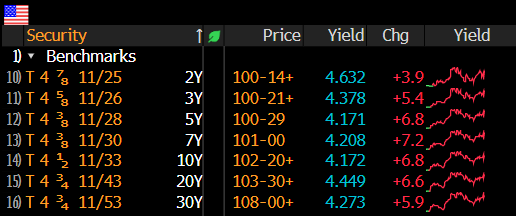
US Bond Yields
TTG End of Day Video
Click here for End of Day Video
Index Updates
At TTG, I use Volume At Price in my chart analysis and I use the MarketWebs Indicator to provide Value Areas & VPOCs which indicate significant support & resistance levels. Learn More Here about Volume At Price and the MarketWebs.
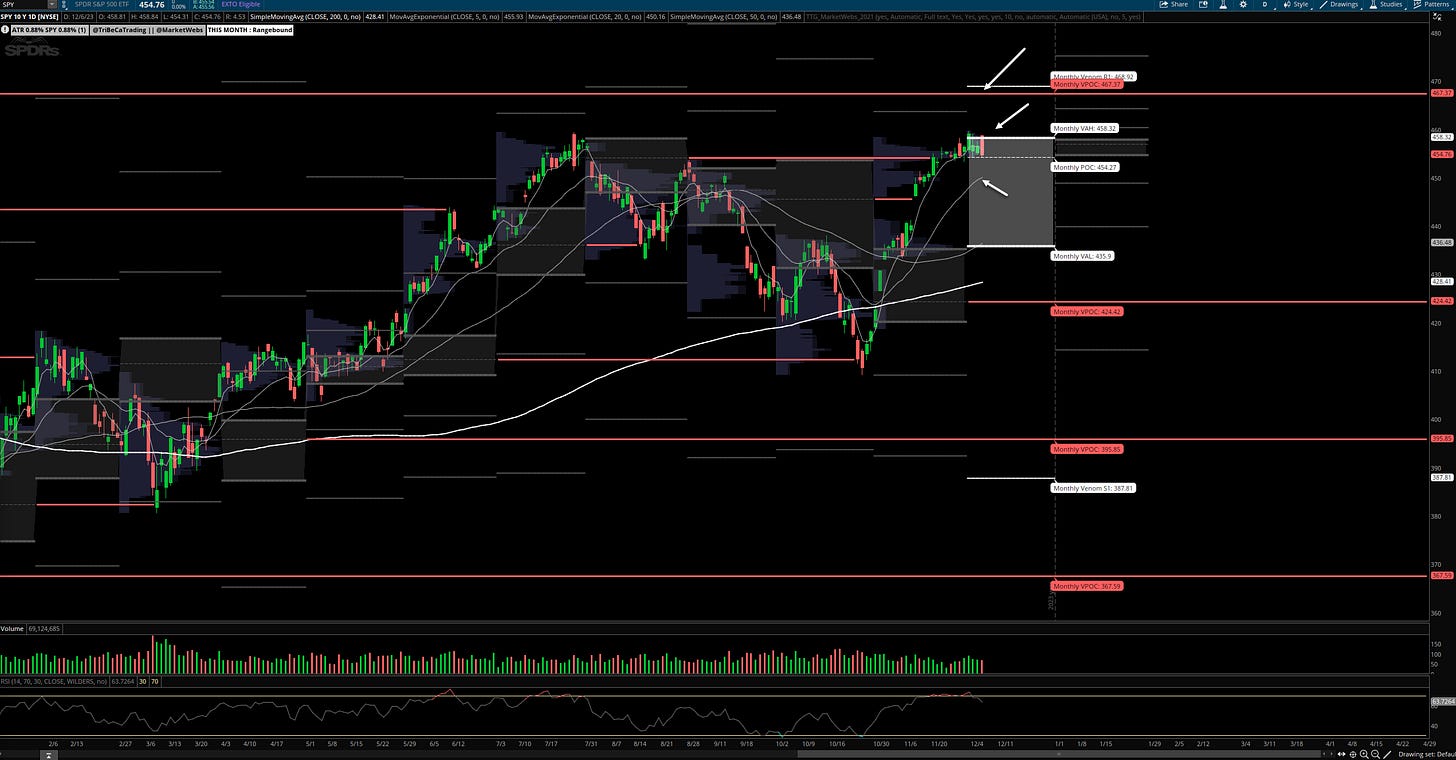
SPY- S&P ETF - Daily chart: After yesterday's reversal, price remains inside its Dec Value Area, resistance to watch is still $458.32. And note if we see further weakness, I am watching the 20d MA for some support. I still believe the market is waiting on the Friday’s jobs report to break the range.
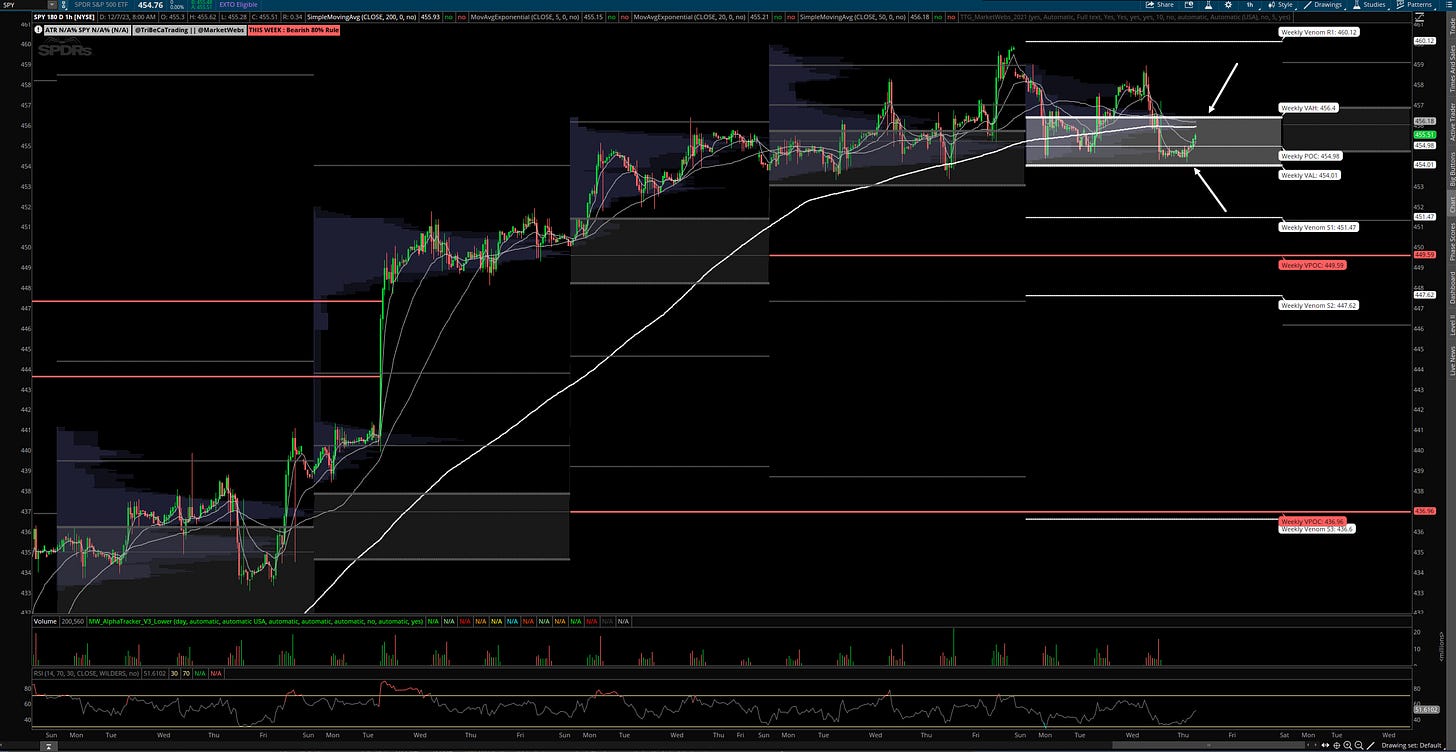
1hr chart: Price was rejected from breaking higher and is back inside this week's Value Area, see chart below for levels to watch
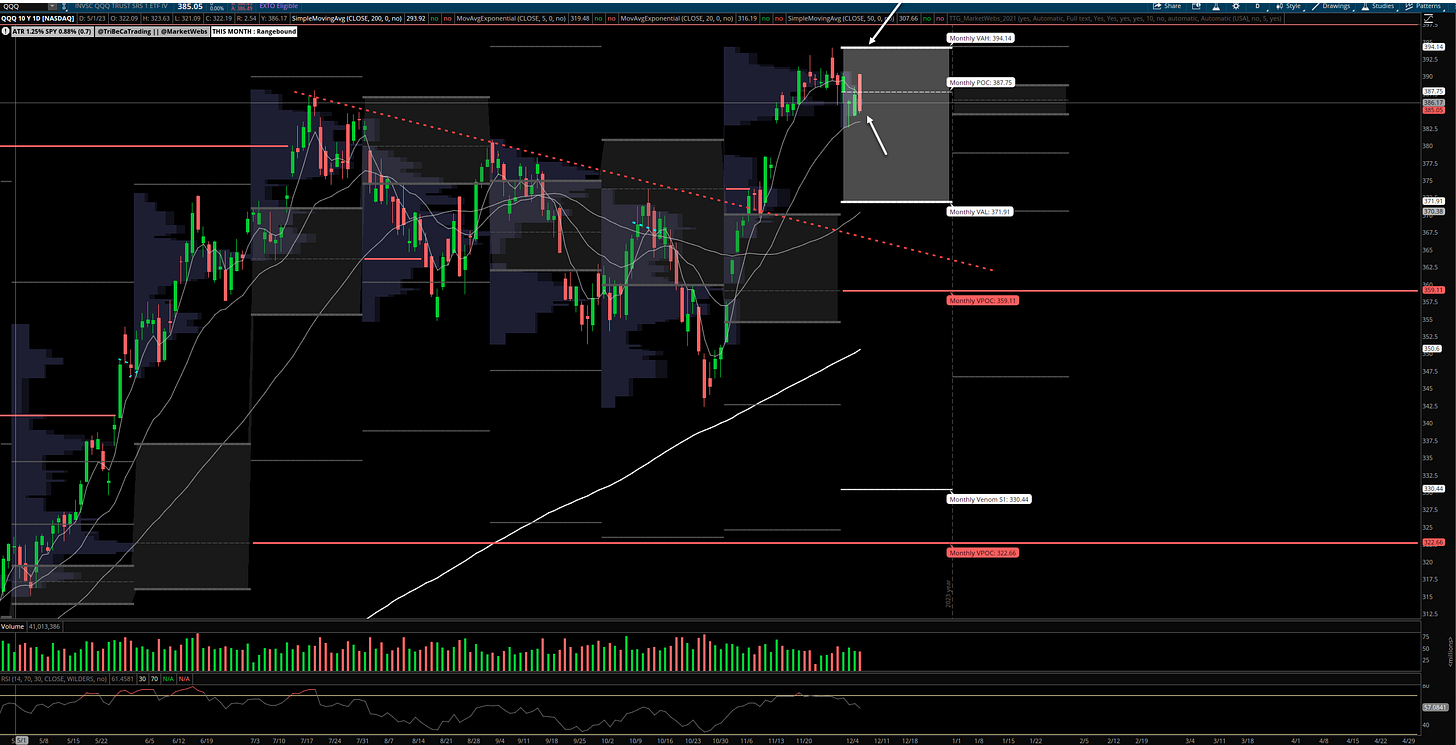
QQQ - NDX 100 ETF - Daily chart: Price remains inside its Dec Value Area, tested its 20d MA and is holding. Now, let's see if price can reclaim its 5d MA - that would be a good sign for the QQQs
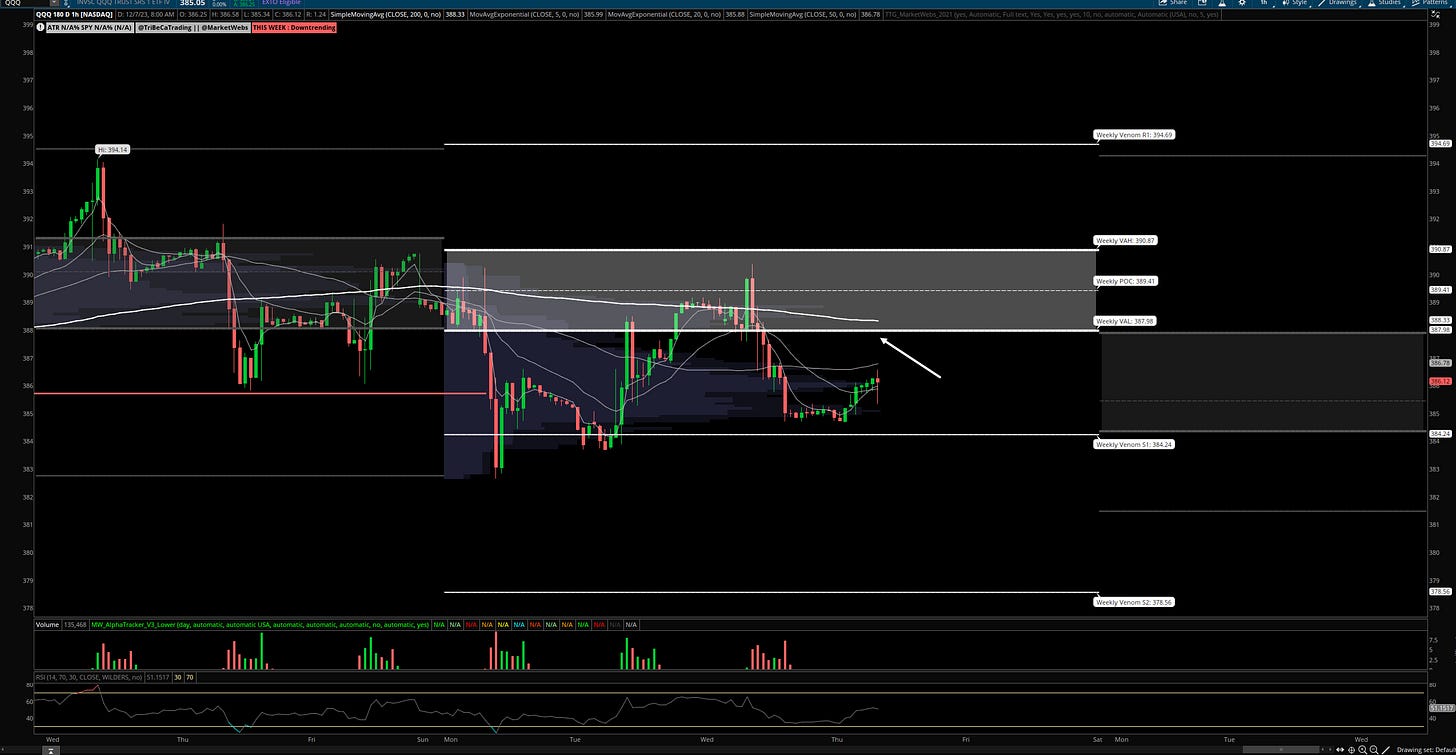
1hr chart: Price is back below its Value Area for the the week, resistance remains $387.98. One observation from yesterday is that price did not break the lows of the week which is a small positive.
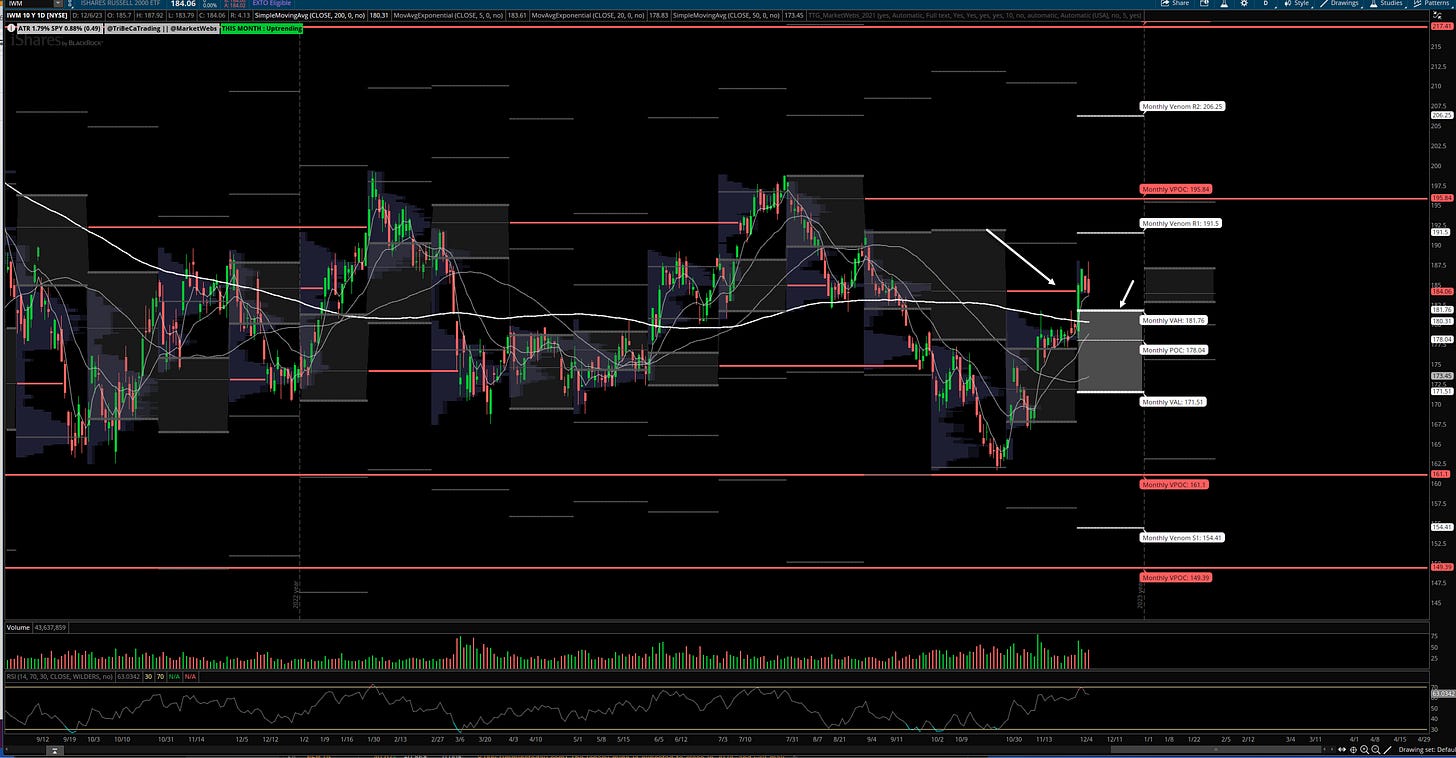
IWM- Russell Small Cap ETF- Daily Chart: Price continuing to hang around that last VPOC (red line) take out and also remains above its Dec Value Area, support $181.76
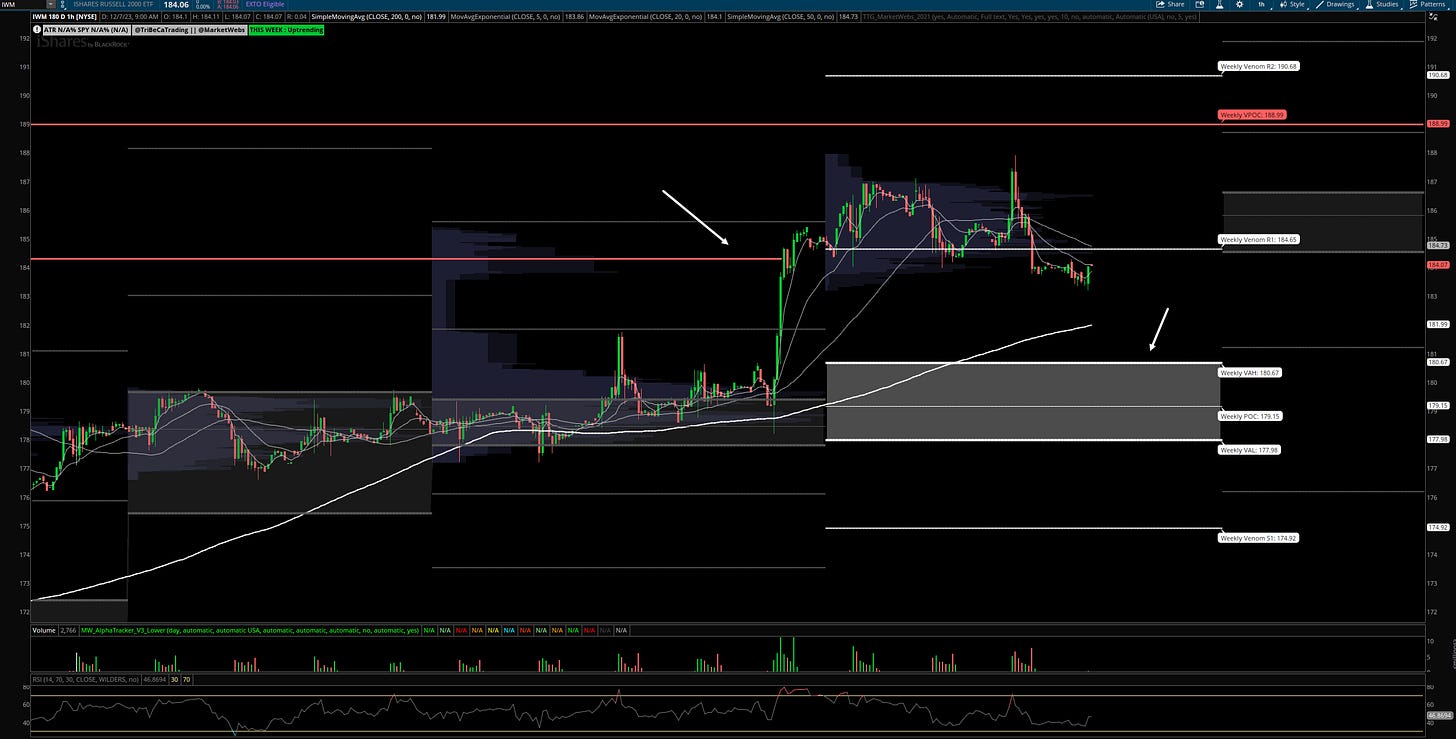
1hr chart: Price still above its Value Area for the week, but is close to the low point for the week
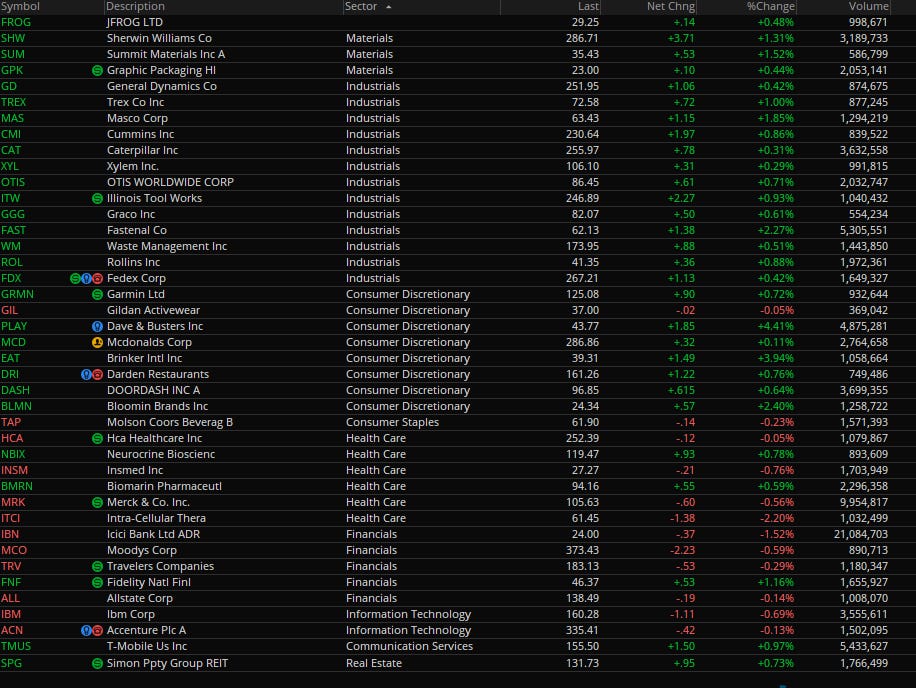
Here is today’s TTG Proprietary Stock Screen “Out of the Box” using Volume At Price
names trending above their Value Areas (on 3 multiple timeframes & not super extended)
Charts
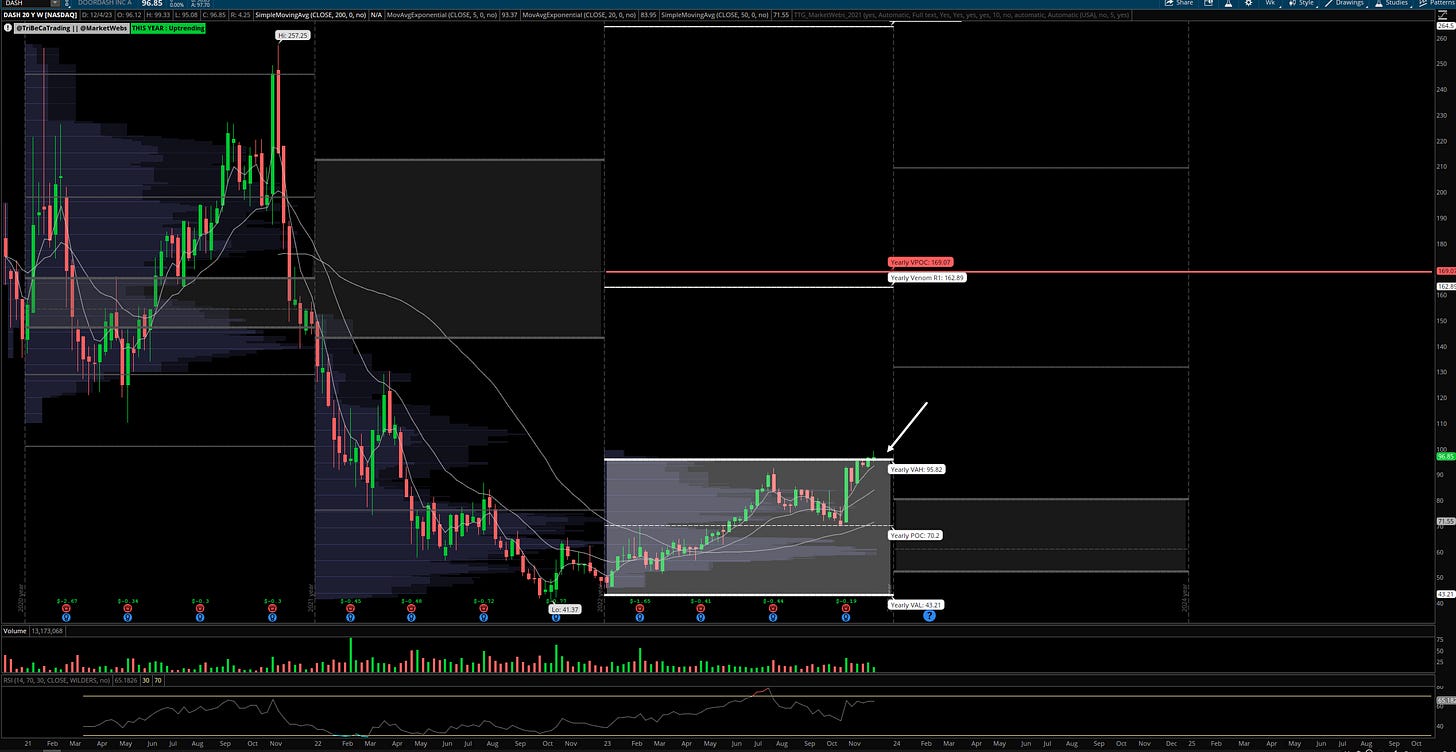
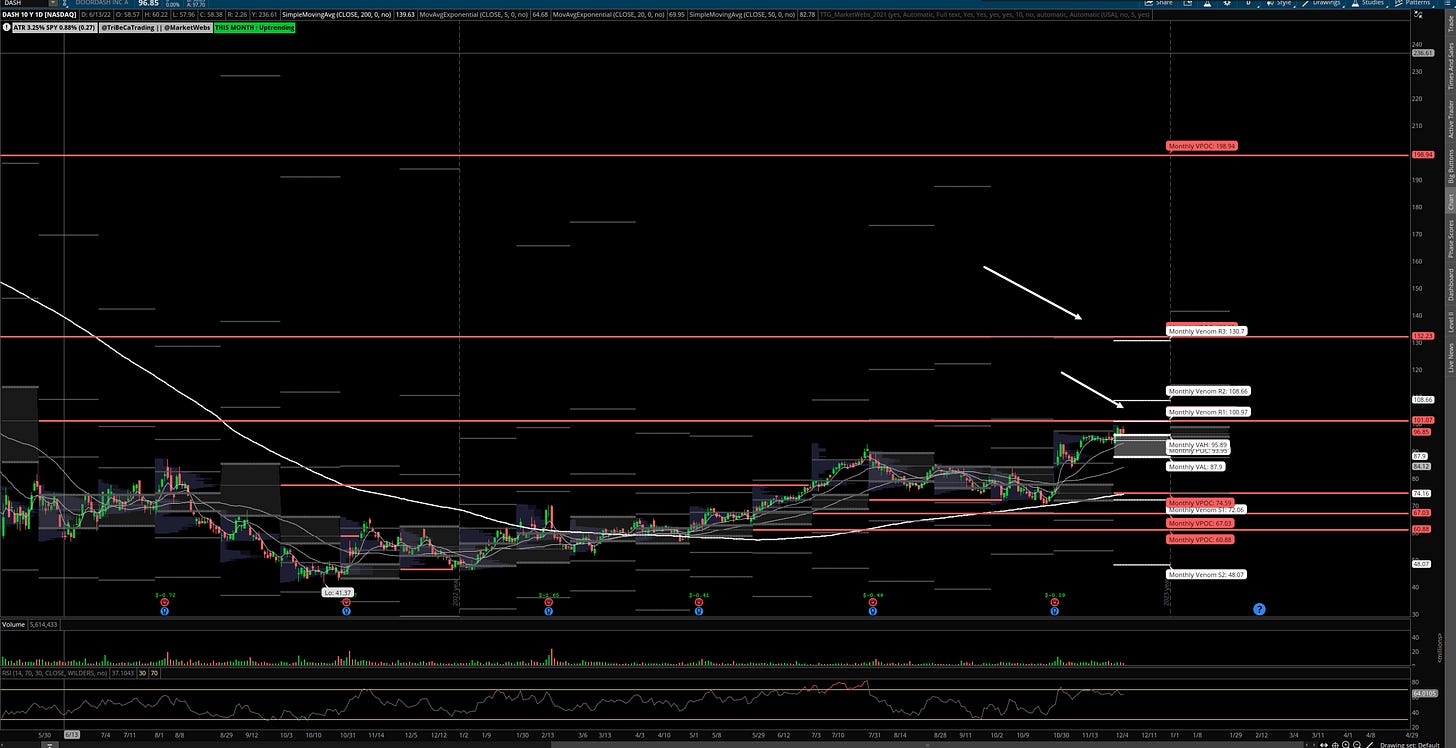
DASH Weekly & Daily chart
DoorDash, Inc. provides restaurant food delivery services. The Company develops technology to connect customers with merchants through an on-demand food delivery application. DoorDash serves customers in the United States.(Bloomberg)
- suggested stop price using the TTG MarketWebs $95
- What I like about this setup is I know exactly where this trade will work vs doesn’t.. as long as price stays above that yearly value Area, $95.82 can be long
Copyright © Tribeca Trade Group. All of the information in this newsletter is for entertainment and educational purposes only and is not to be construed as investment or trading advice. None of the information in this newsletter is guaranteed to be accurate, complete, useful or timely. IMPORTANT NOTICES AND DISCLAIMERS TriBeCa Trade Group is not an investment advisor and is not registered with the U.S. Securities and Exchange Commission or the Financial Industry Regulatory Authority. Further, owners, employees, agents or representatives of TriBeCa Trade Group are not acting as investment advisors and might not be registered with the U.S. Securities Authority


