

TTG Index Charts & Out of the Box Stock Screen 01/08/24 $NTRA
TTG Index Charts & Out of the Box Stock Screen 01/08/24 $NTRA
Out of the Box MarketWebs Screen
US Dollar flat / 30yr Bonds -0.2% / Crude -3.5% & Nat Gas -3.9% / Gold -1.1% / Copper -0.1% / BTC +2.6%
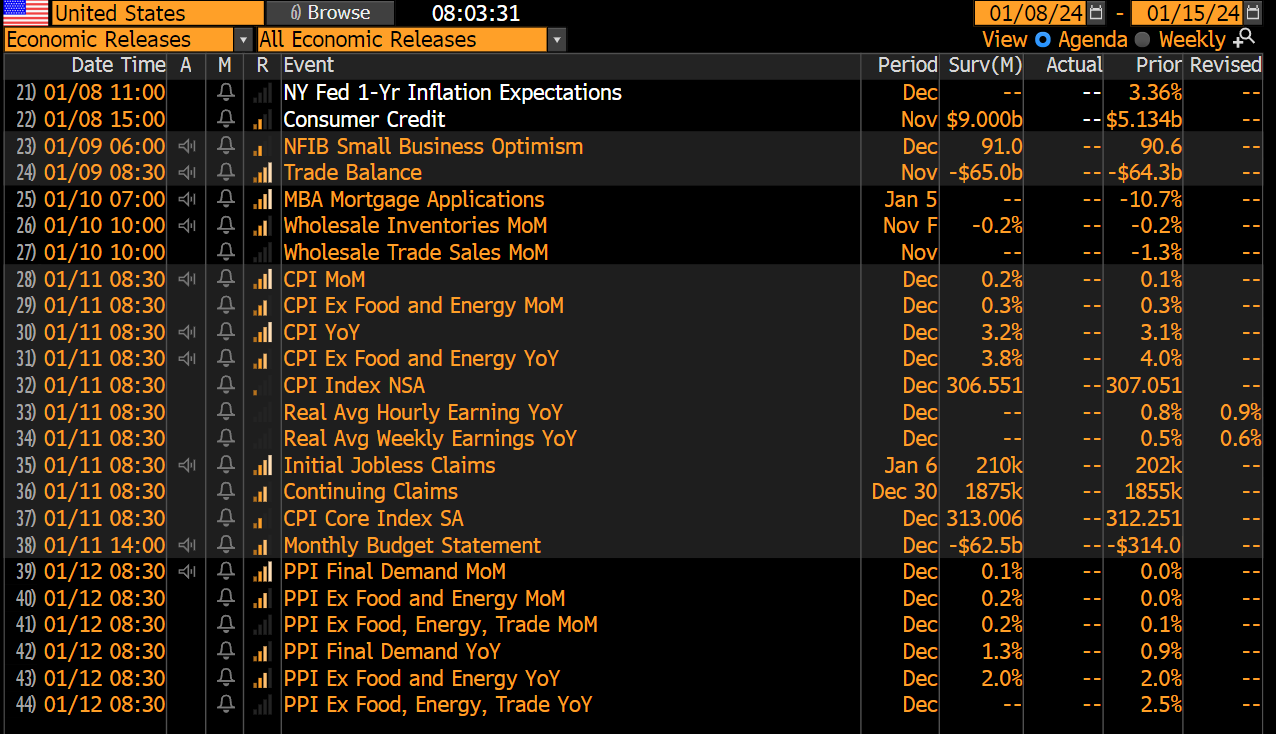
US Upcoming Economics
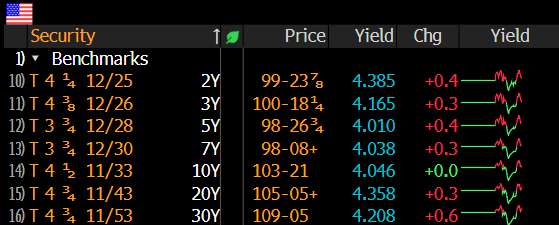
US Bond Yields
Index Updates
At TTG, I use Volume At Price in my chart analysis and I use the MarketWebs Indicator to provide Value Areas & VPOCs which indicate significant support & resistance levels. Learn More Here about Volume At Price and the MarketWebs.
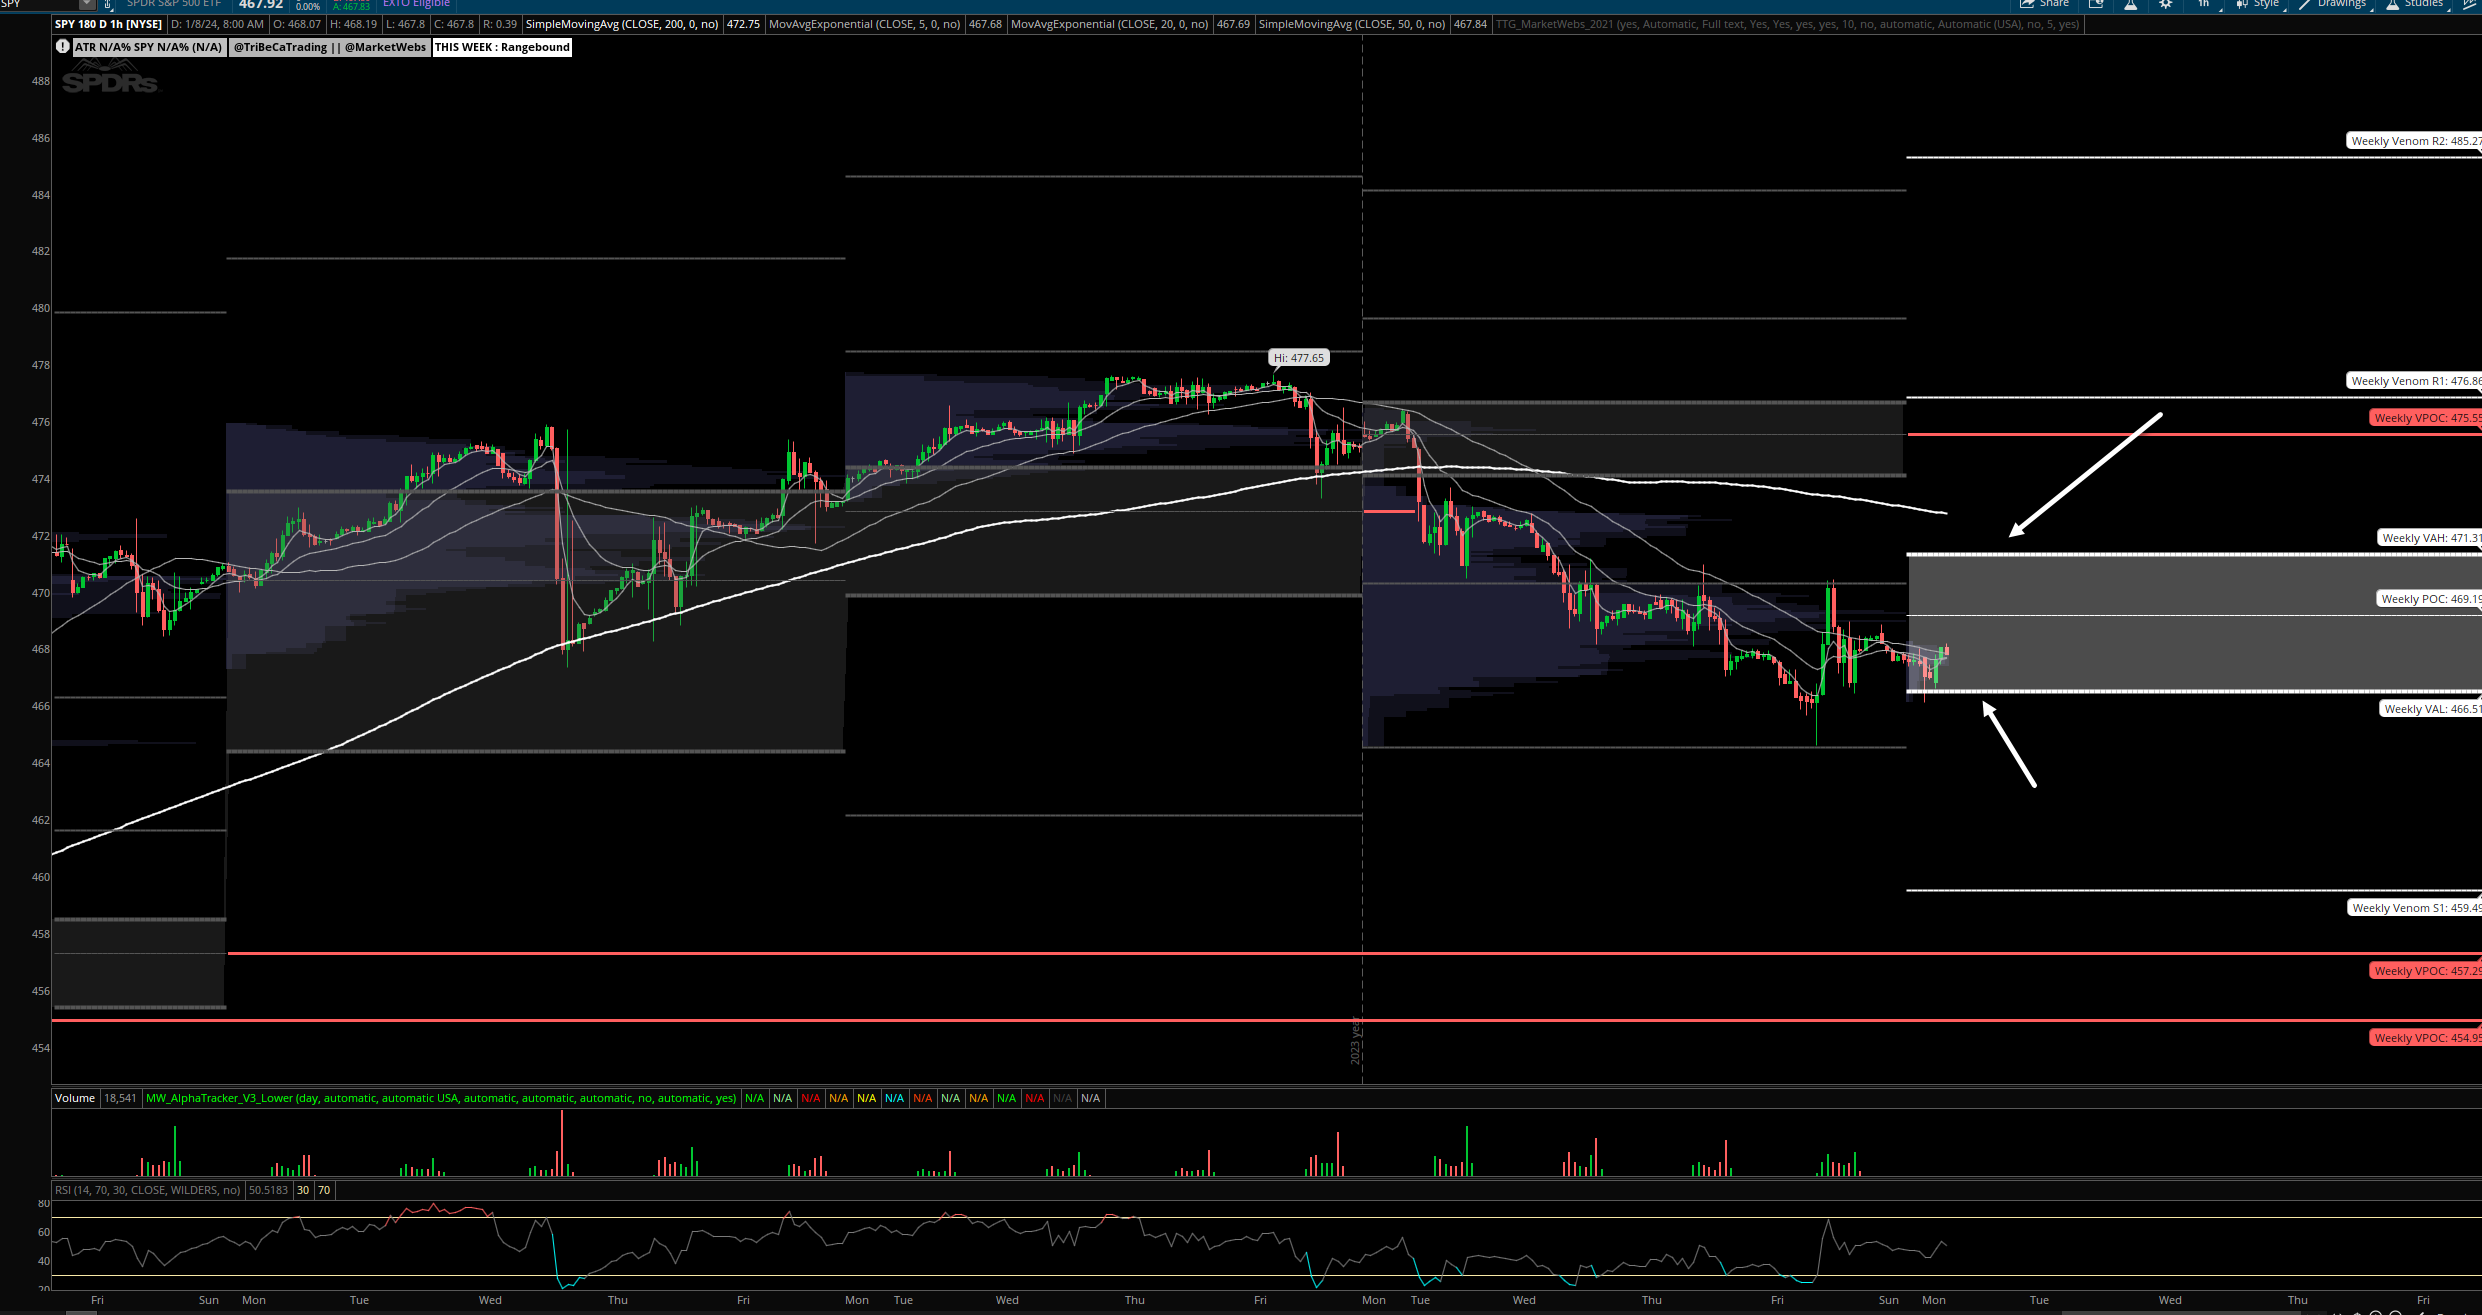
SPY- S&P ETF - Price ~ flat this morning as we start the 2nd week of '24. The macro main event this week will be CPI /PPI data which starts on Thurs. Note, Bank earnings start on Friday with JPM, BAC, etc. & JPM has their Health Care conf this week.
Back to the price action - I am waiting to see if price can regain its short term MAs (Moving Averages)
1hr chart: Price starts the week inside its new Value Area and I think it will be important (in the short term) for price to hold support $466.51. Note, top of value resistance is $471.31
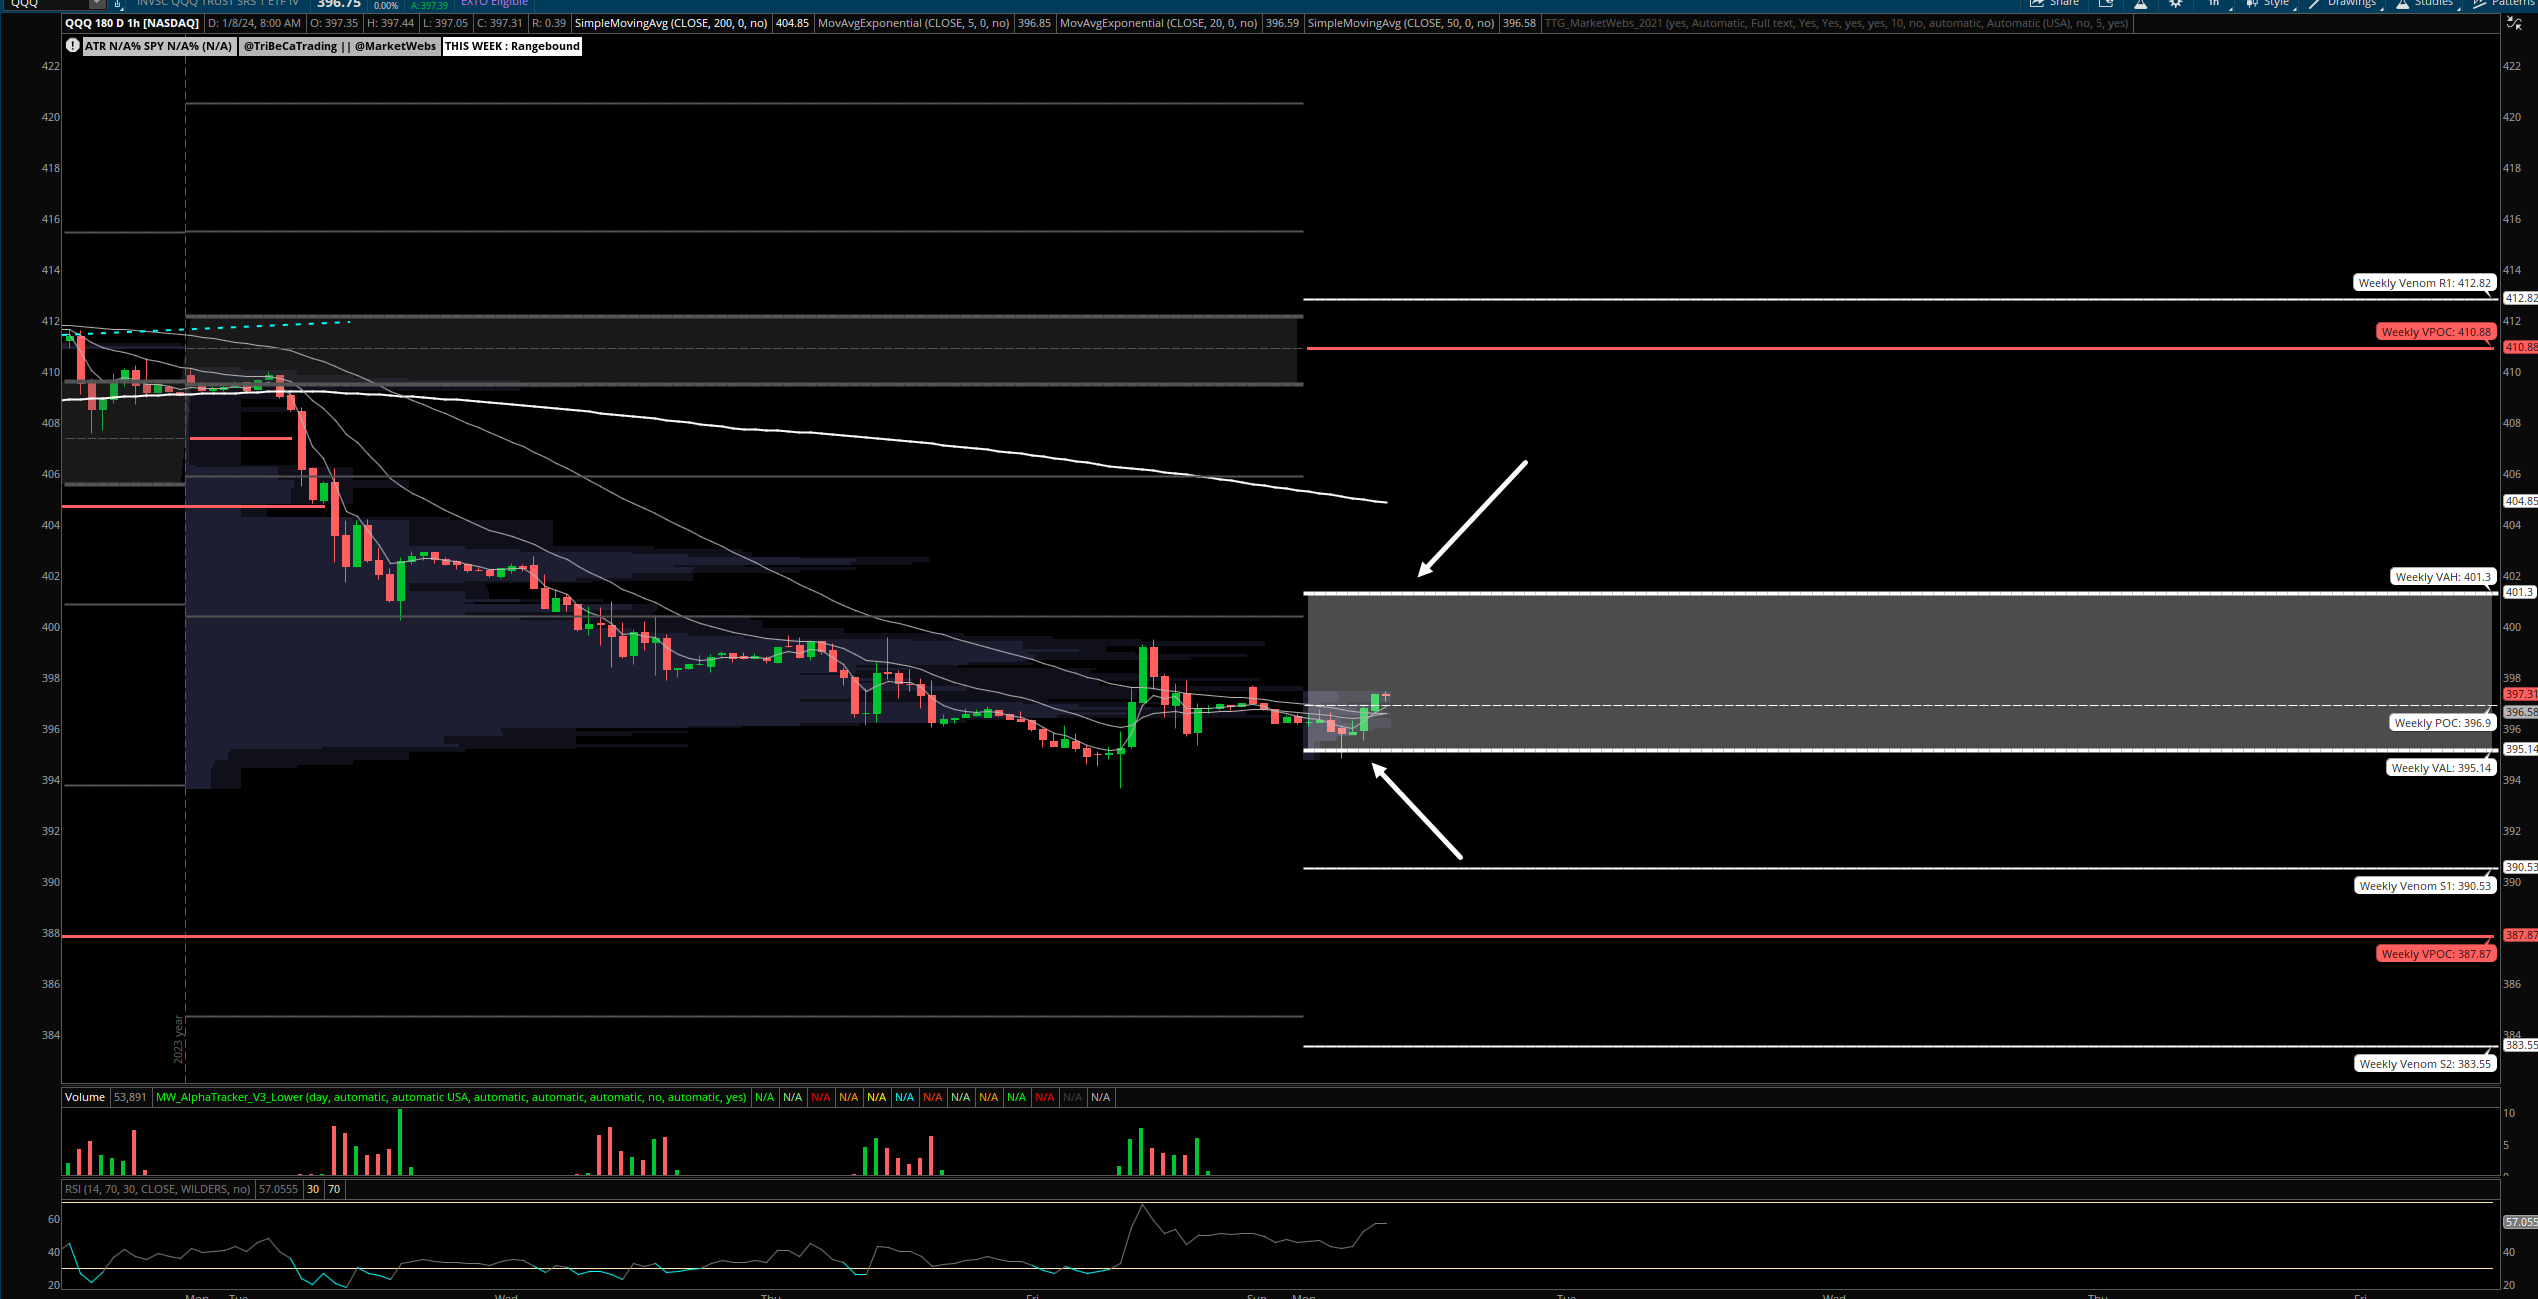
QQQ - NDX 100 ETF - Daily chart: Similar to the S&P, I am watching to see if price can retake its short term MAs this week

1hr chart: Price also starts the week inside its mew Value Area, support to watch is $395.14 & resistance $401.3
IWM - Russell Small Cap ETF- Daily Chart: Price trailing just a touch this morning, ind -0.1% and also is just below its short term MAs

1hr chart: Similar to the S&P and QQQ, price is inside its new Value Area for the week, support $191.44 & resistance $197.55

Here is today’s TTG Proprietary Stock Screen “Out of the Box” using Volume At Price
names trending above their Value Areas (on 3 multiple timeframes & not super extended)
Keep reading with a 7-day free trial
Subscribe to The Tribeca Trade Group to keep reading this post and get 7 days of free access to the full post archives.