

TTG Index Charts & Out of the Box Stock Screen 4/17/24 $STLD
TTG Index Charts & Out of the Box Stock Screen 4/17/24 $STLD
Out of the Box MarketWebs Screen
US Dollar -0.1% / 30yr Bonds flat / Crude -0.6% & Nat Gas -4.0% / Gold -0.2% / Copper +0.8% / BTC -0.1%
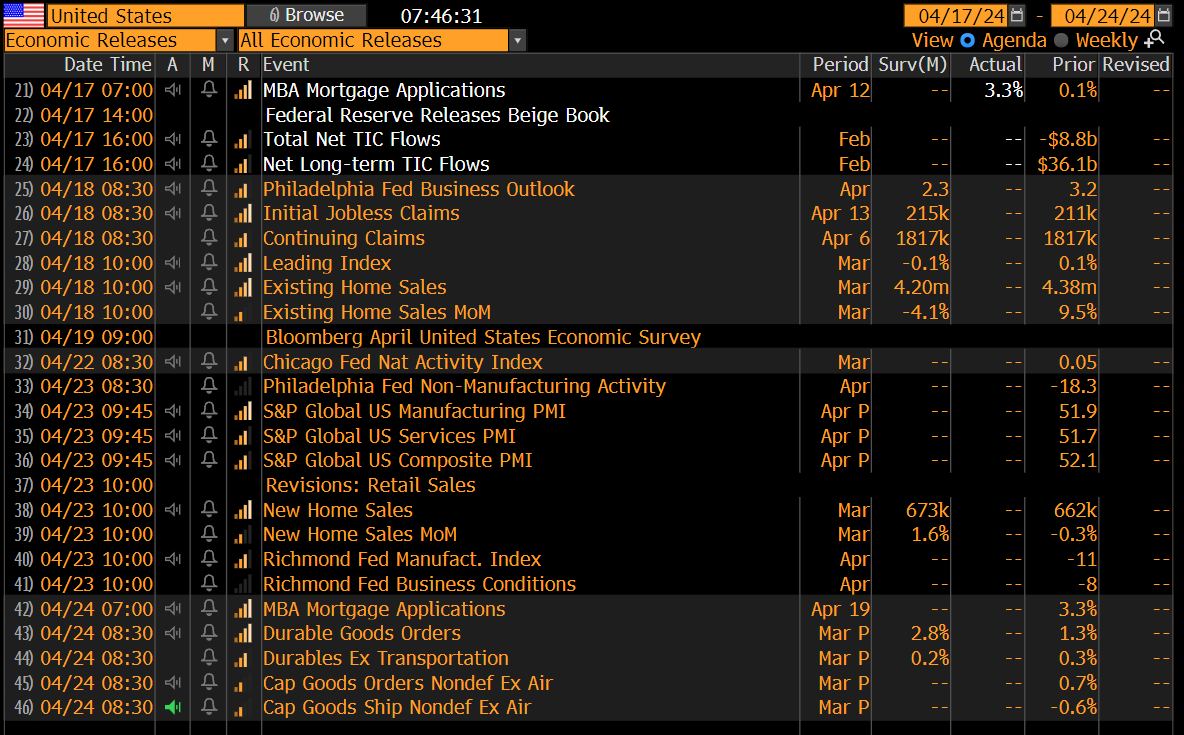
US Upcoming Economics
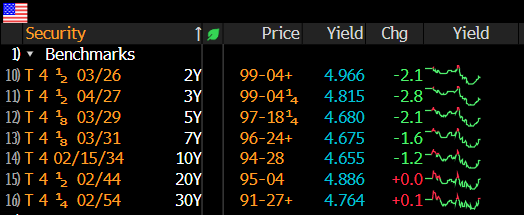
US Bond Yields
Index Updates
At TTG, I use Volume At Price in my chart analysis and I use the MarketWebs Indicator to provide Value Areas & VPOCs which indicate significant support & resistance levels. Learn More Here about Volume At Price and the MarketWebs.
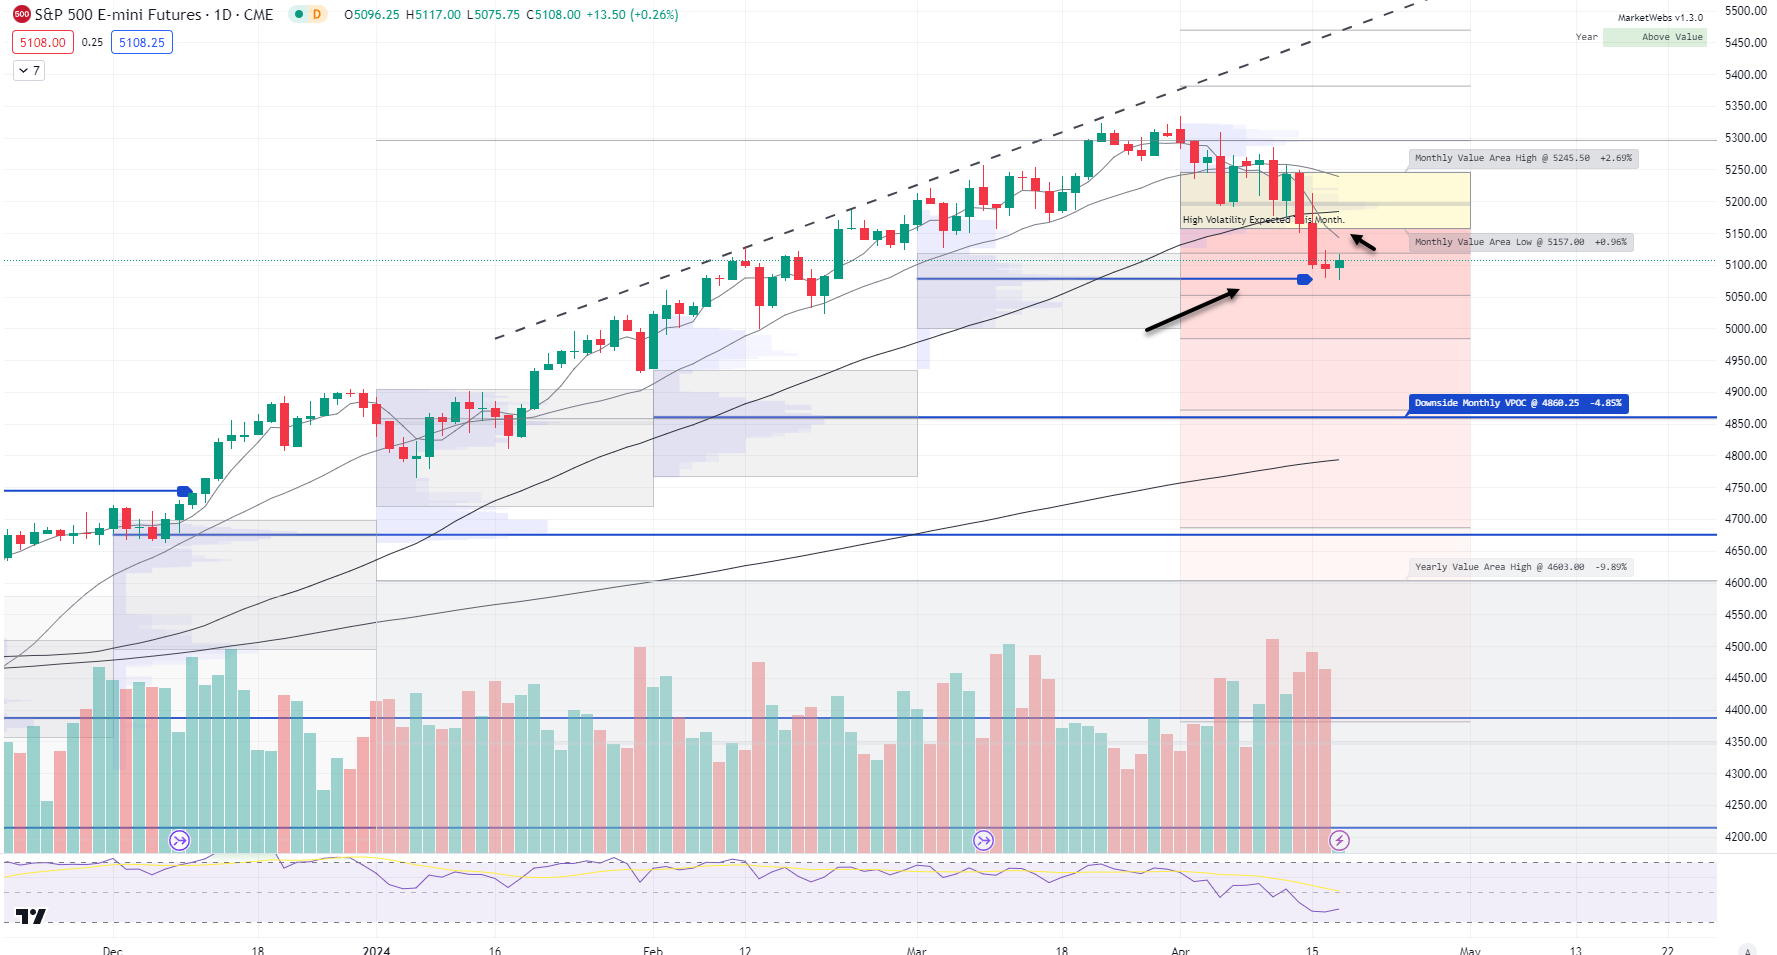
ES_F - SPX Futures - Daily chart: Price ind. +0.3% after a lower VPOC was taken out, as mentioned yesterday, this is a logical place for a bounce. However, there is resistance above at 5157 bottom of Apr Value Area
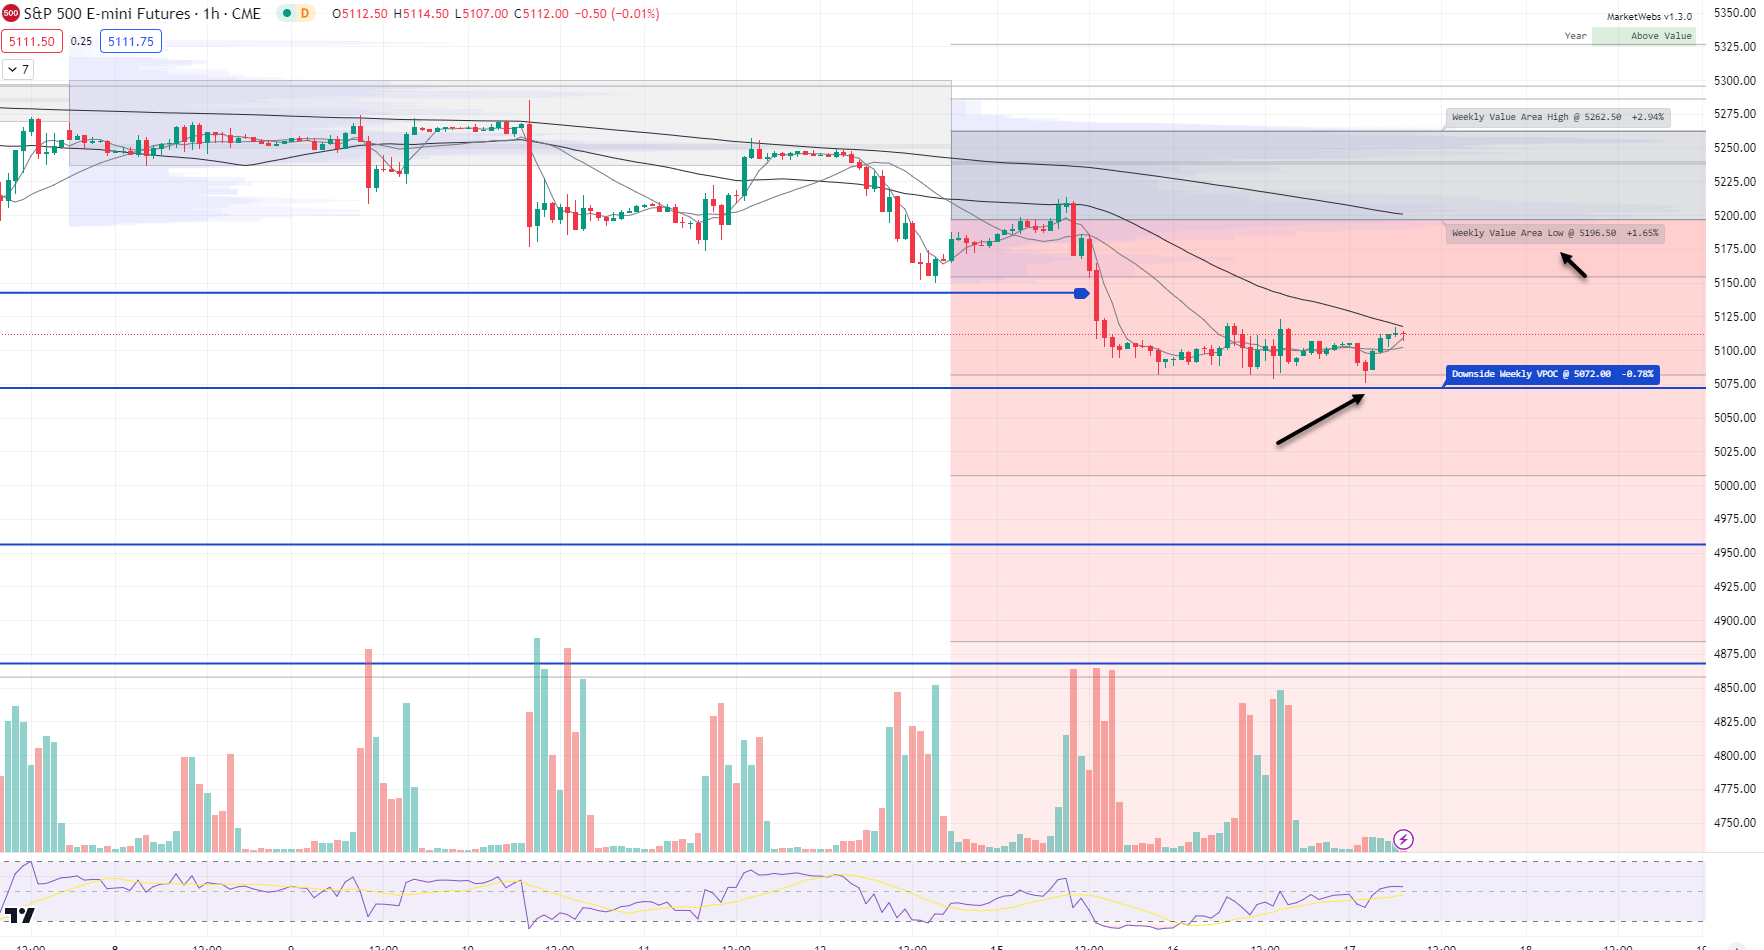
1hr chart: Price is decently below its Apr Value Area and a lower VPOC is still lingering @ 5072 (note its is not mandatory that price needs to take this out, but def something to watch)
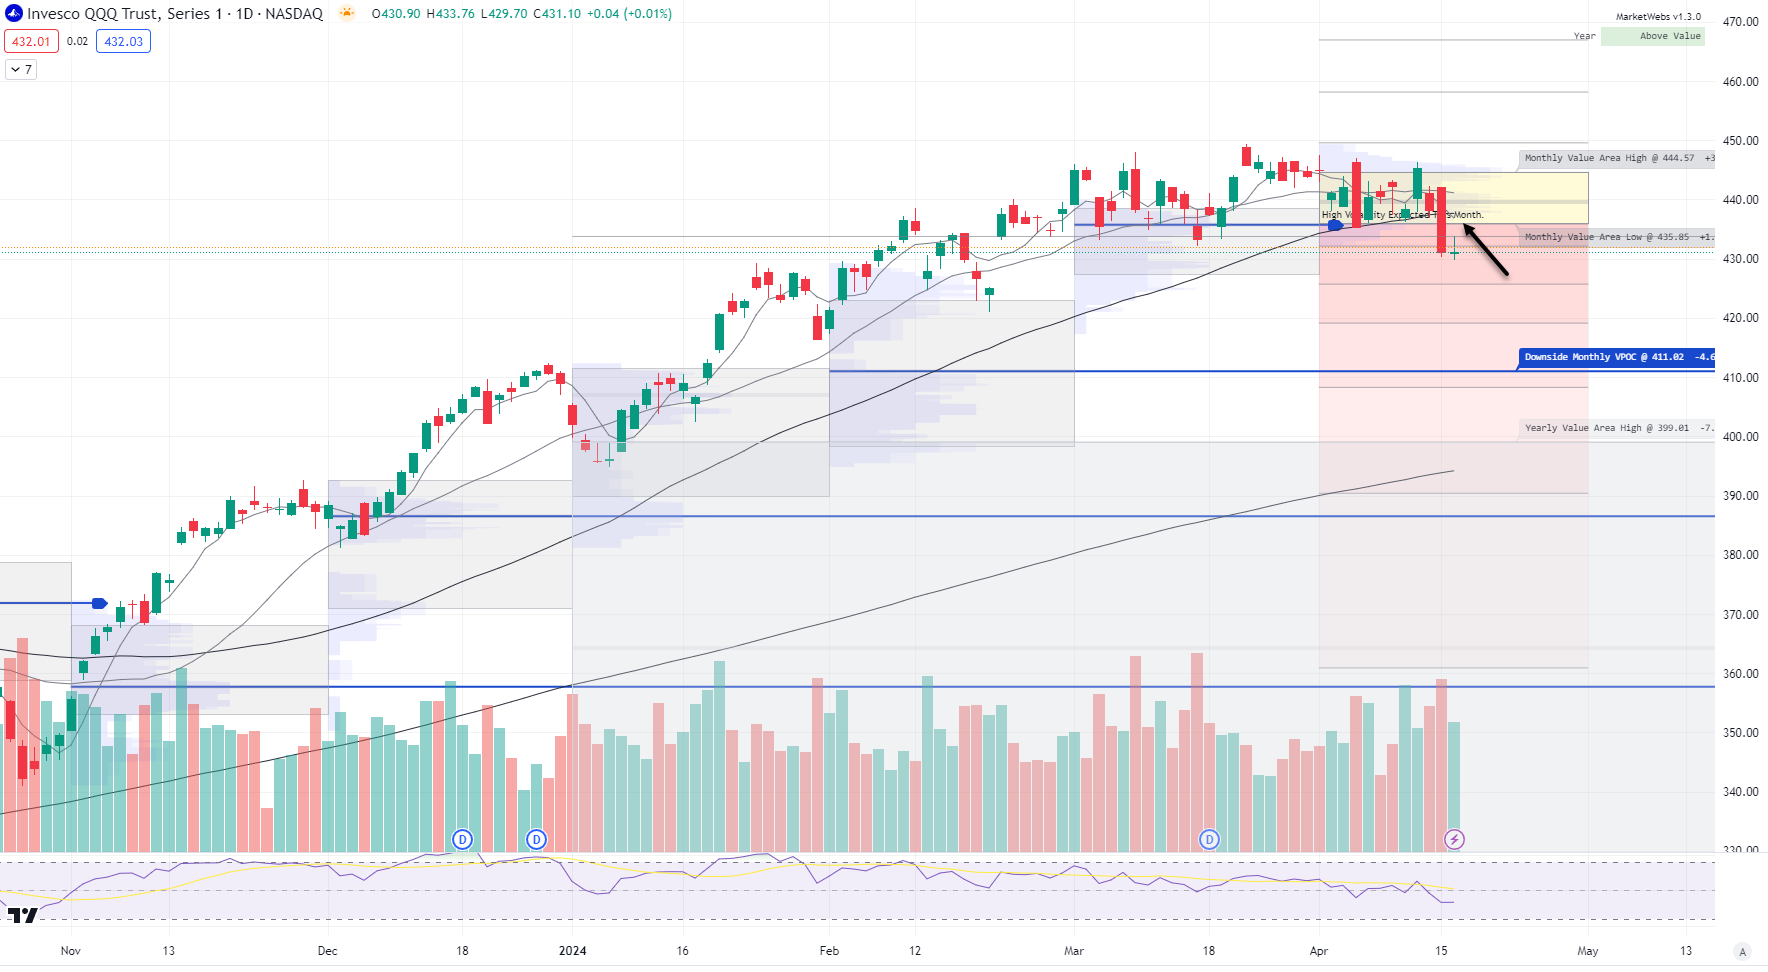
QQQ - NDX 100 ETF - Daily chart: Price ind. +0.2% and remains below its Apr Value Area, resistance up at $435.85
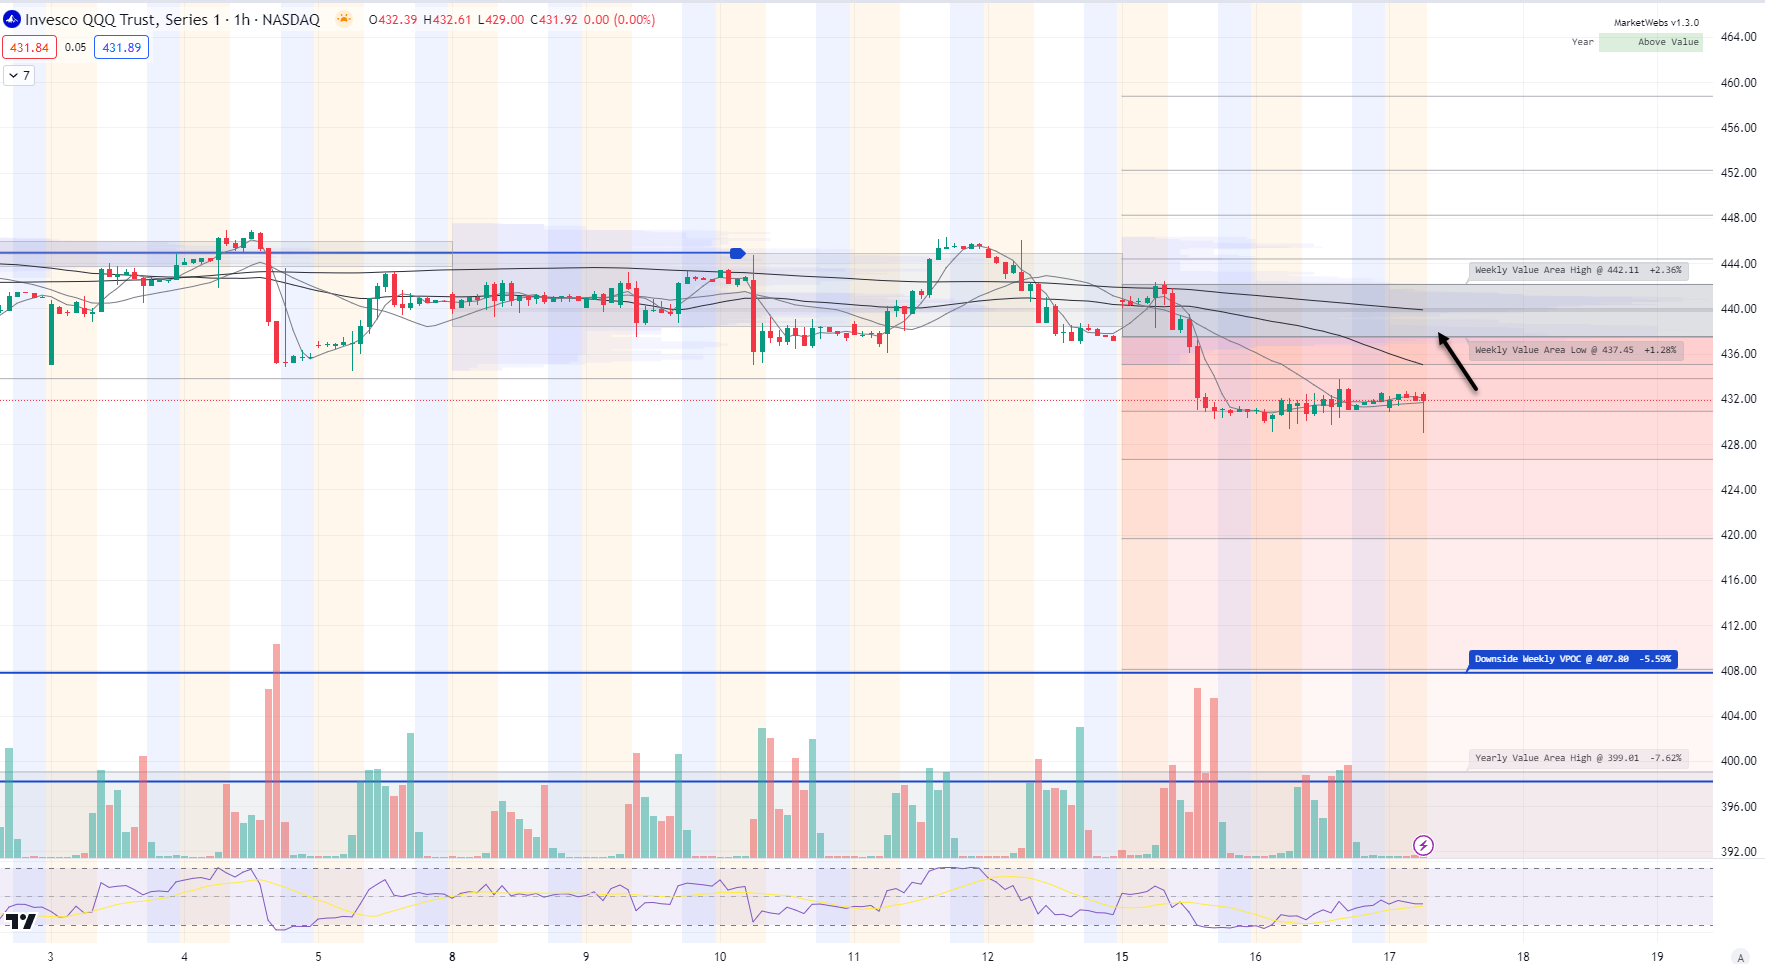
1hr chart: Price below below its Value Area for week, resistance $437.45
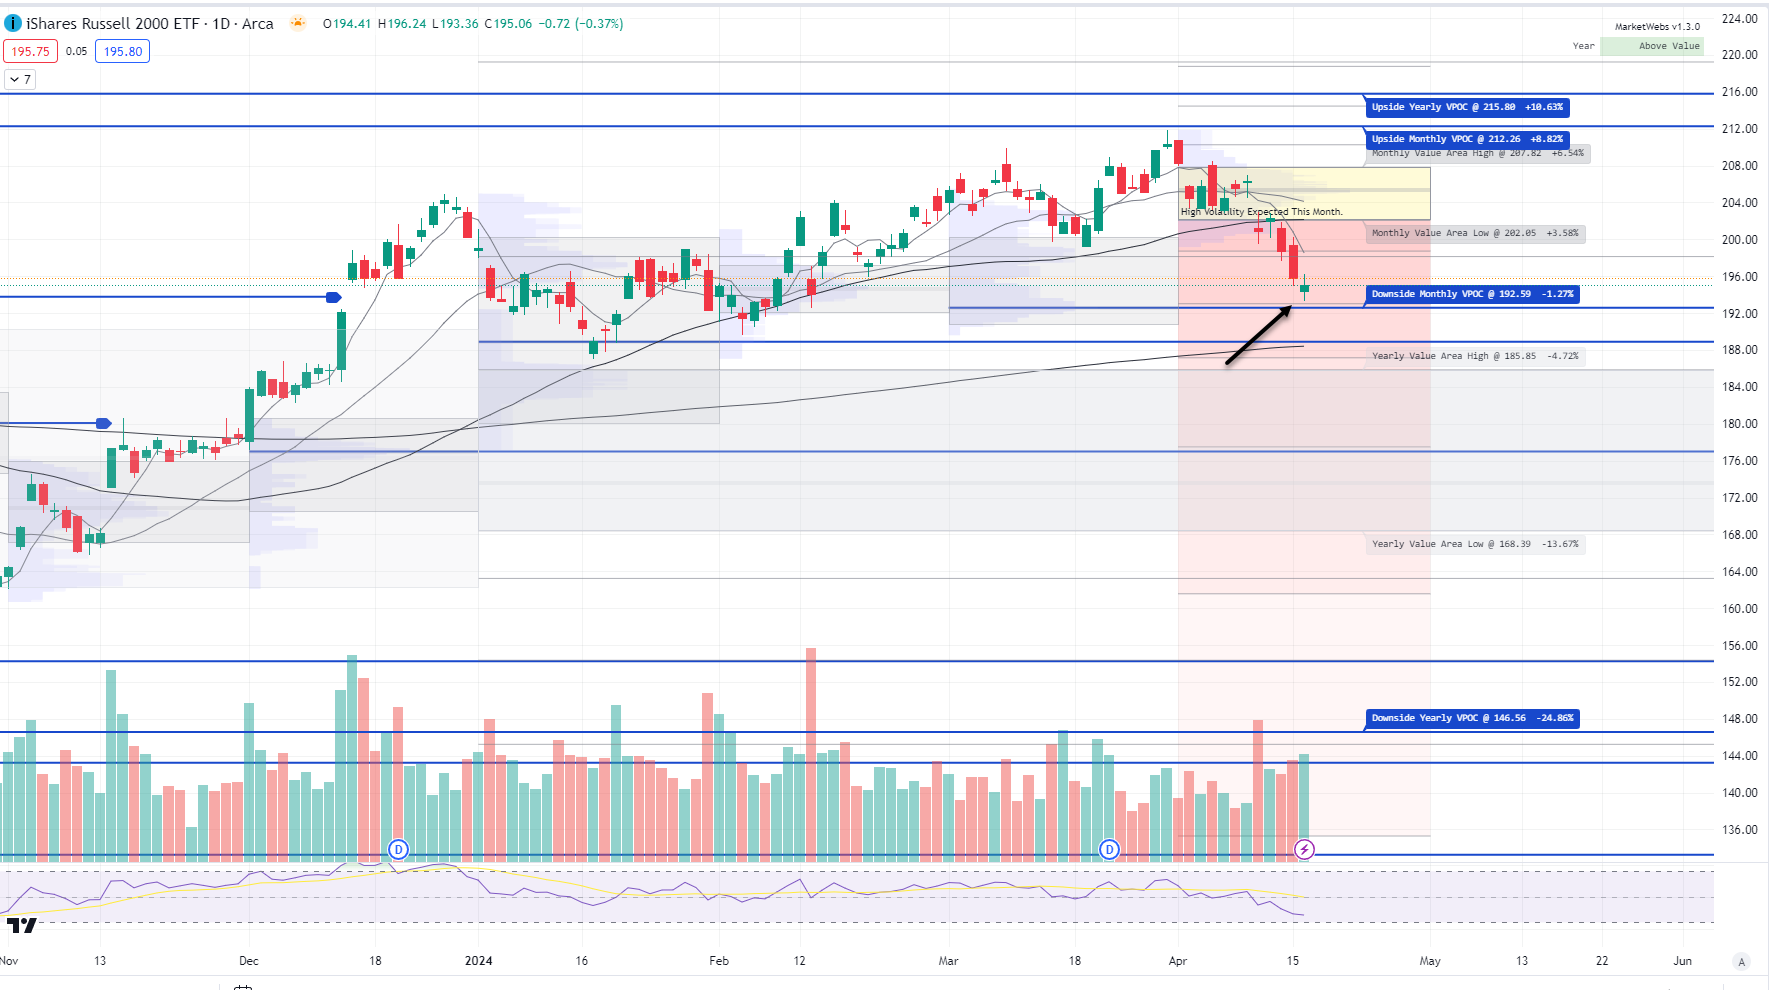
IWM - Russell Small Cap ETF- Price ind. +0.3% , lower VPOC remains at $192.59 (blue line) and resistance up at $202.05
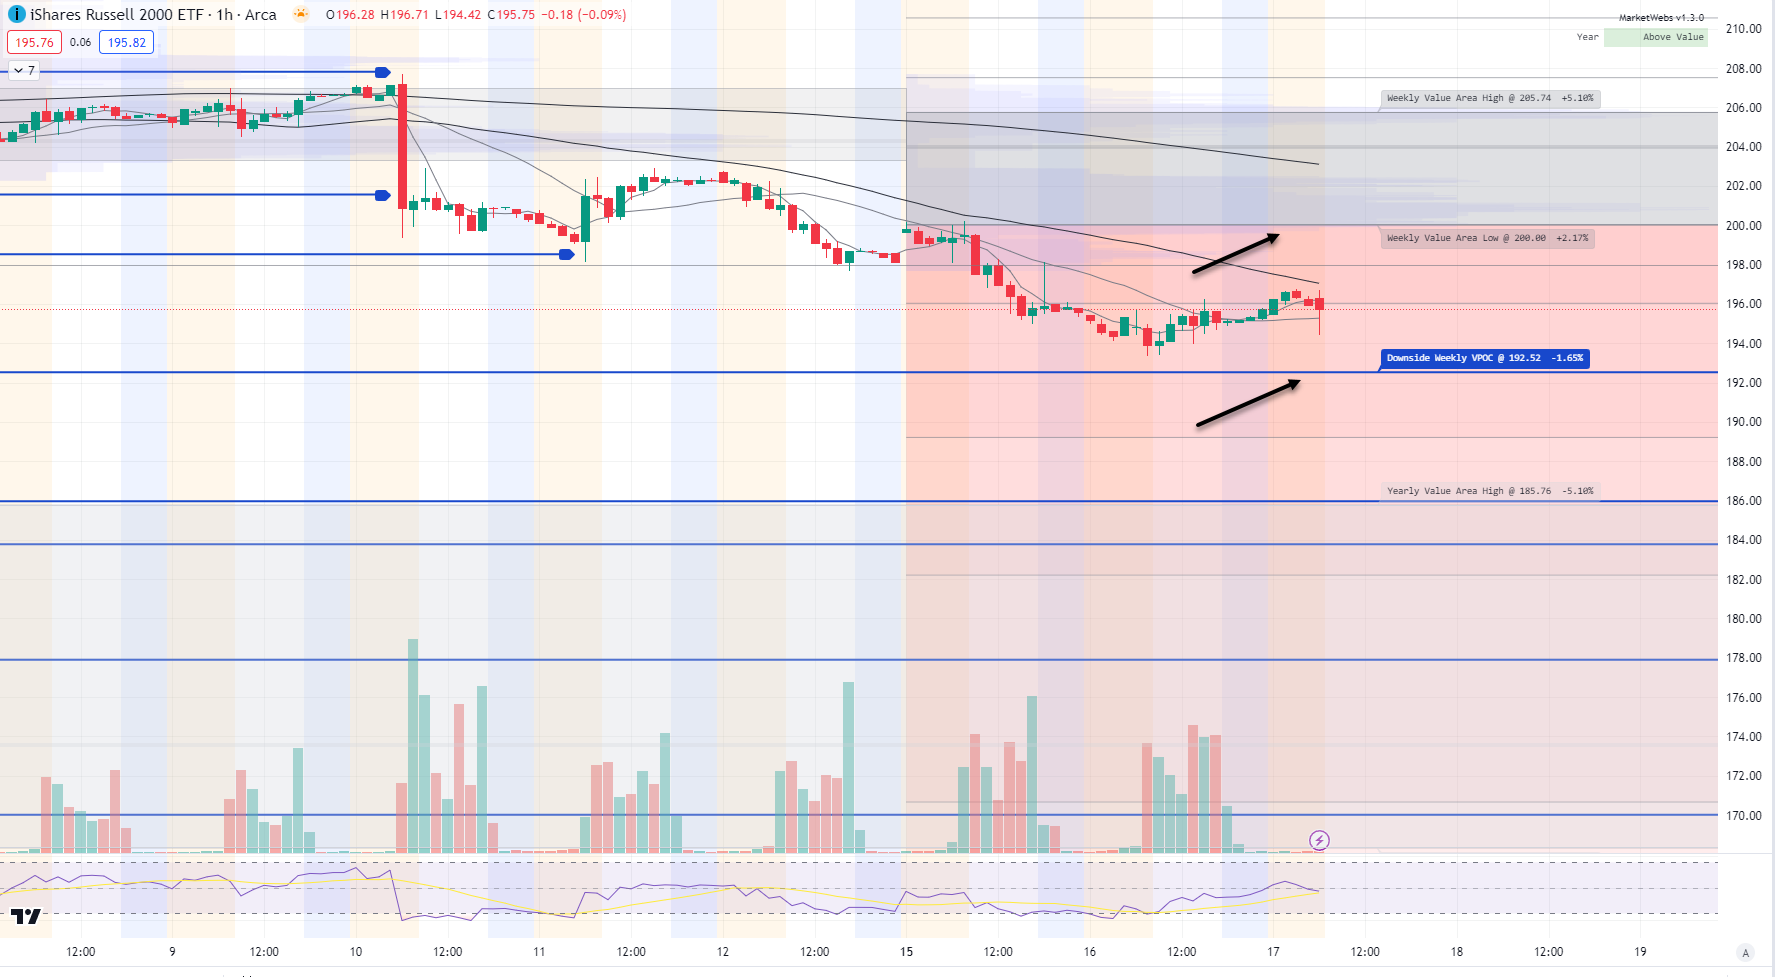
1hr chart: Price trying to bounce this morning and support to watch is still $192.52 VPOC
Here is today’s TTG Proprietary Stock Screen “Out of the Box” using Volume At Price
names trending above their Value Areas (on 3 multiple timeframes & not super extended)
Keep reading with a 7-day free trial
Subscribe to The Tribeca Trade Group to keep reading this post and get 7 days of free access to the full post archives.