

TTG Index Charts & Out of the Box Stock Screen 4/11/24 $WMT
TTG Index Charts & Out of the Box Stock Screen 4/11/24 $WMT
Out of the Box MarketWebs Screen
I will be traveling for the reminder of the week (last note of the week)
US Dollar flat / 30yr Bonds flat / Crude -0.7% & Nat Gas -1.2% / Gold +0.3% / Copper -0.4% / BTC +0.7%
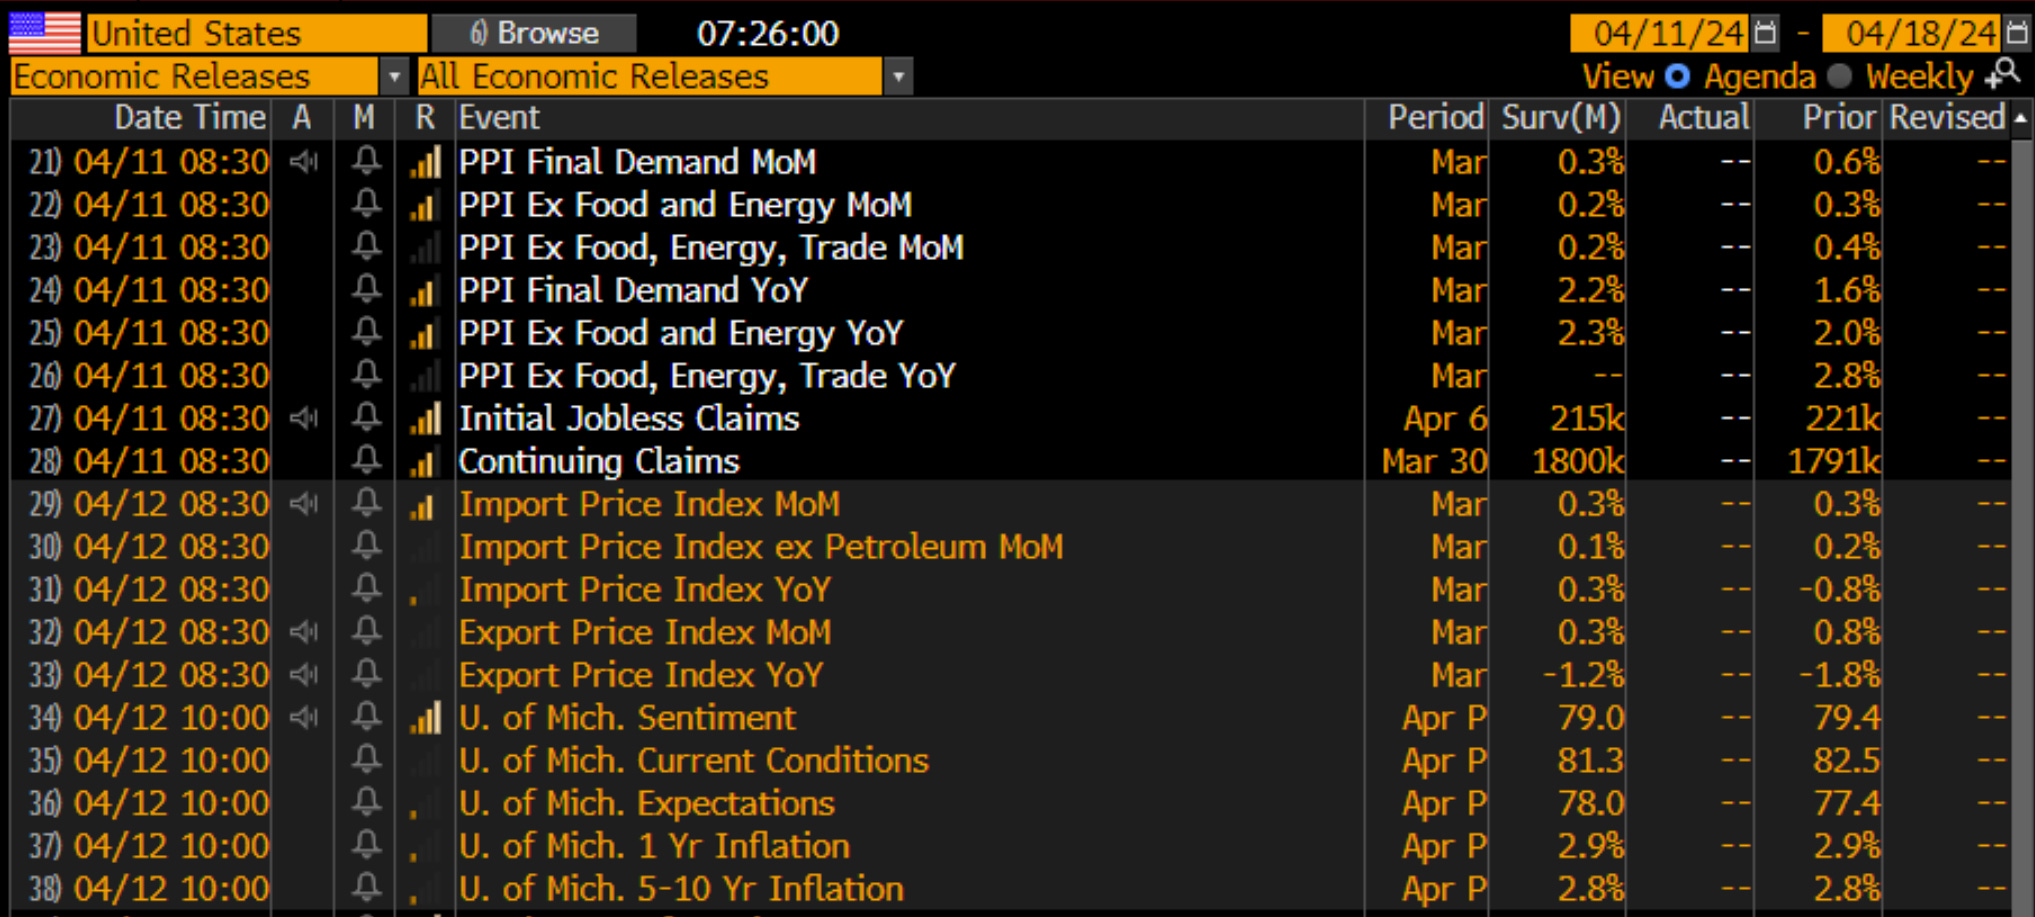
US Upcoming Economics (also note 30yr Bond Auction today1pm)
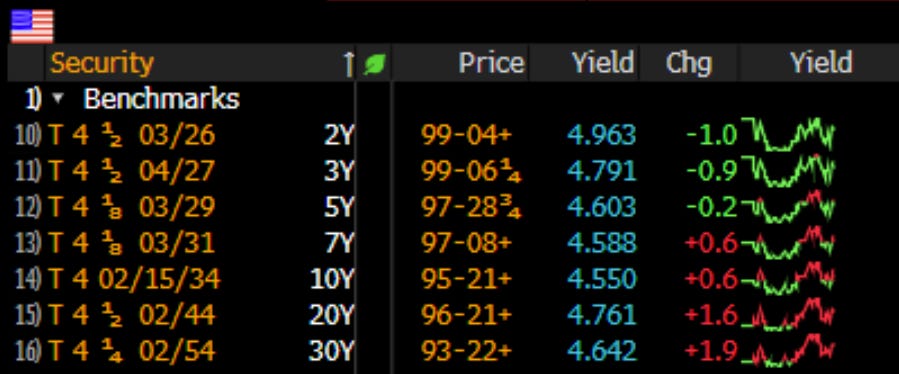
US Bond Yields
Index Updates
At TTG, I use Volume At Price in my chart analysis and I use the MarketWebs Indicator to provide Value Areas & VPOCs which indicate significant support & resistance levels. Learn More Here about Volume At Price and the MarketWebs.
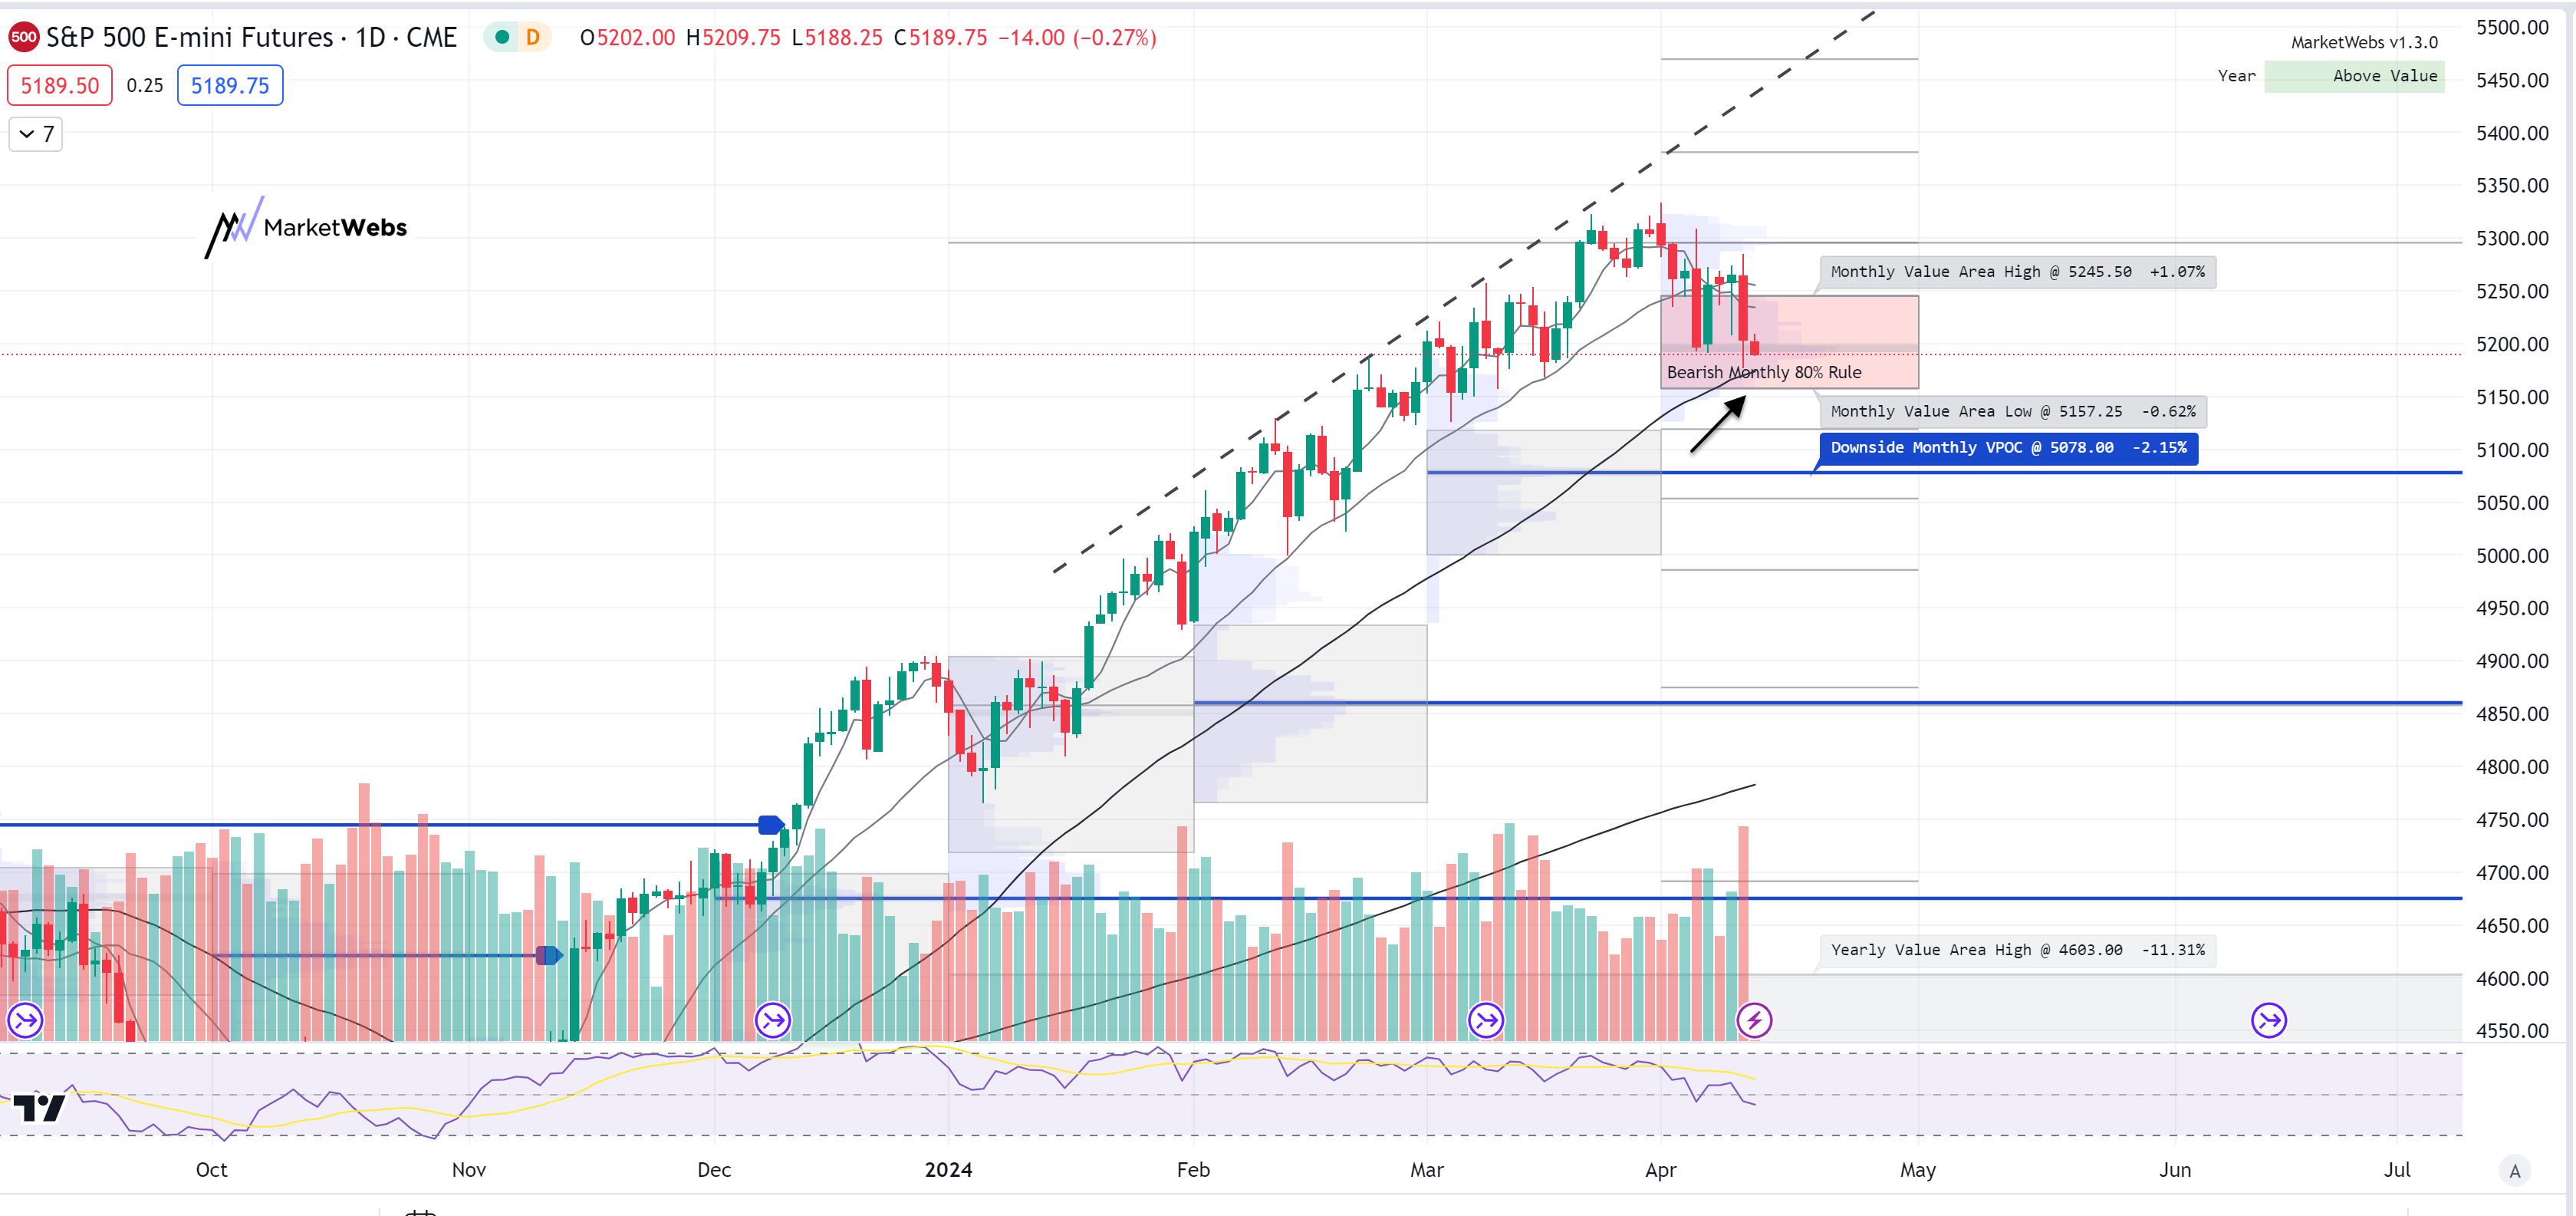
ES_F - SPX Futures - Daily chart: Price fell into the April Value Area yesterday and triggered the bearish 80% rule, aiming for a move down to bottom of Value 5157.25, that is support to watch along with the 50d MA (Moving Average)
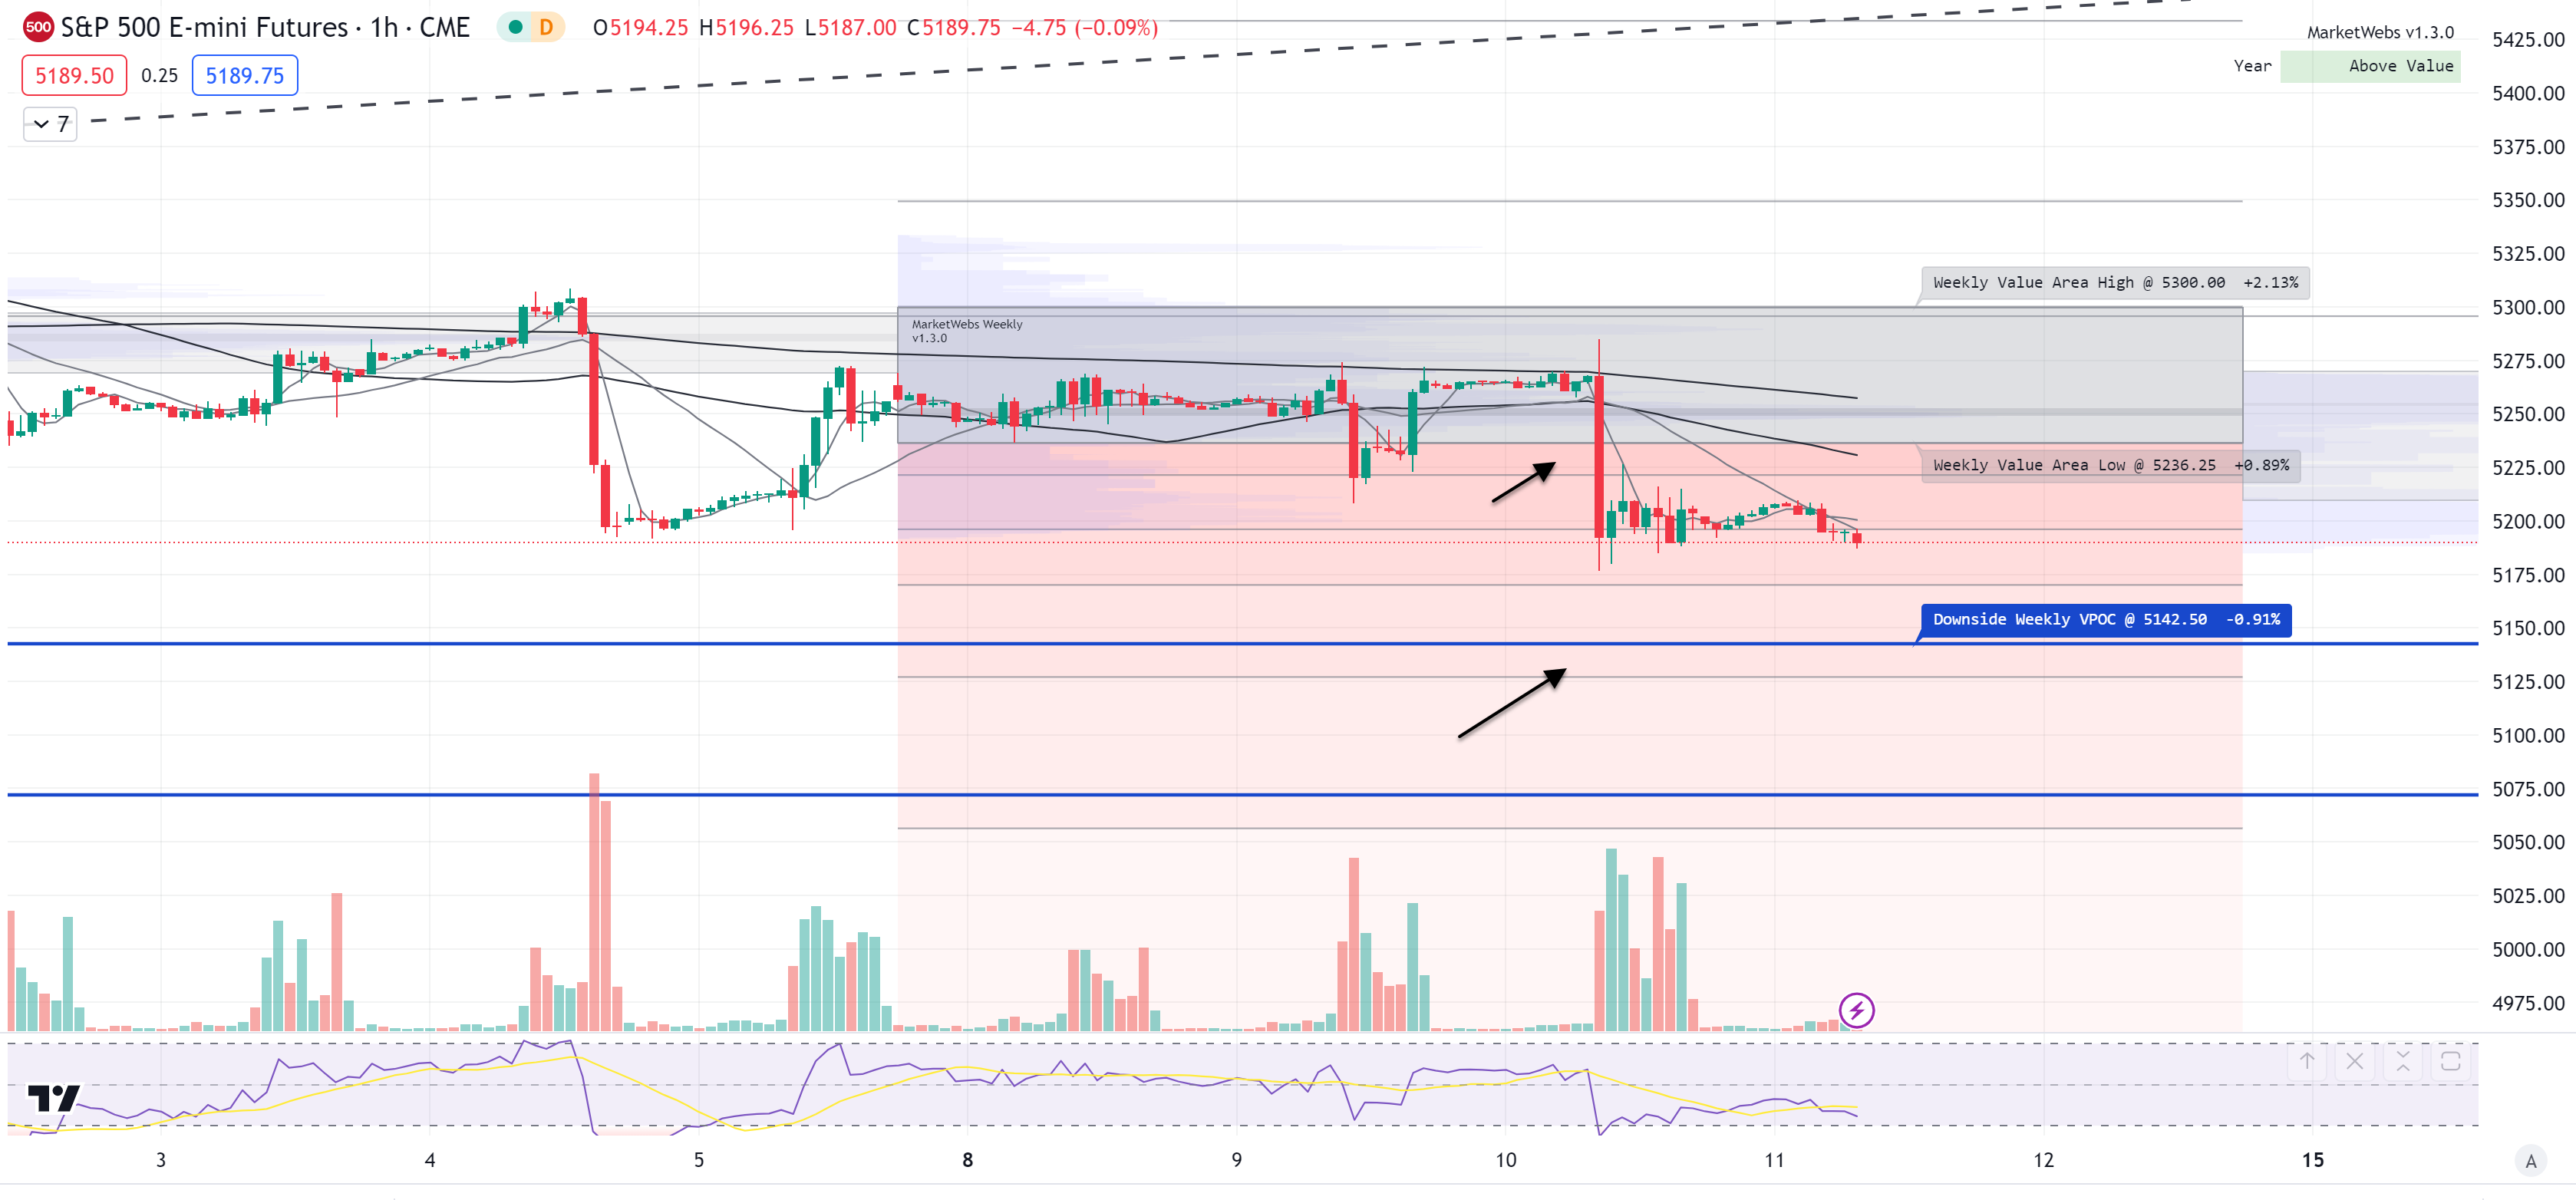
1hr chart: Price has broken below its Value Area for the week , next lower level to watch is 5142.5 VPOC (blue line)
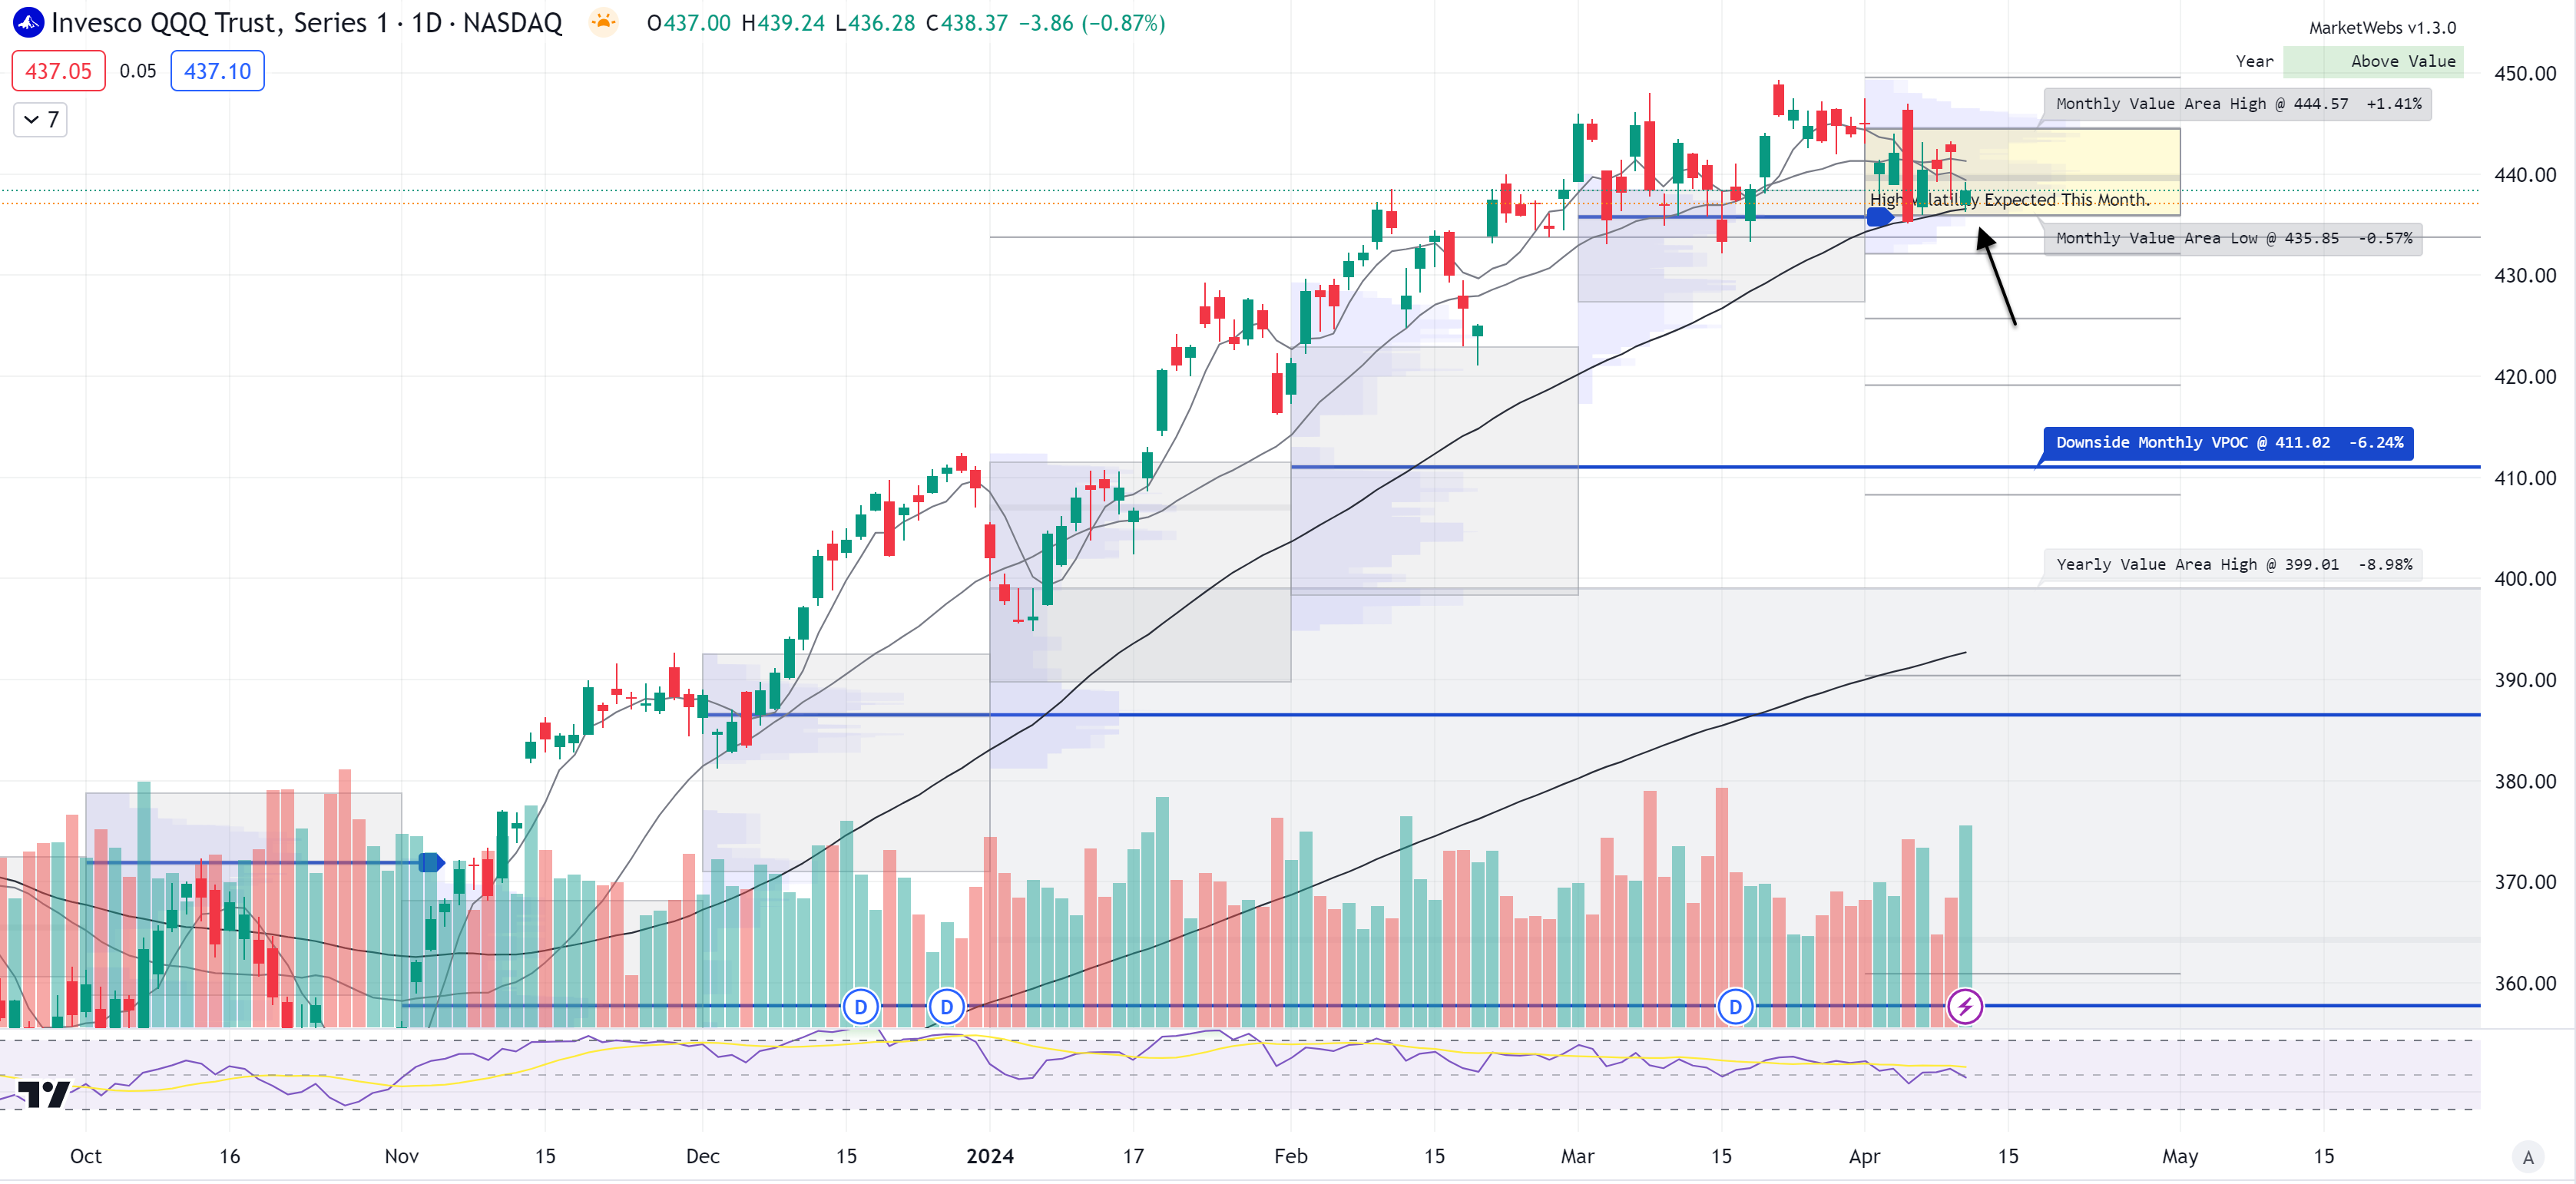
QQQ - NDX 100 ETF - Daily chart: Prices continuing lower this morning and looks to be breaking the April Value Area, breakdown level to watch $435.85
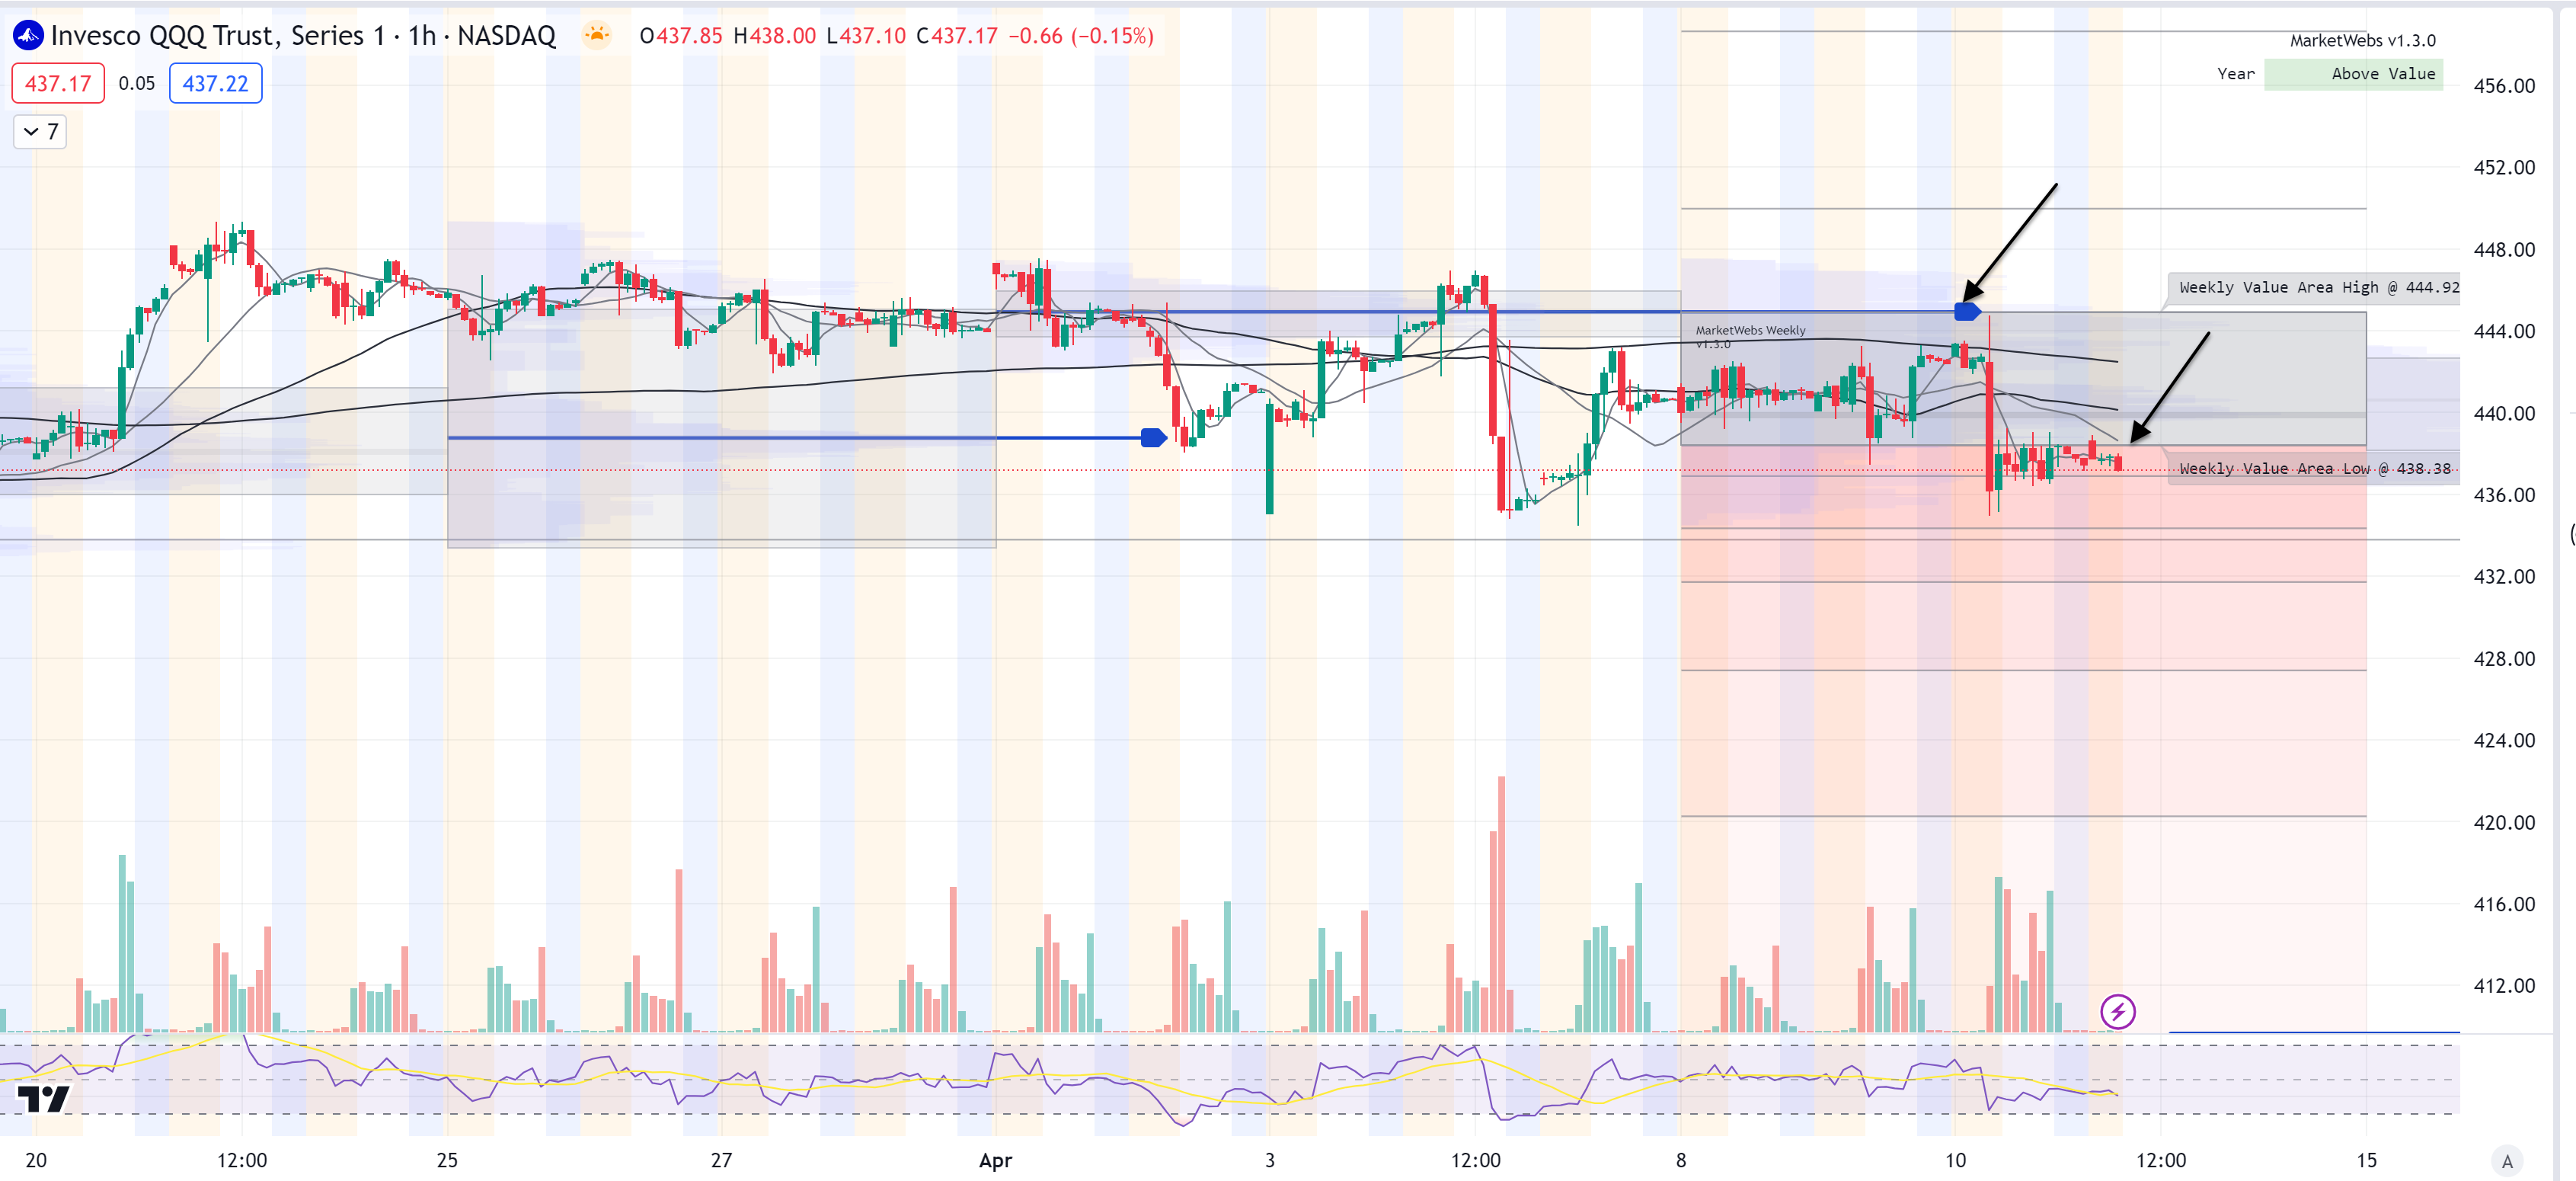
1hr chart: Price currently below its Value Area for the week, resistance level to watch is $438.38 , if price cannot reclaim this level the index looks vulnerable to further breakdown
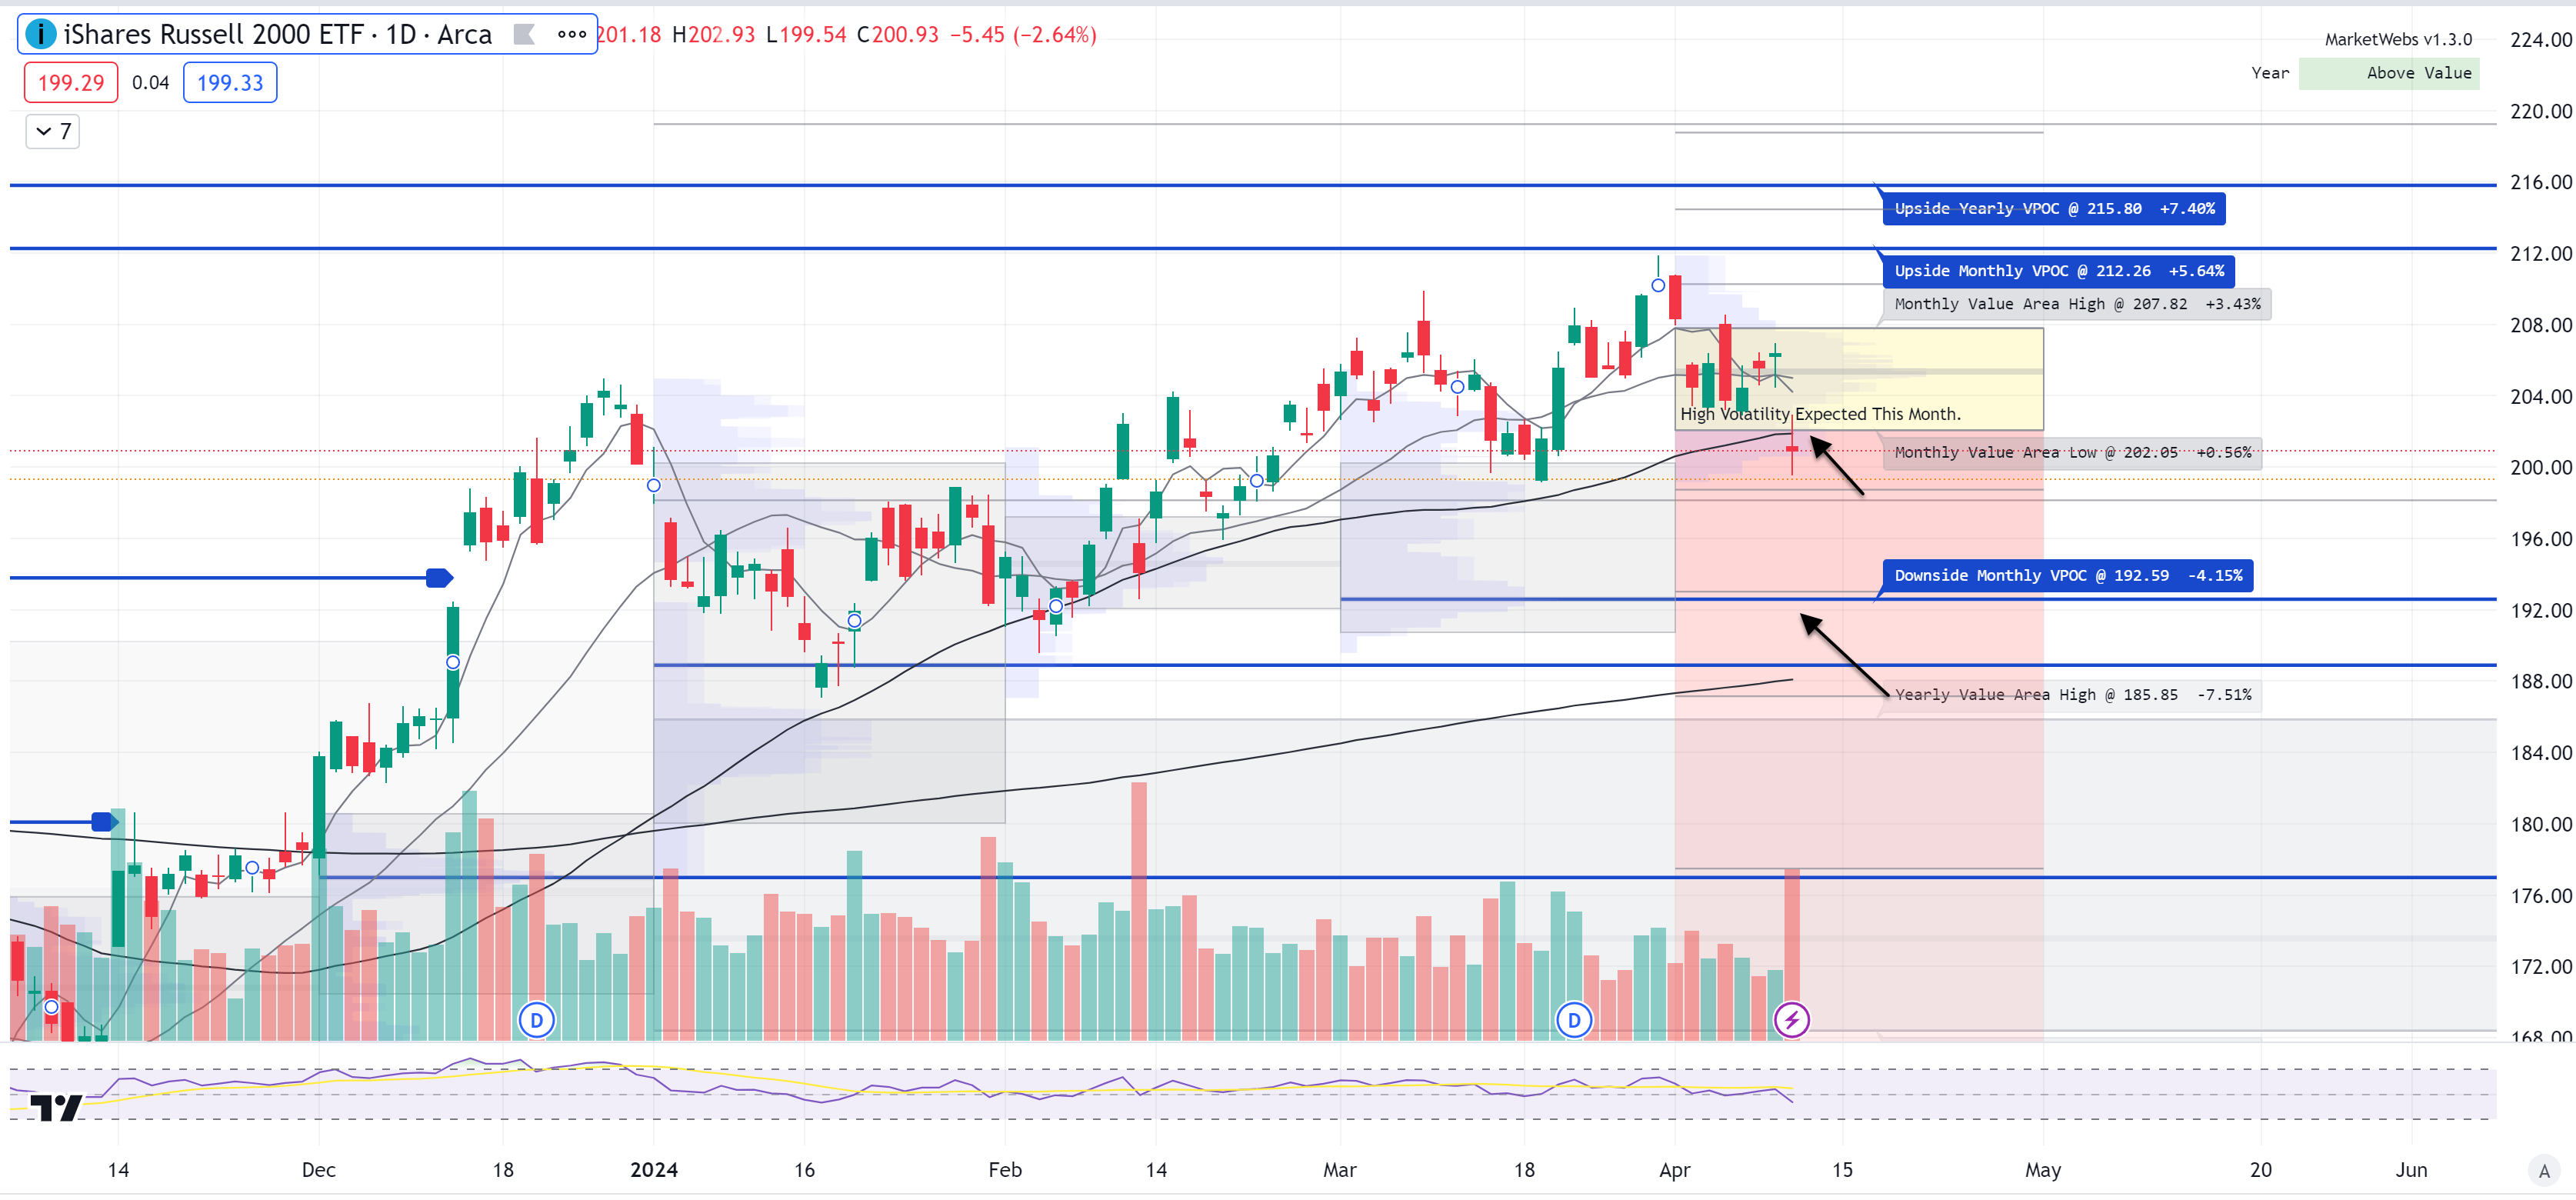
IWM - Russell Small Cap ETF- Price underperforming (-0.7%) this morning ahead of PPI data and price is now below its Apr Value Area and 50d MA
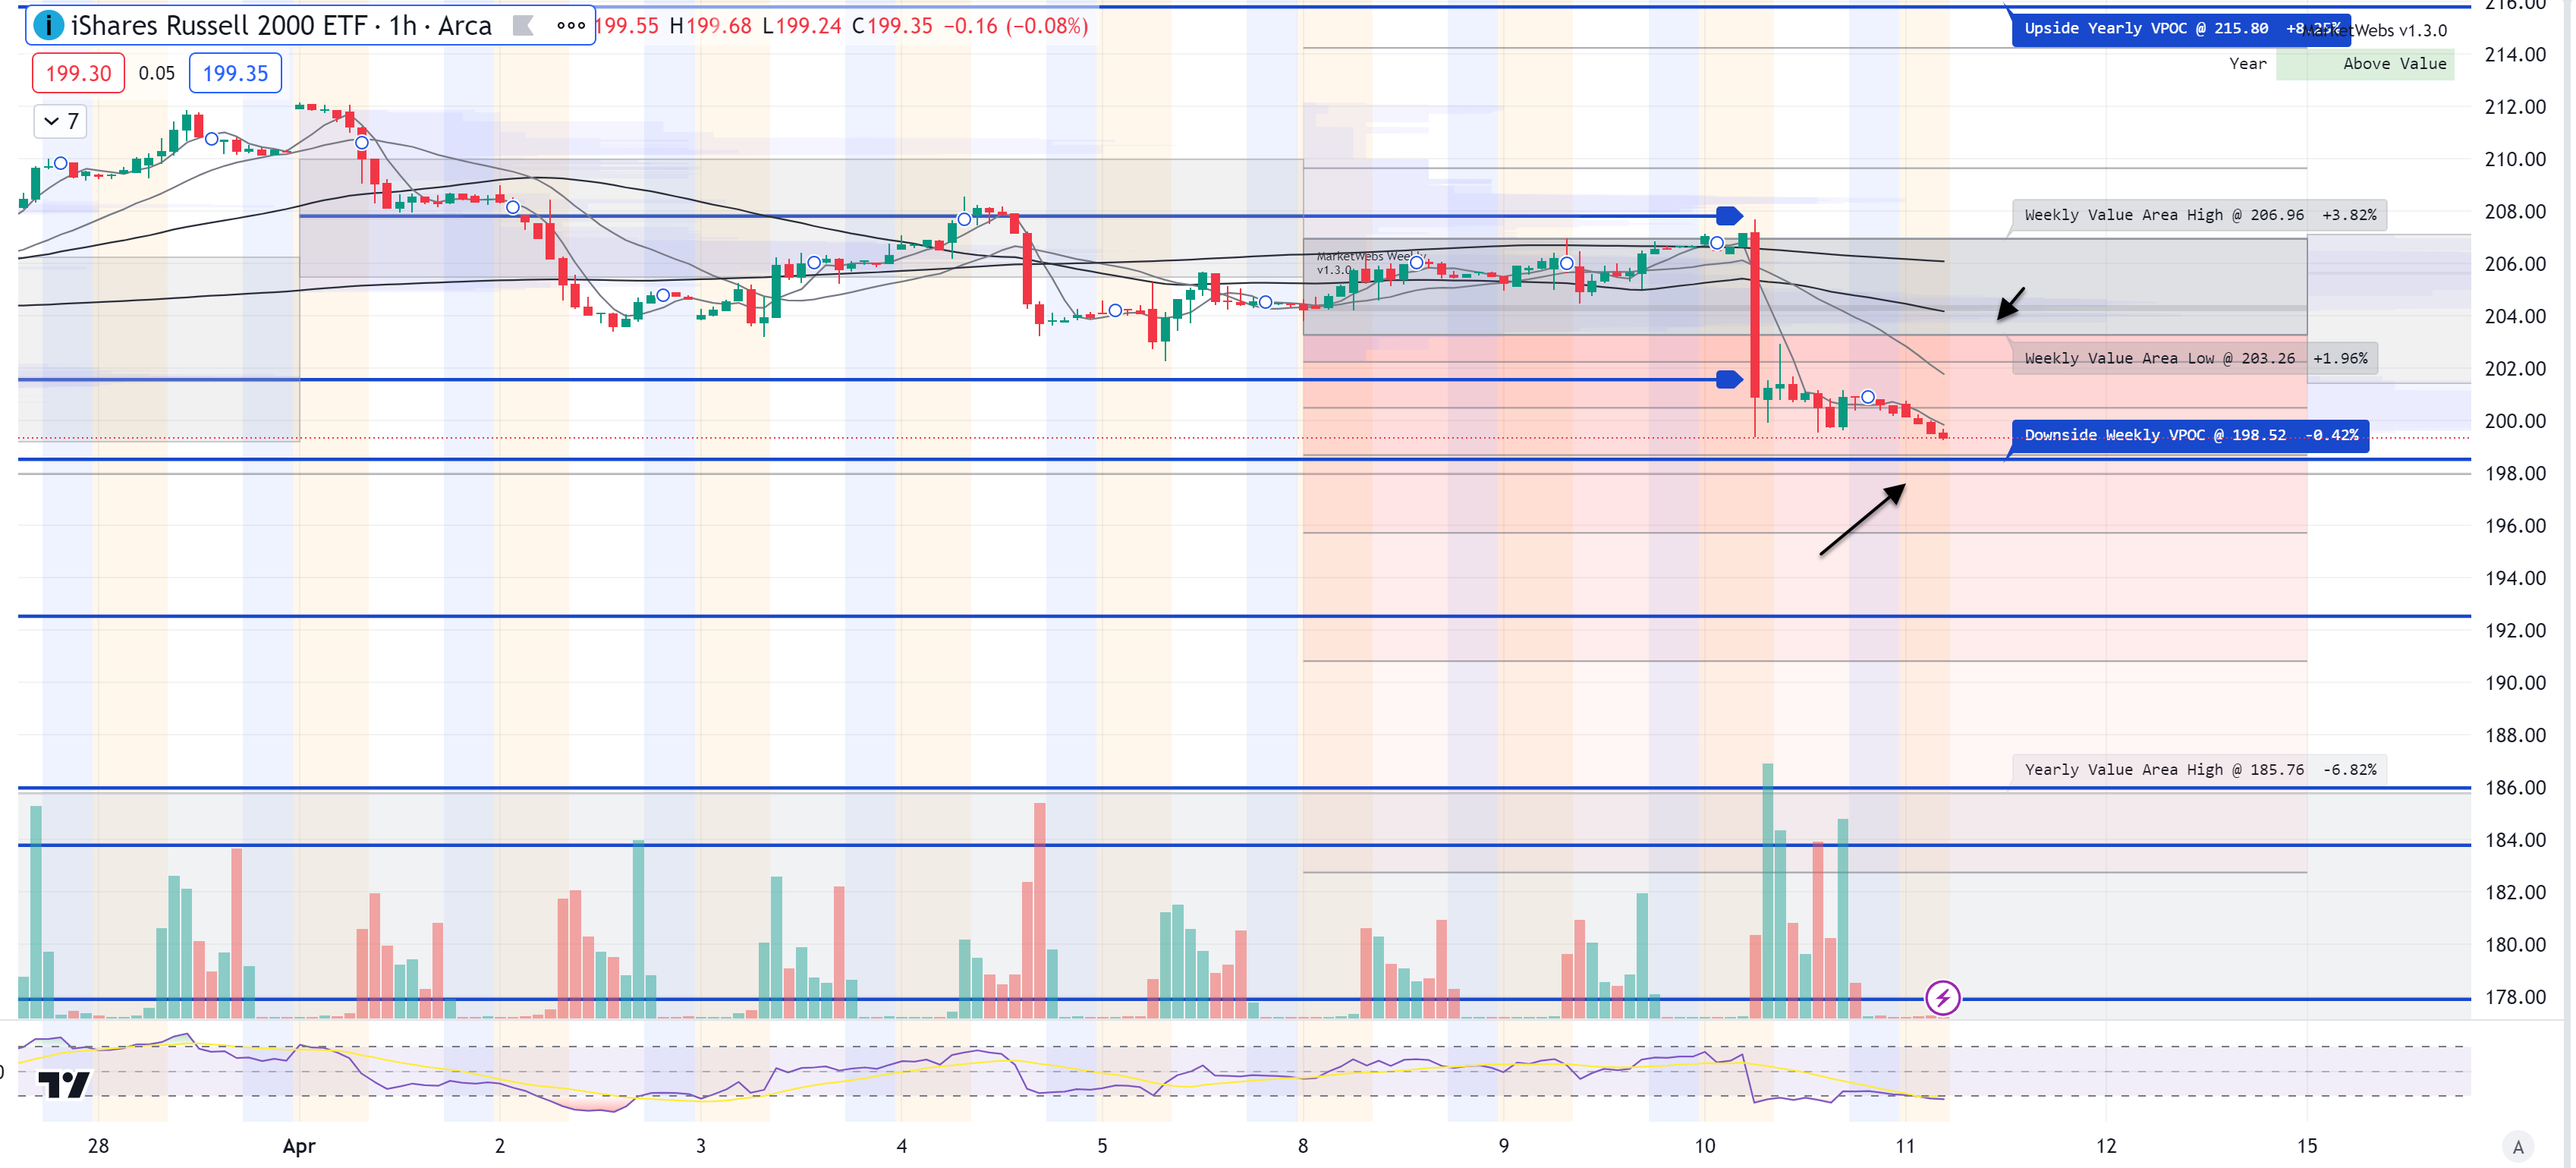
1hr chart: Price continuing to fall below its Value Area for week
Here is today’s TTG Proprietary Stock Screen “Out of the Box” using Volume At Price
names trending above their Value Areas (on 3 multiple timeframes & not super extended)
Keep reading with a 7-day free trial
Subscribe to The Tribeca Trade Group to keep reading this post and get 7 days of free access to the full post archives.