

TTG Index Charts & Out of the Box Stock Screen 4/25/24 $MUSA
TTG Index Charts & Out of the Box Stock Screen 4/25/24 $MUSA
Out of the Box MarketWebs Screen
US Dollar -0.2% / 30yr Bonds -0.1% / Crude +0.4% & Nat Gas -0.3% / Gold +0.1% / Copper +2.0% / BTC +0.1%
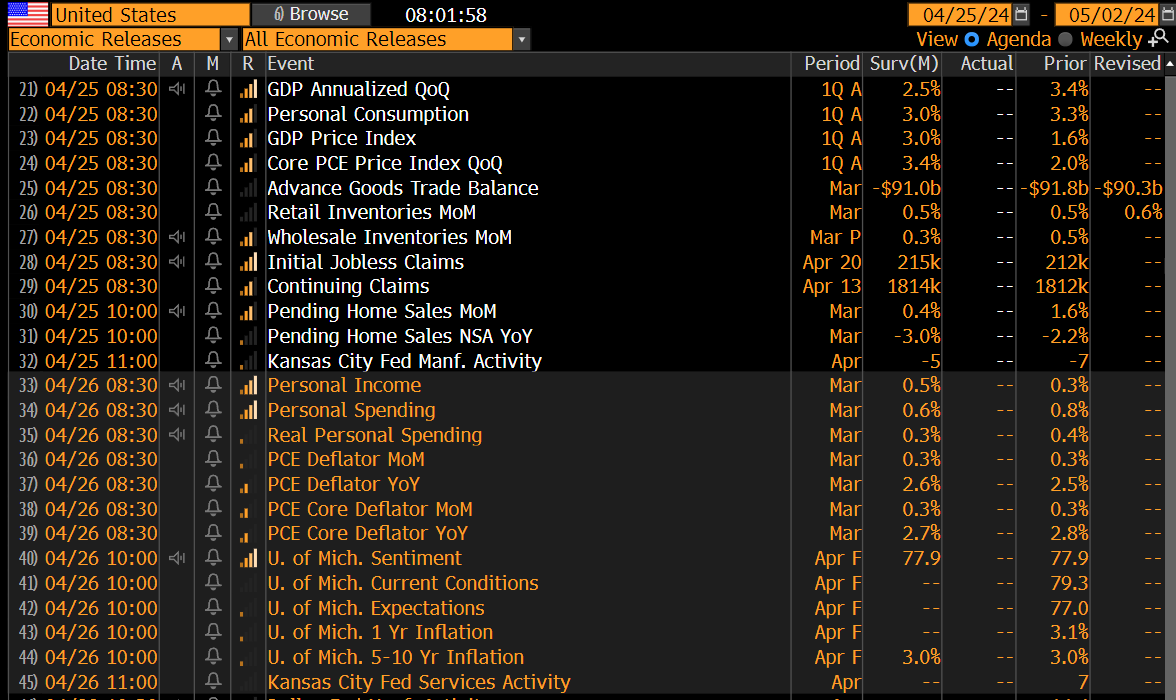
US Upcoming Economics
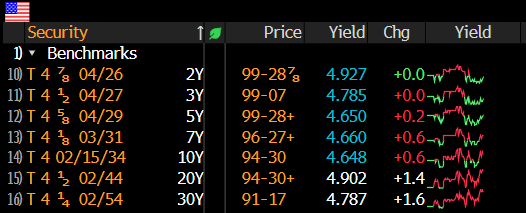
US Bond Yields & Upcoming Bond Auctions

Index Updates
At TTG, I use Volume At Price in my chart analysis and I use the MarketWebs Indicator to provide Value Areas & VPOCs which indicate significant support & resistance levels. Learn More Here about Volume At Price and the MarketWebs.

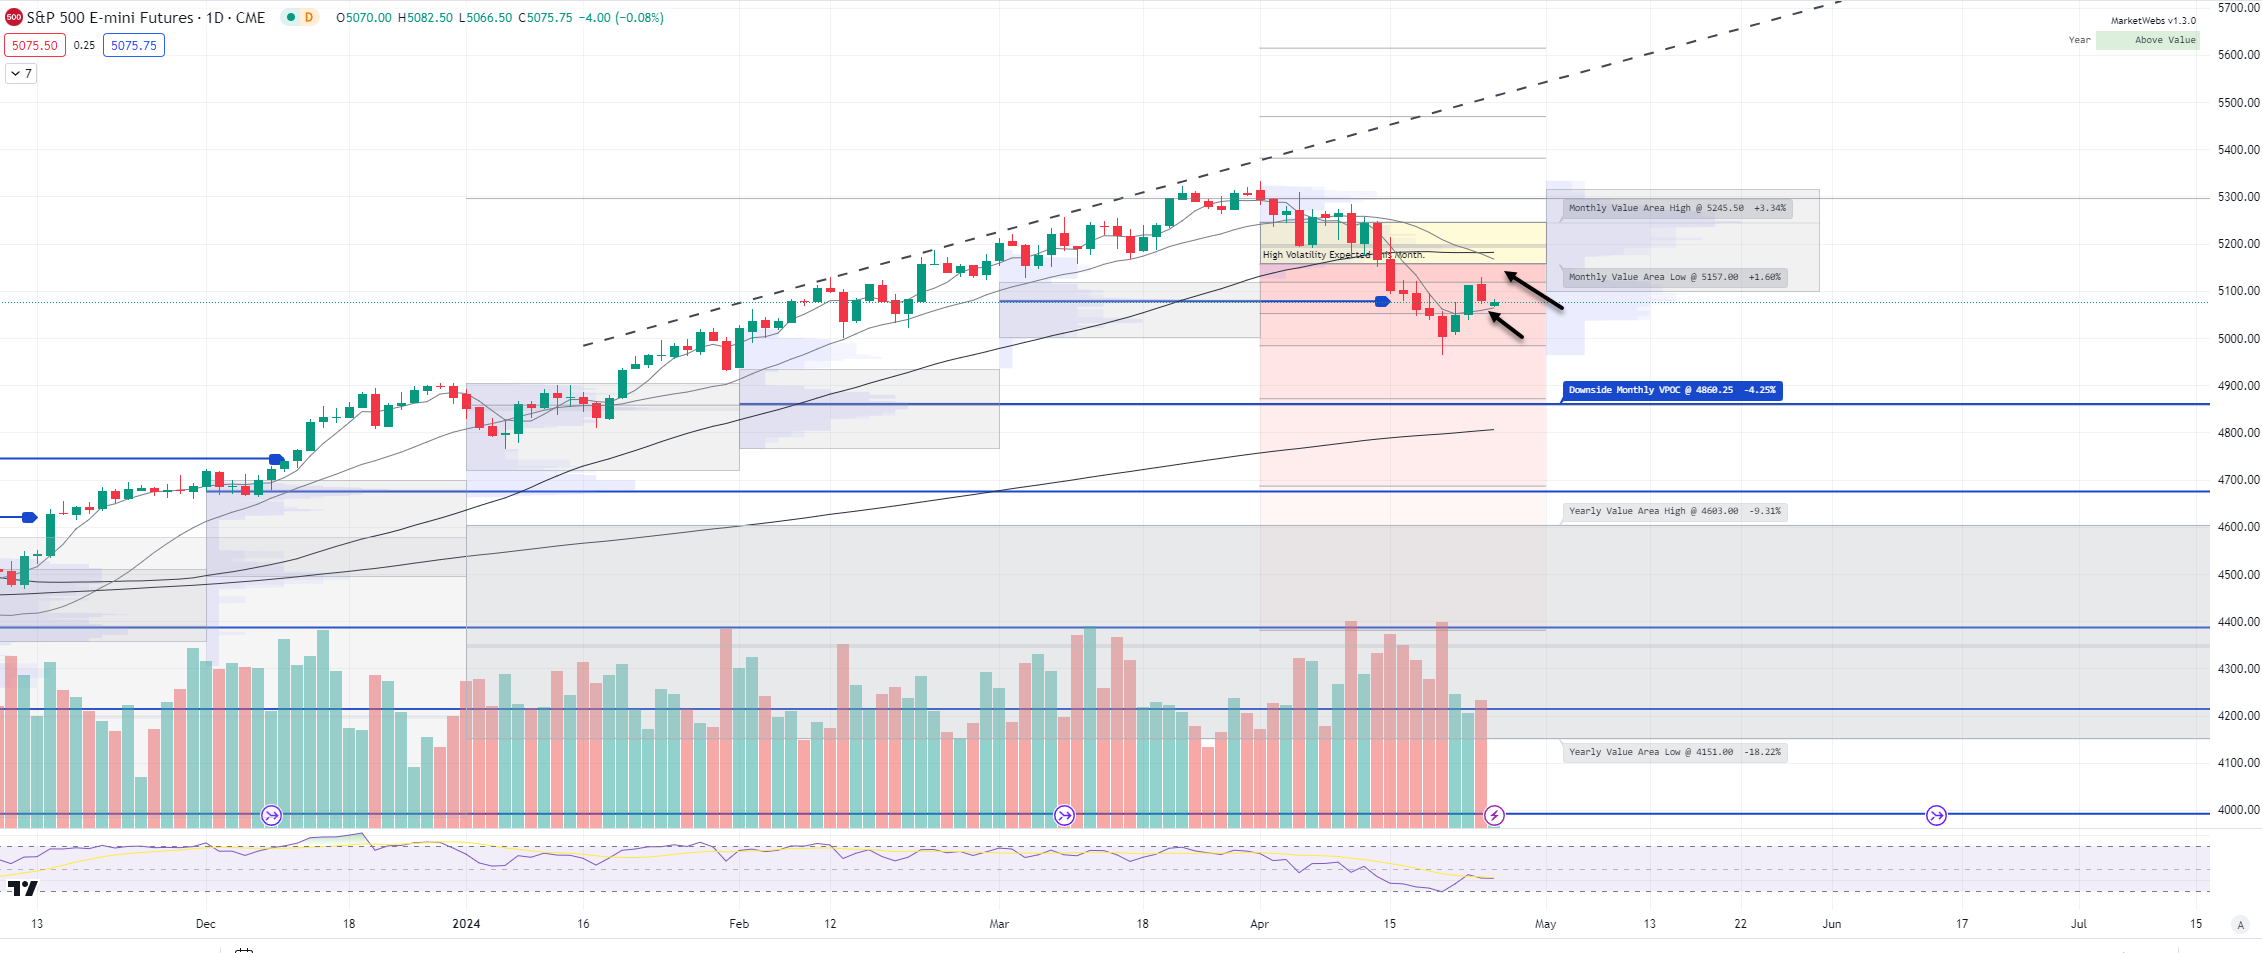
ES_F - SPX Futures - Daily chart: Price ind. -0.7% after weaker than expected earnings reports, i.e. META IBM NOW CAT. I am watching to see if price can maintain above its short-term 5d MA (Moving Average) today
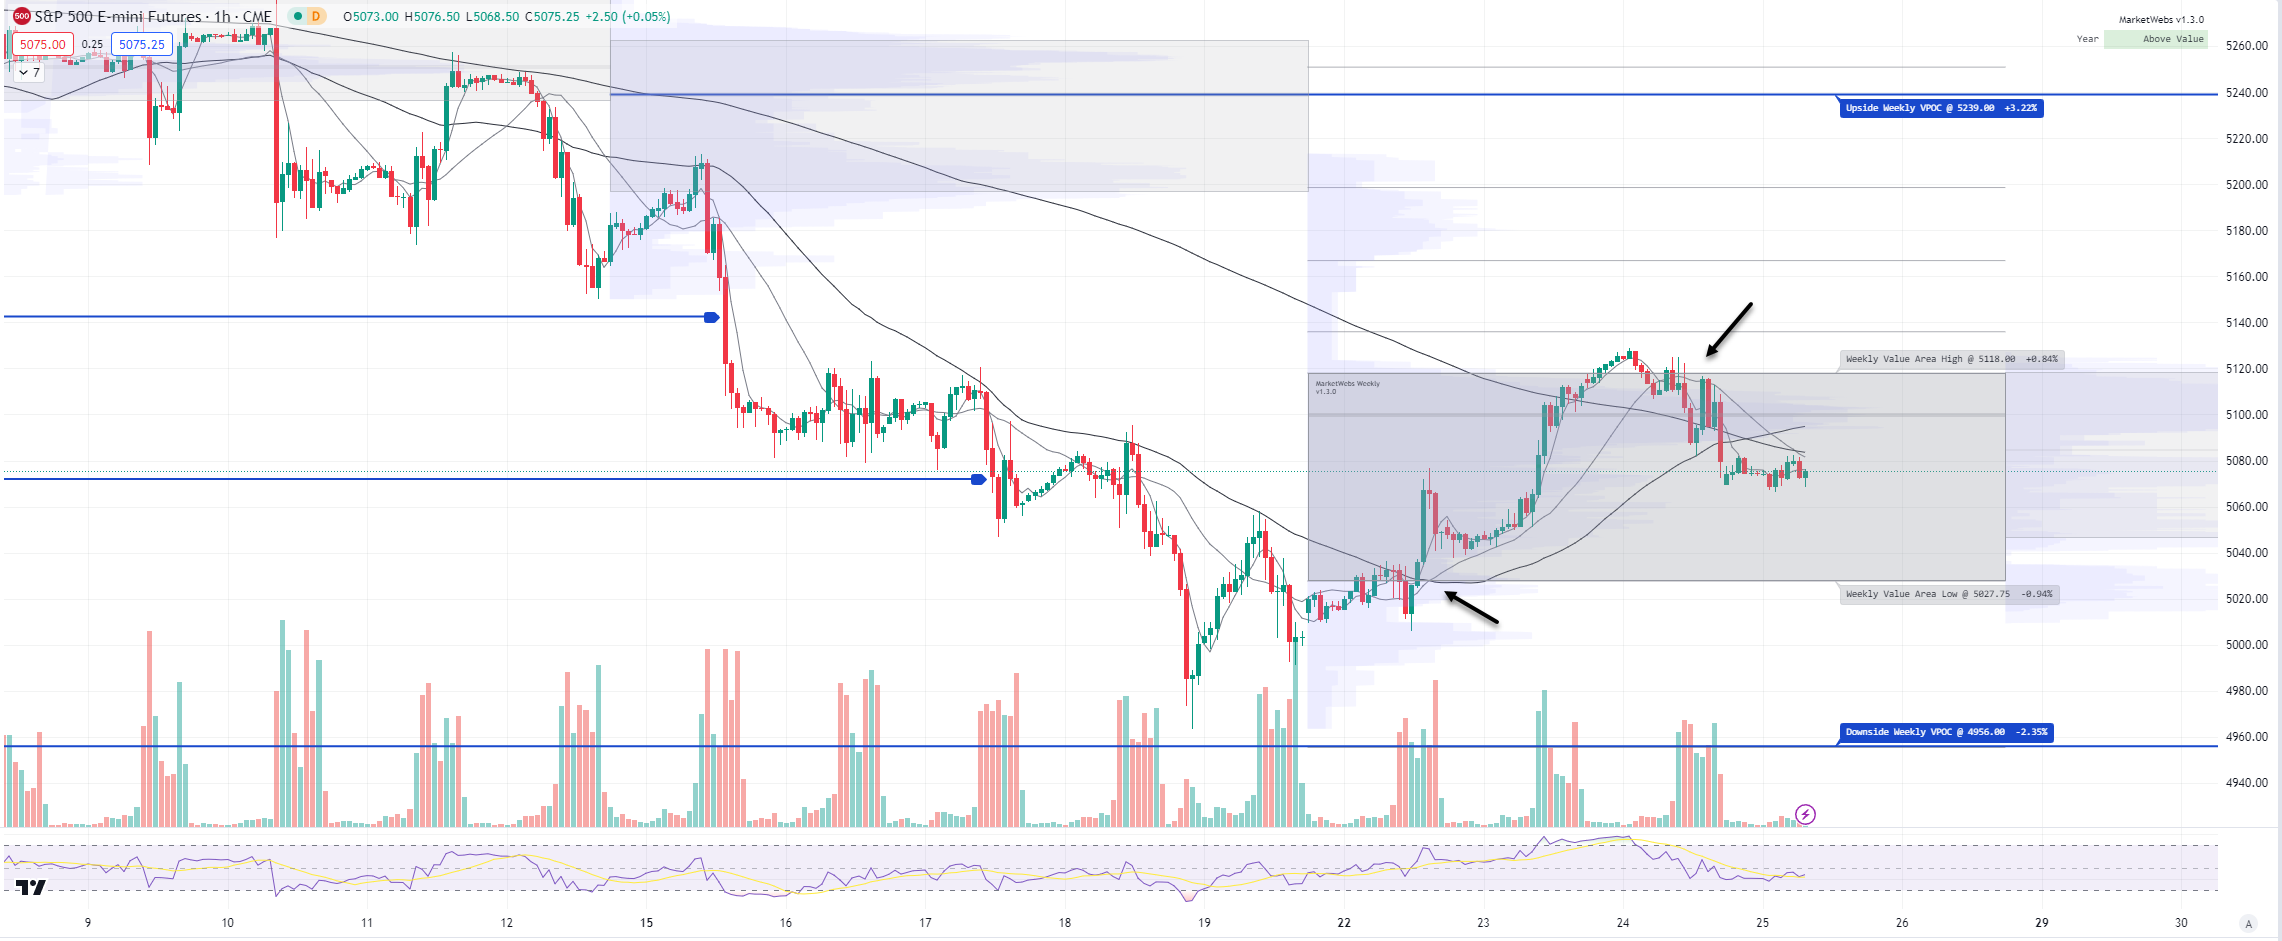
1hr chart: Price was not able to take that next leg higher out of this week's Value Area, resistance to watch 5118 & support back down at 5027.75
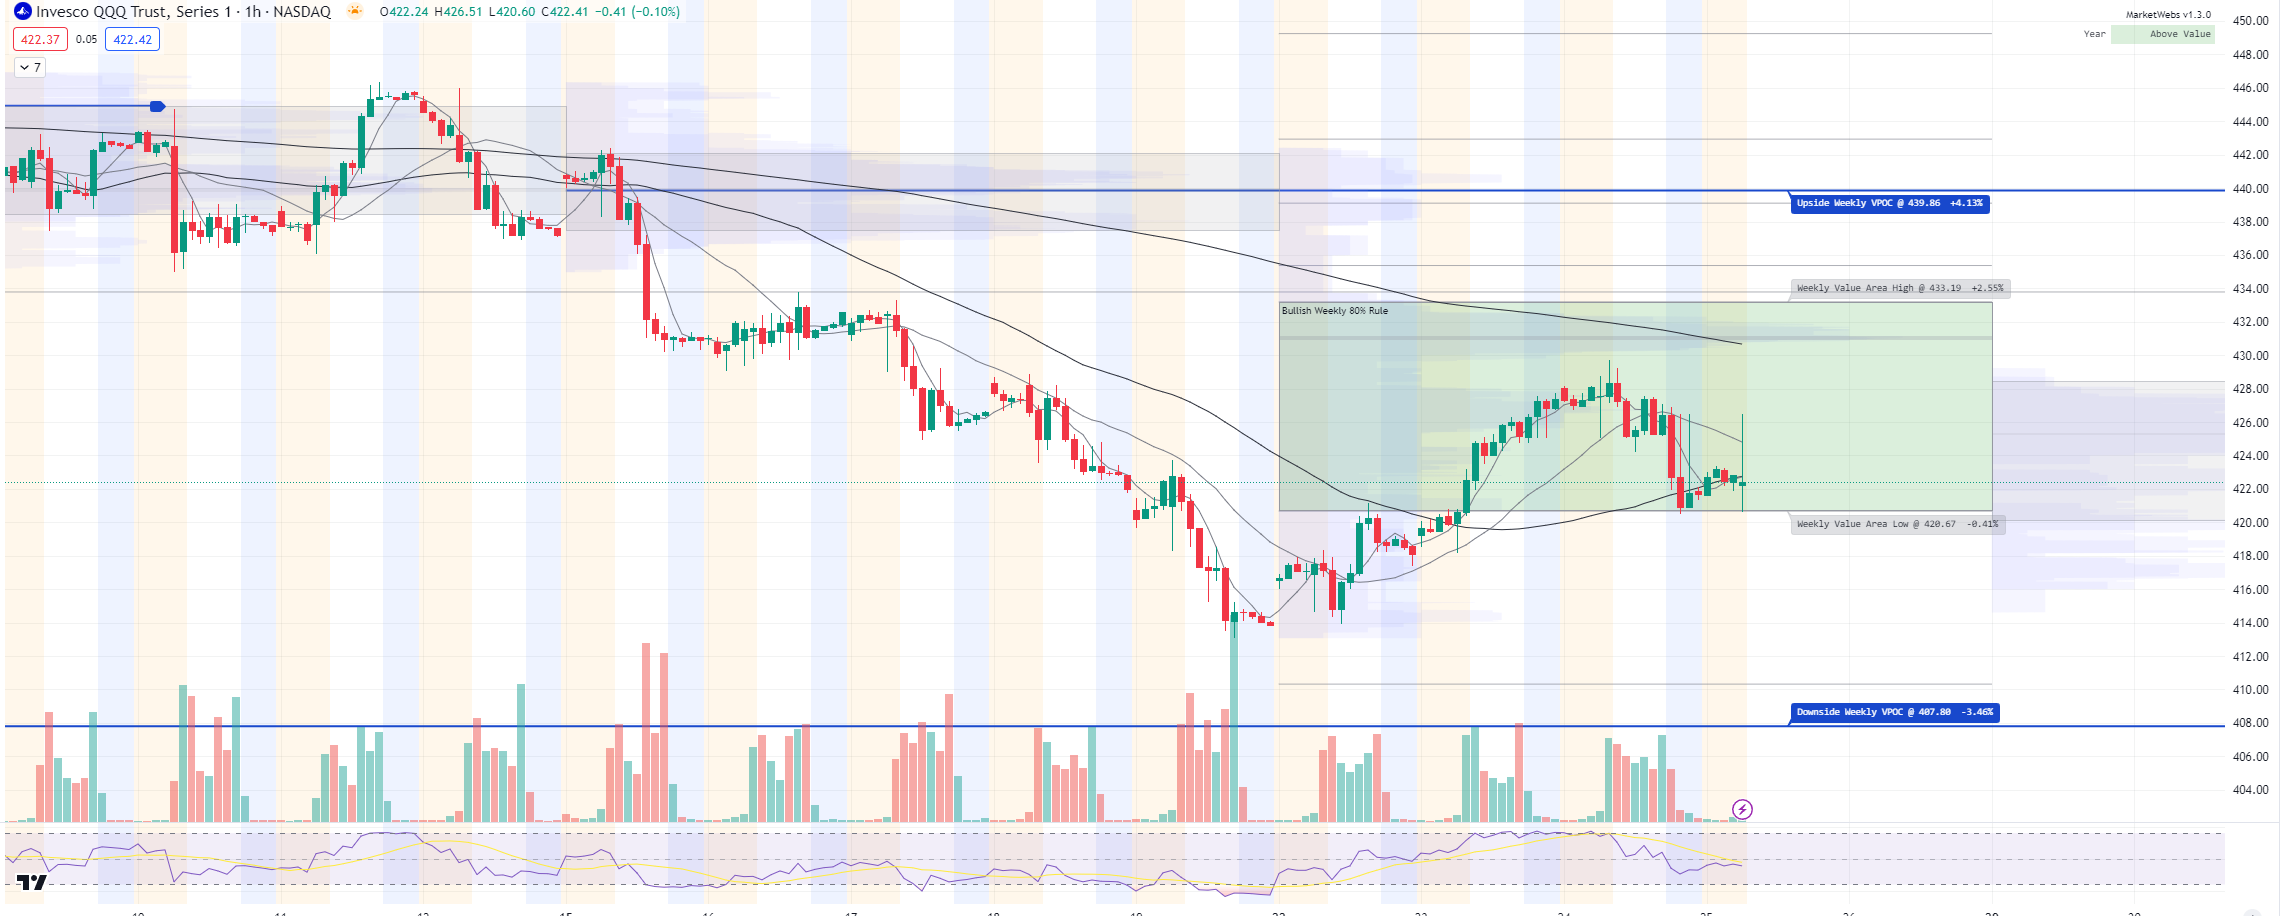
QQQ - NDX 100 ETF - Daily chart: Price ind. -1.0% and I am also watching to see if price can stay above its 5d MA , if not watch for that lower VPOC at $411.82 , but that will depend on the next round of earnings MSFT GOOGL etc

1hr chart: Price moved down to the bottom of its Value Area for the week and bounced, watch support $420.67
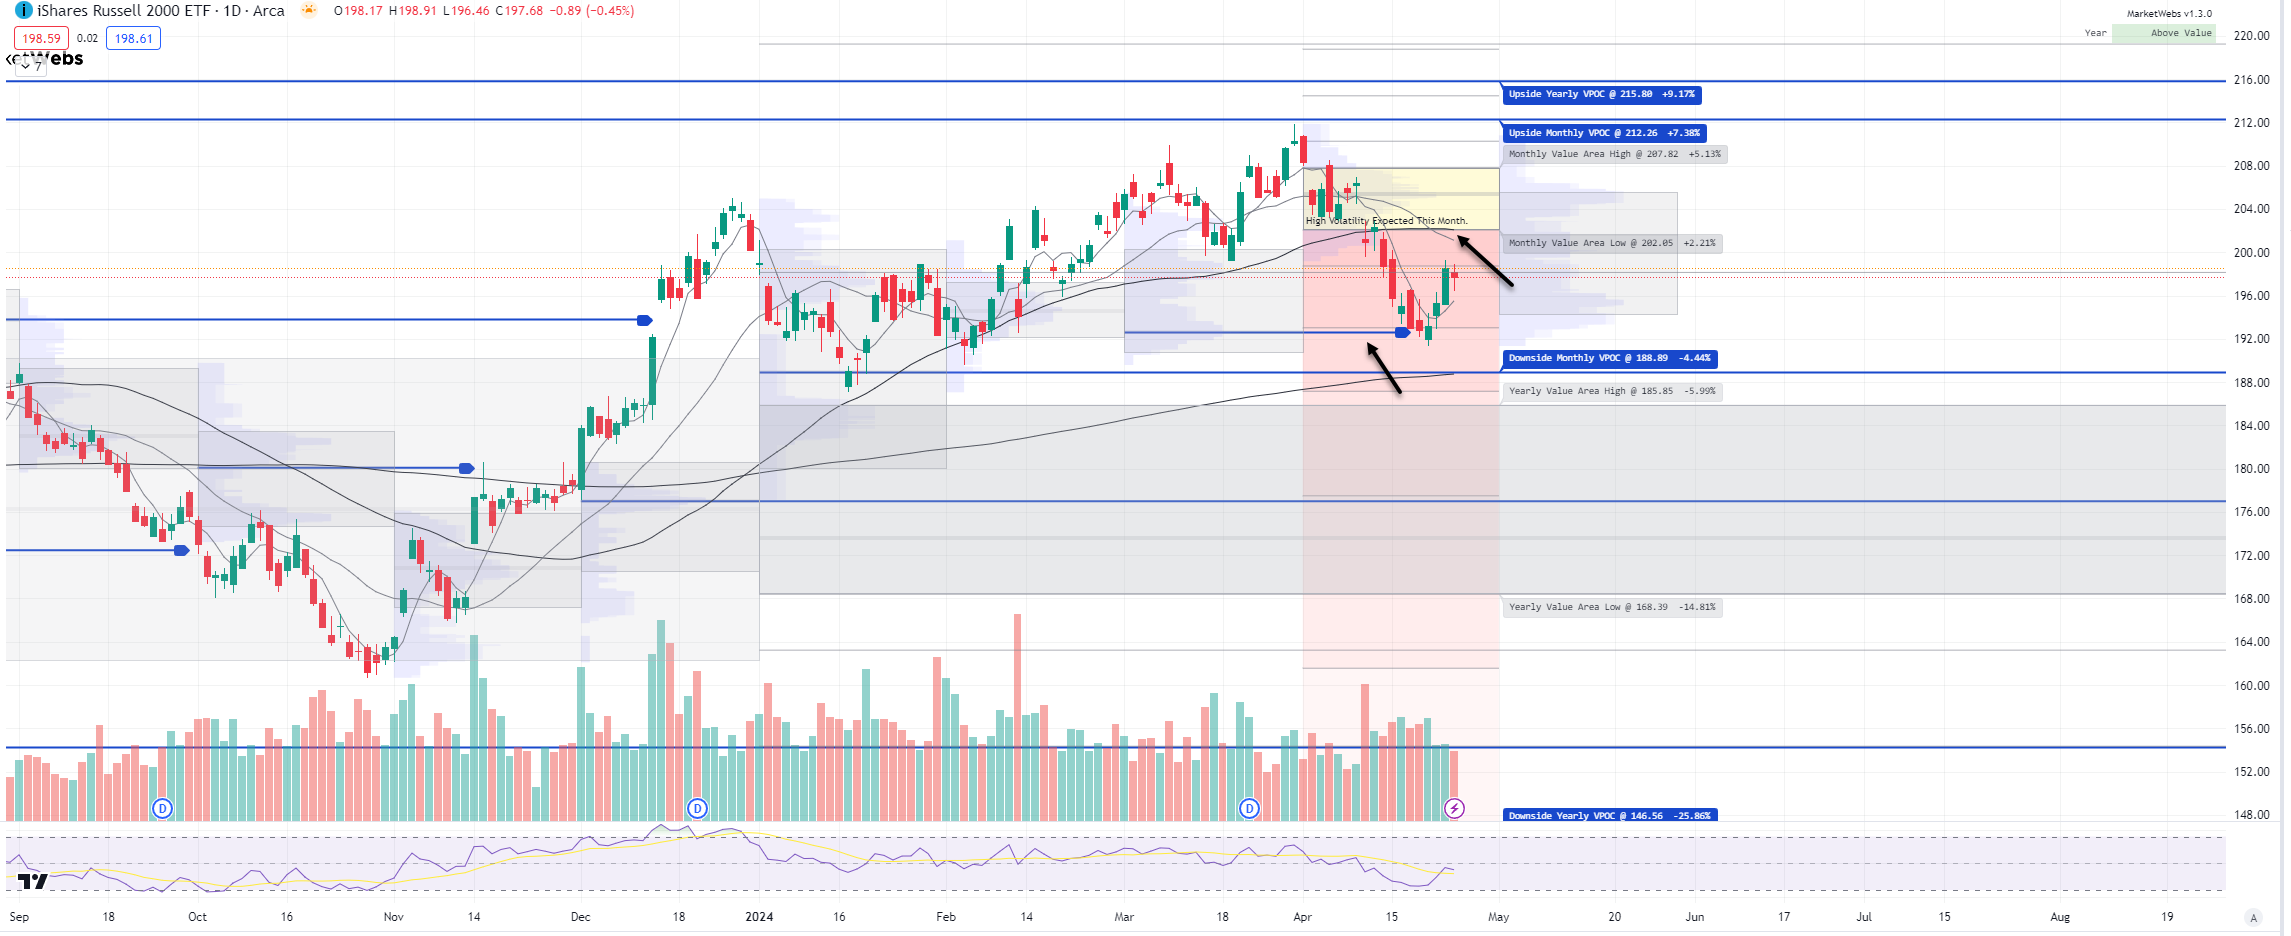
IWM - Russell Small Cap ETF- Daily Chart: Price outperforming this morning indicating some rotation, +0.4%, overhead resistance remains $202.05
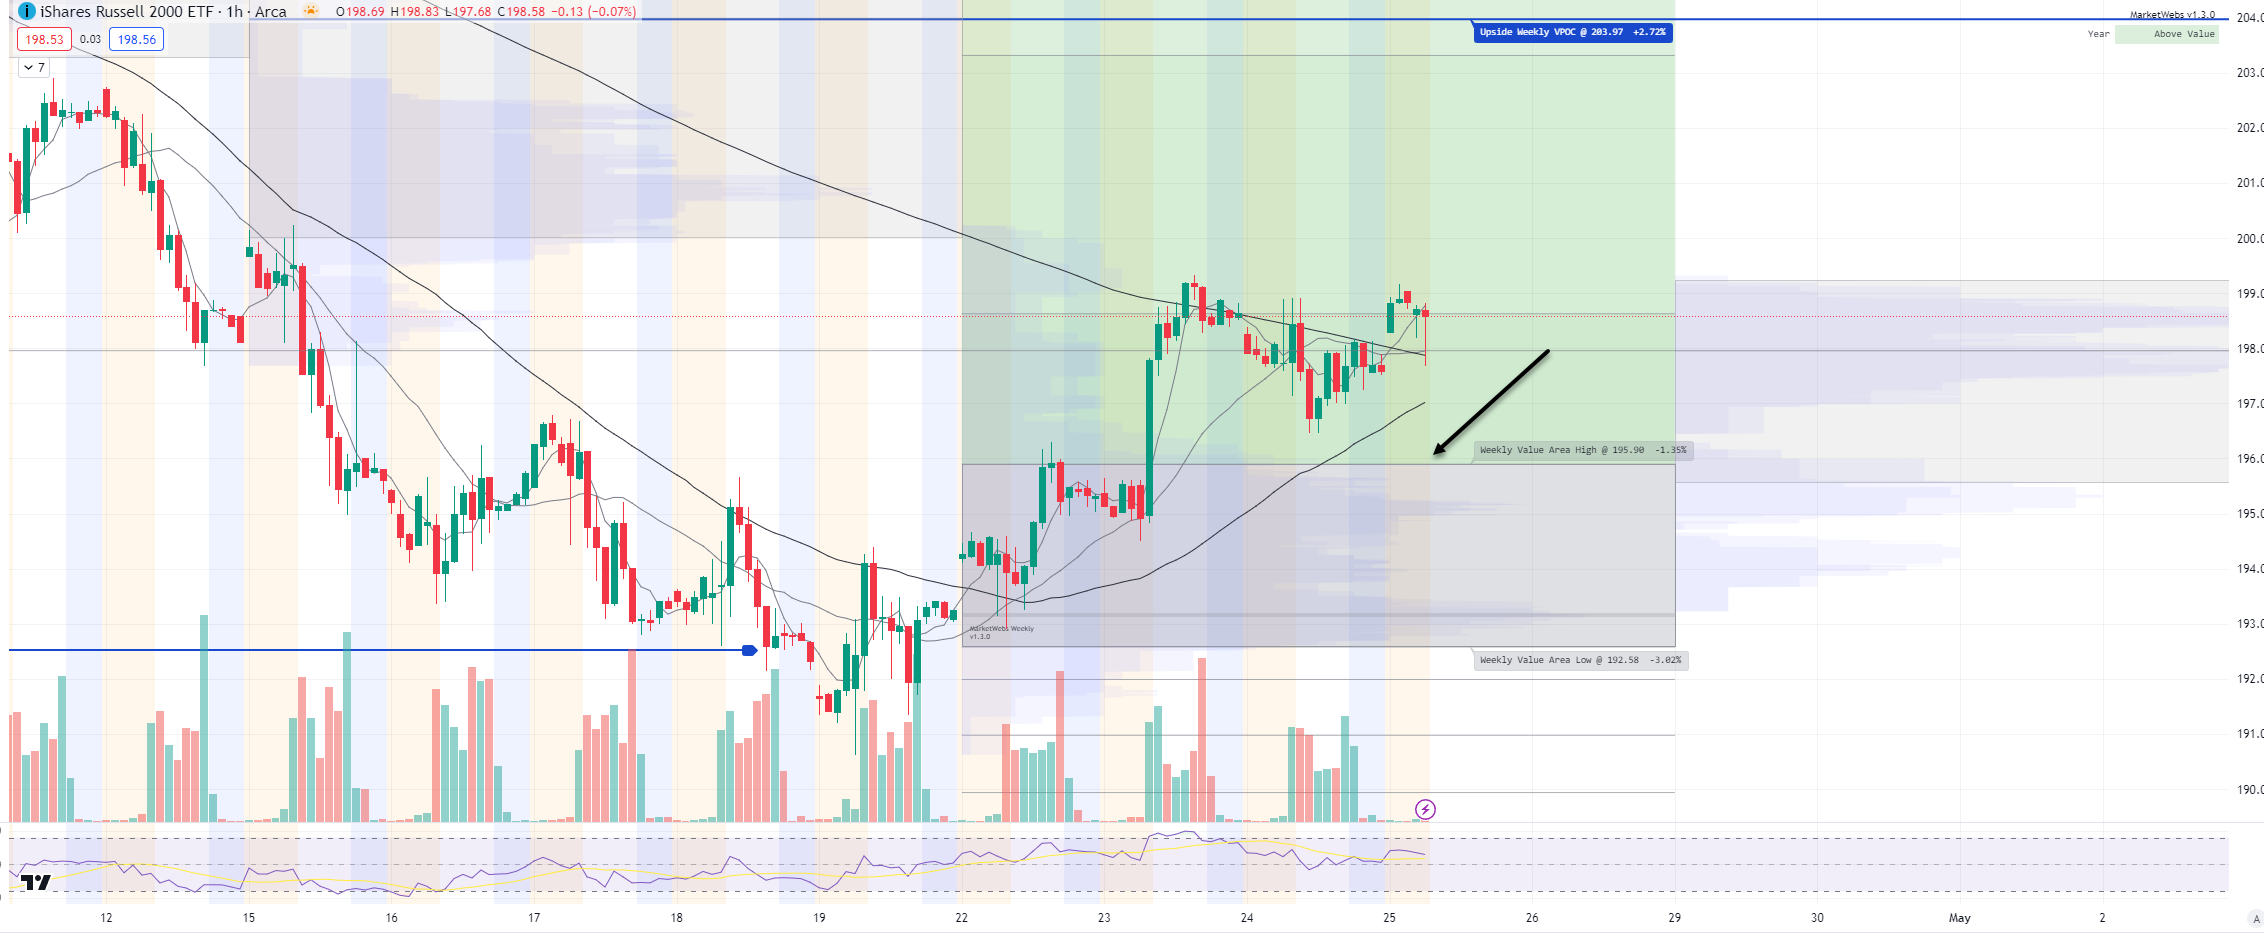
1hr chart: Price above this week's Value Area, support $195.9
Here is today’s TTG Proprietary Stock Screen “Out of the Box” using Volume At Price
names trending above their Value Areas (on 3 multiple timeframes & not super extended)
Keep reading with a 7-day free trial
Subscribe to The Tribeca Trade Group to keep reading this post and get 7 days of free access to the full post archives.