

TTG Index Charts & Out of the Box Stock Screen 01/10/24 $V $MMSI
TTG Index Charts & Out of the Box Stock Screen 01/10/24 $V $MMSI
Out of the Box MarketWebs Screen
US Dollar -0.1% / 30yr Bonds +0.2% / Crude +1.0% & Nat Gas -2.5% / Gold +0.2% / Copper +0.7% / BTC -3.8%
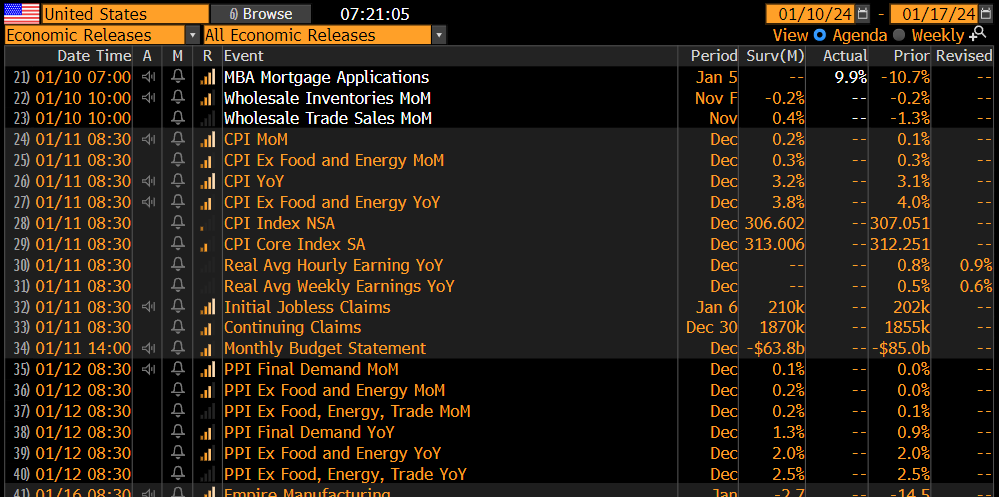
US Upcoming Economics
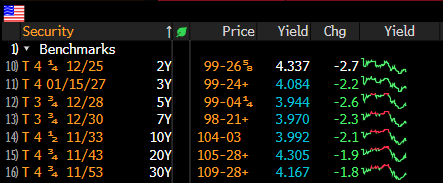
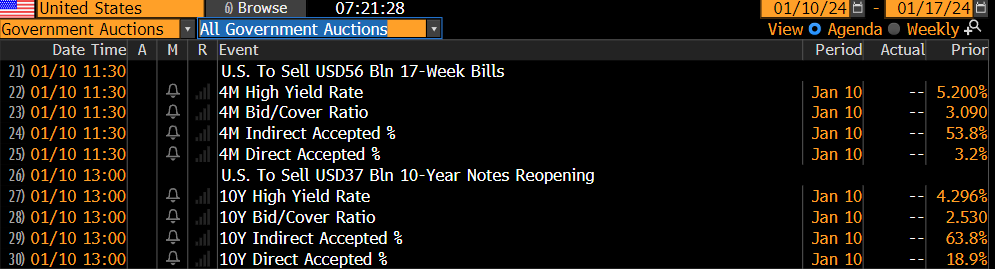
US Bond Yields & Auction Schedule
Index Updates
At TTG, I use Volume At Price in my chart analysis and I use the MarketWebs Indicator to provide Value Areas & VPOCs which indicate significant support & resistance levels. Learn More Here about Volume At Price and the MarketWebs.
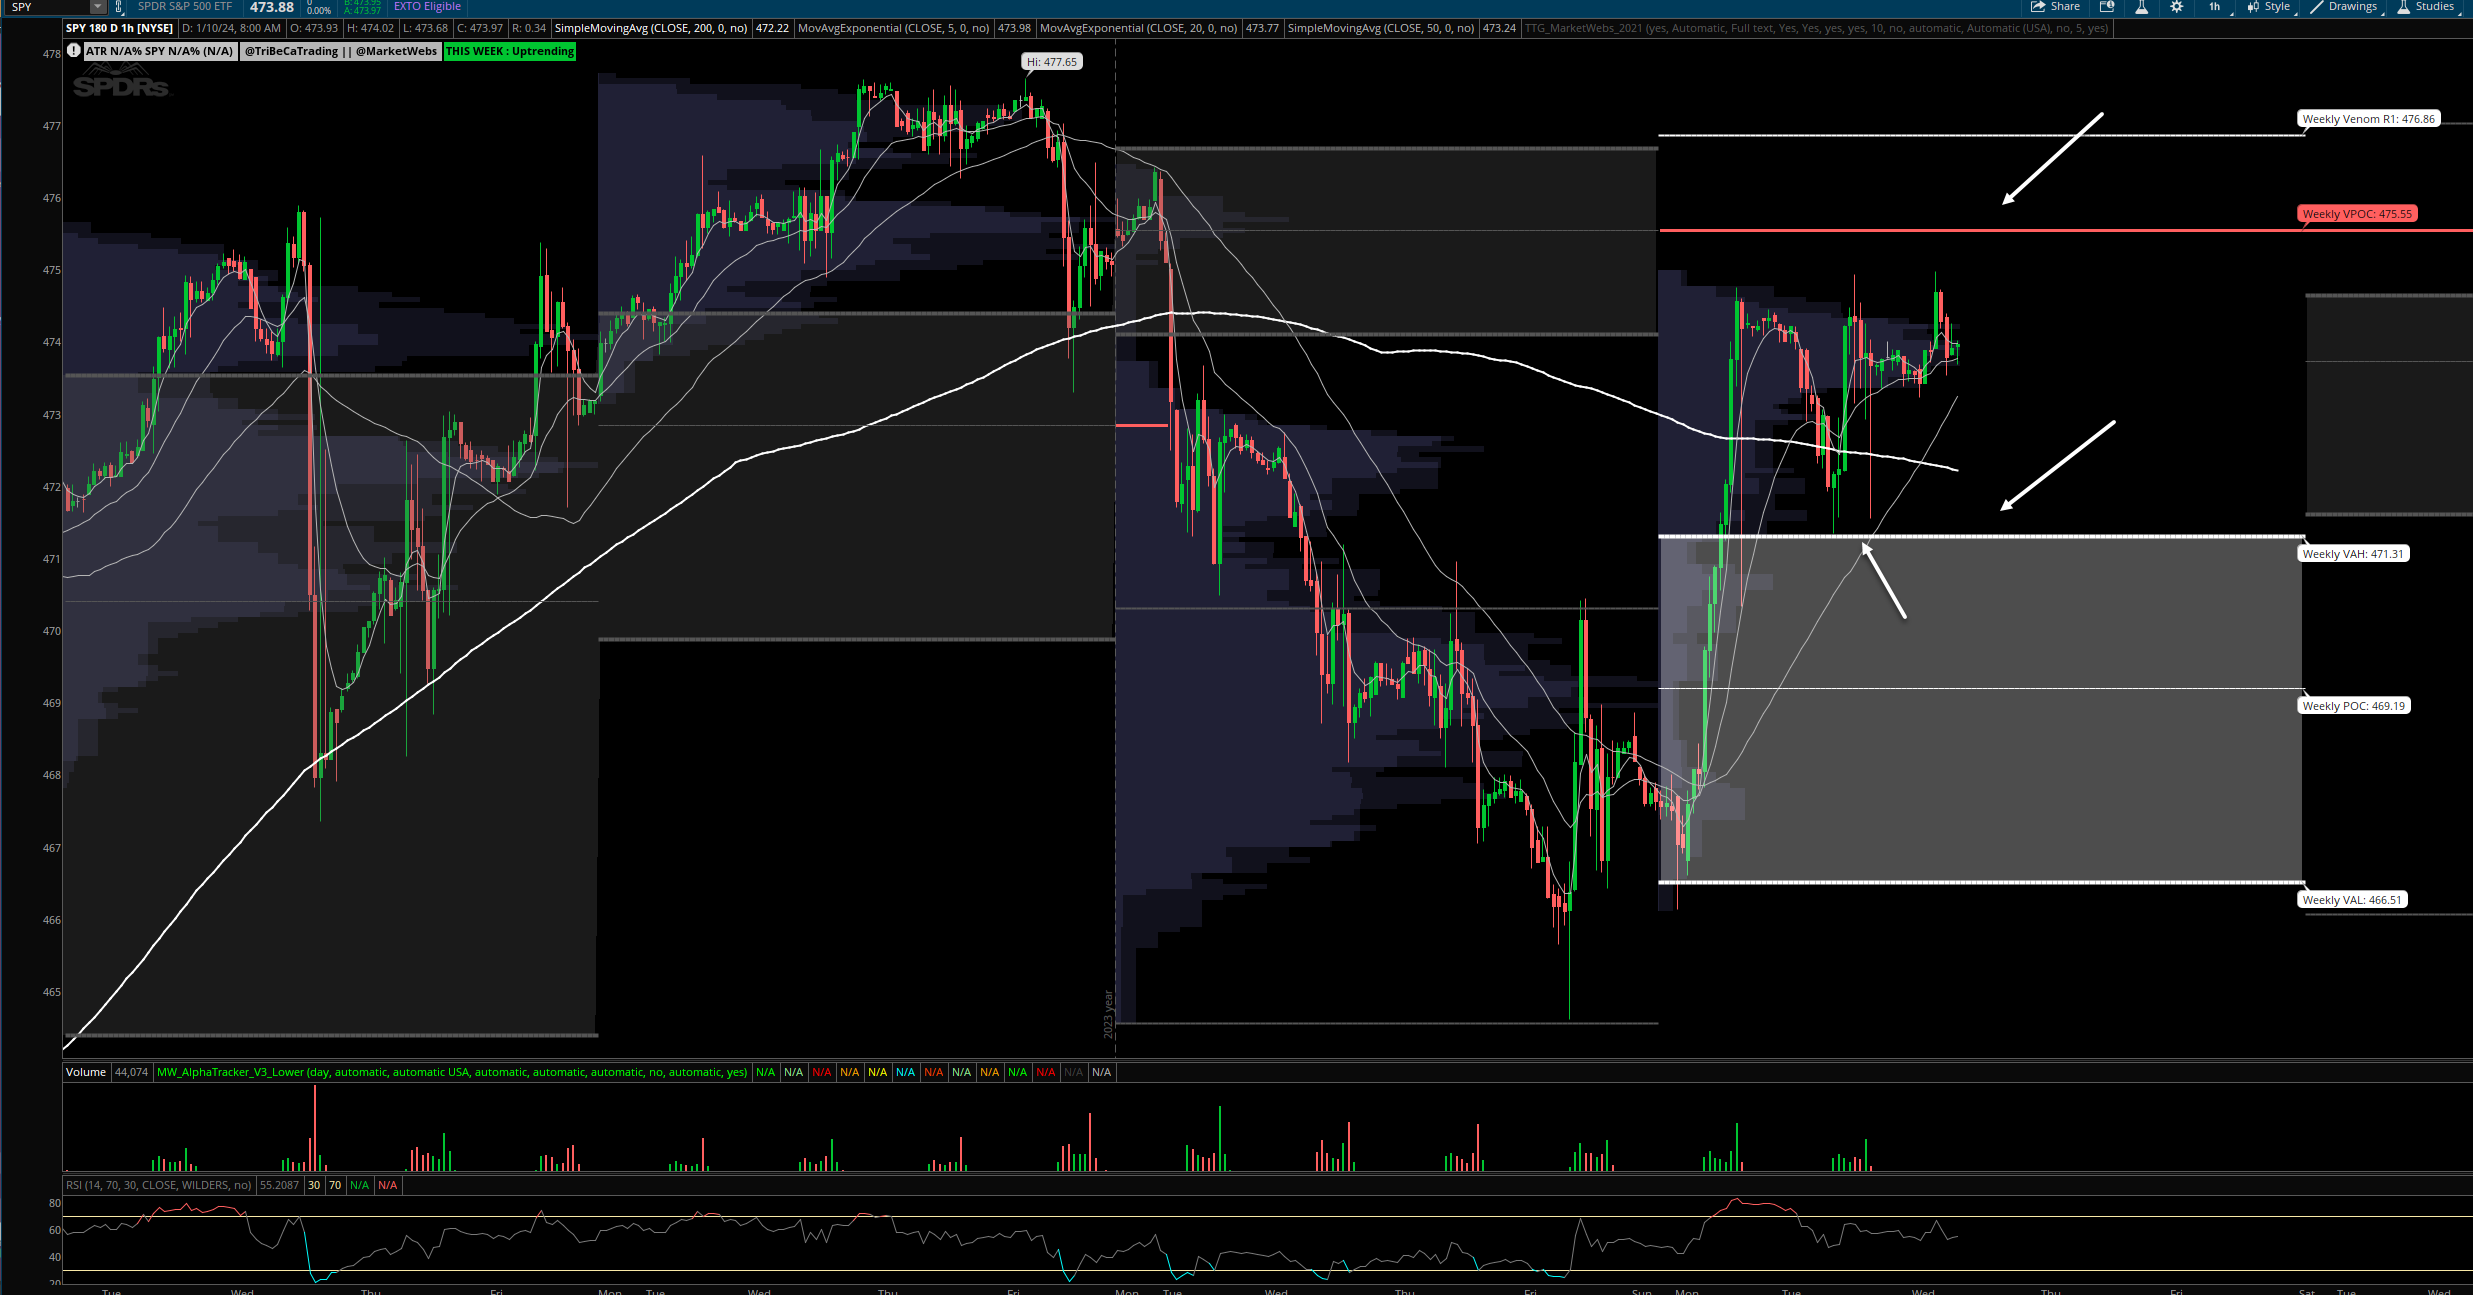
SPY- S&P ETF - Price shook off early weakness yesterday but sill finished a touch lower -0.15% on narrow leadership (poor breadth). The technicals have not changed much.. price is above the short term MAs (Moving Averages) and top of Jan Value rea resistance is $477.4
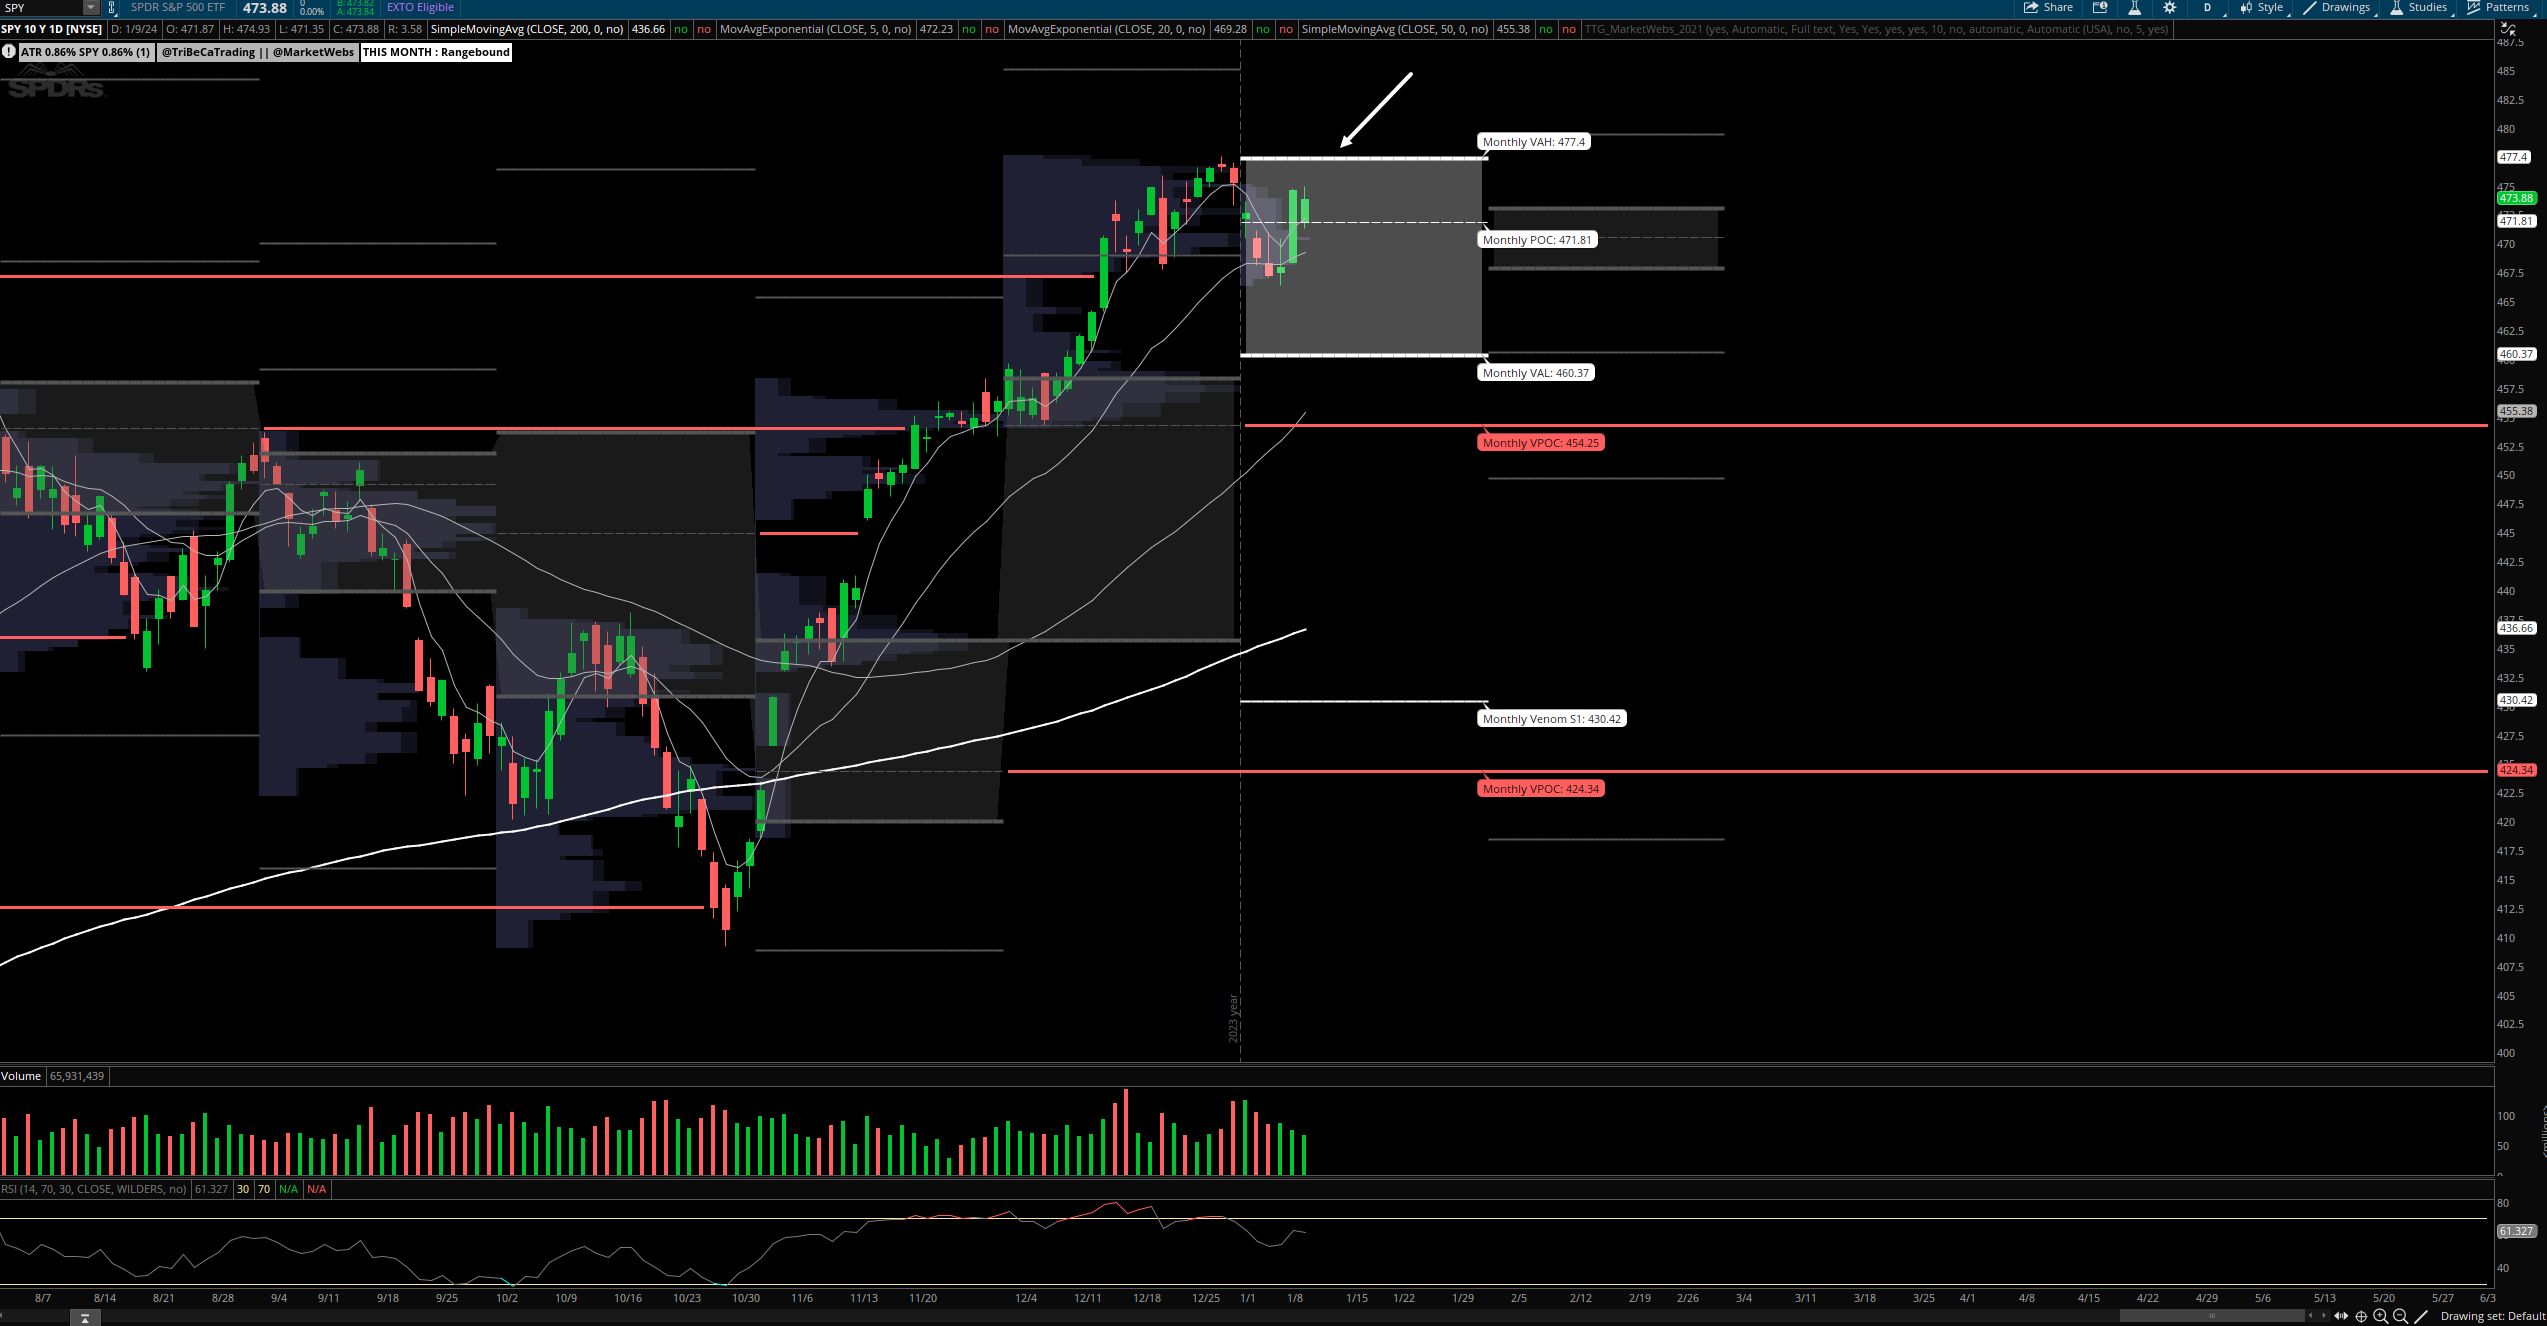
1hr chart: Yesterday, price bounced off the top of Value Area and upside VPOC (red line) to watch is $475.55 and support remains $471.31
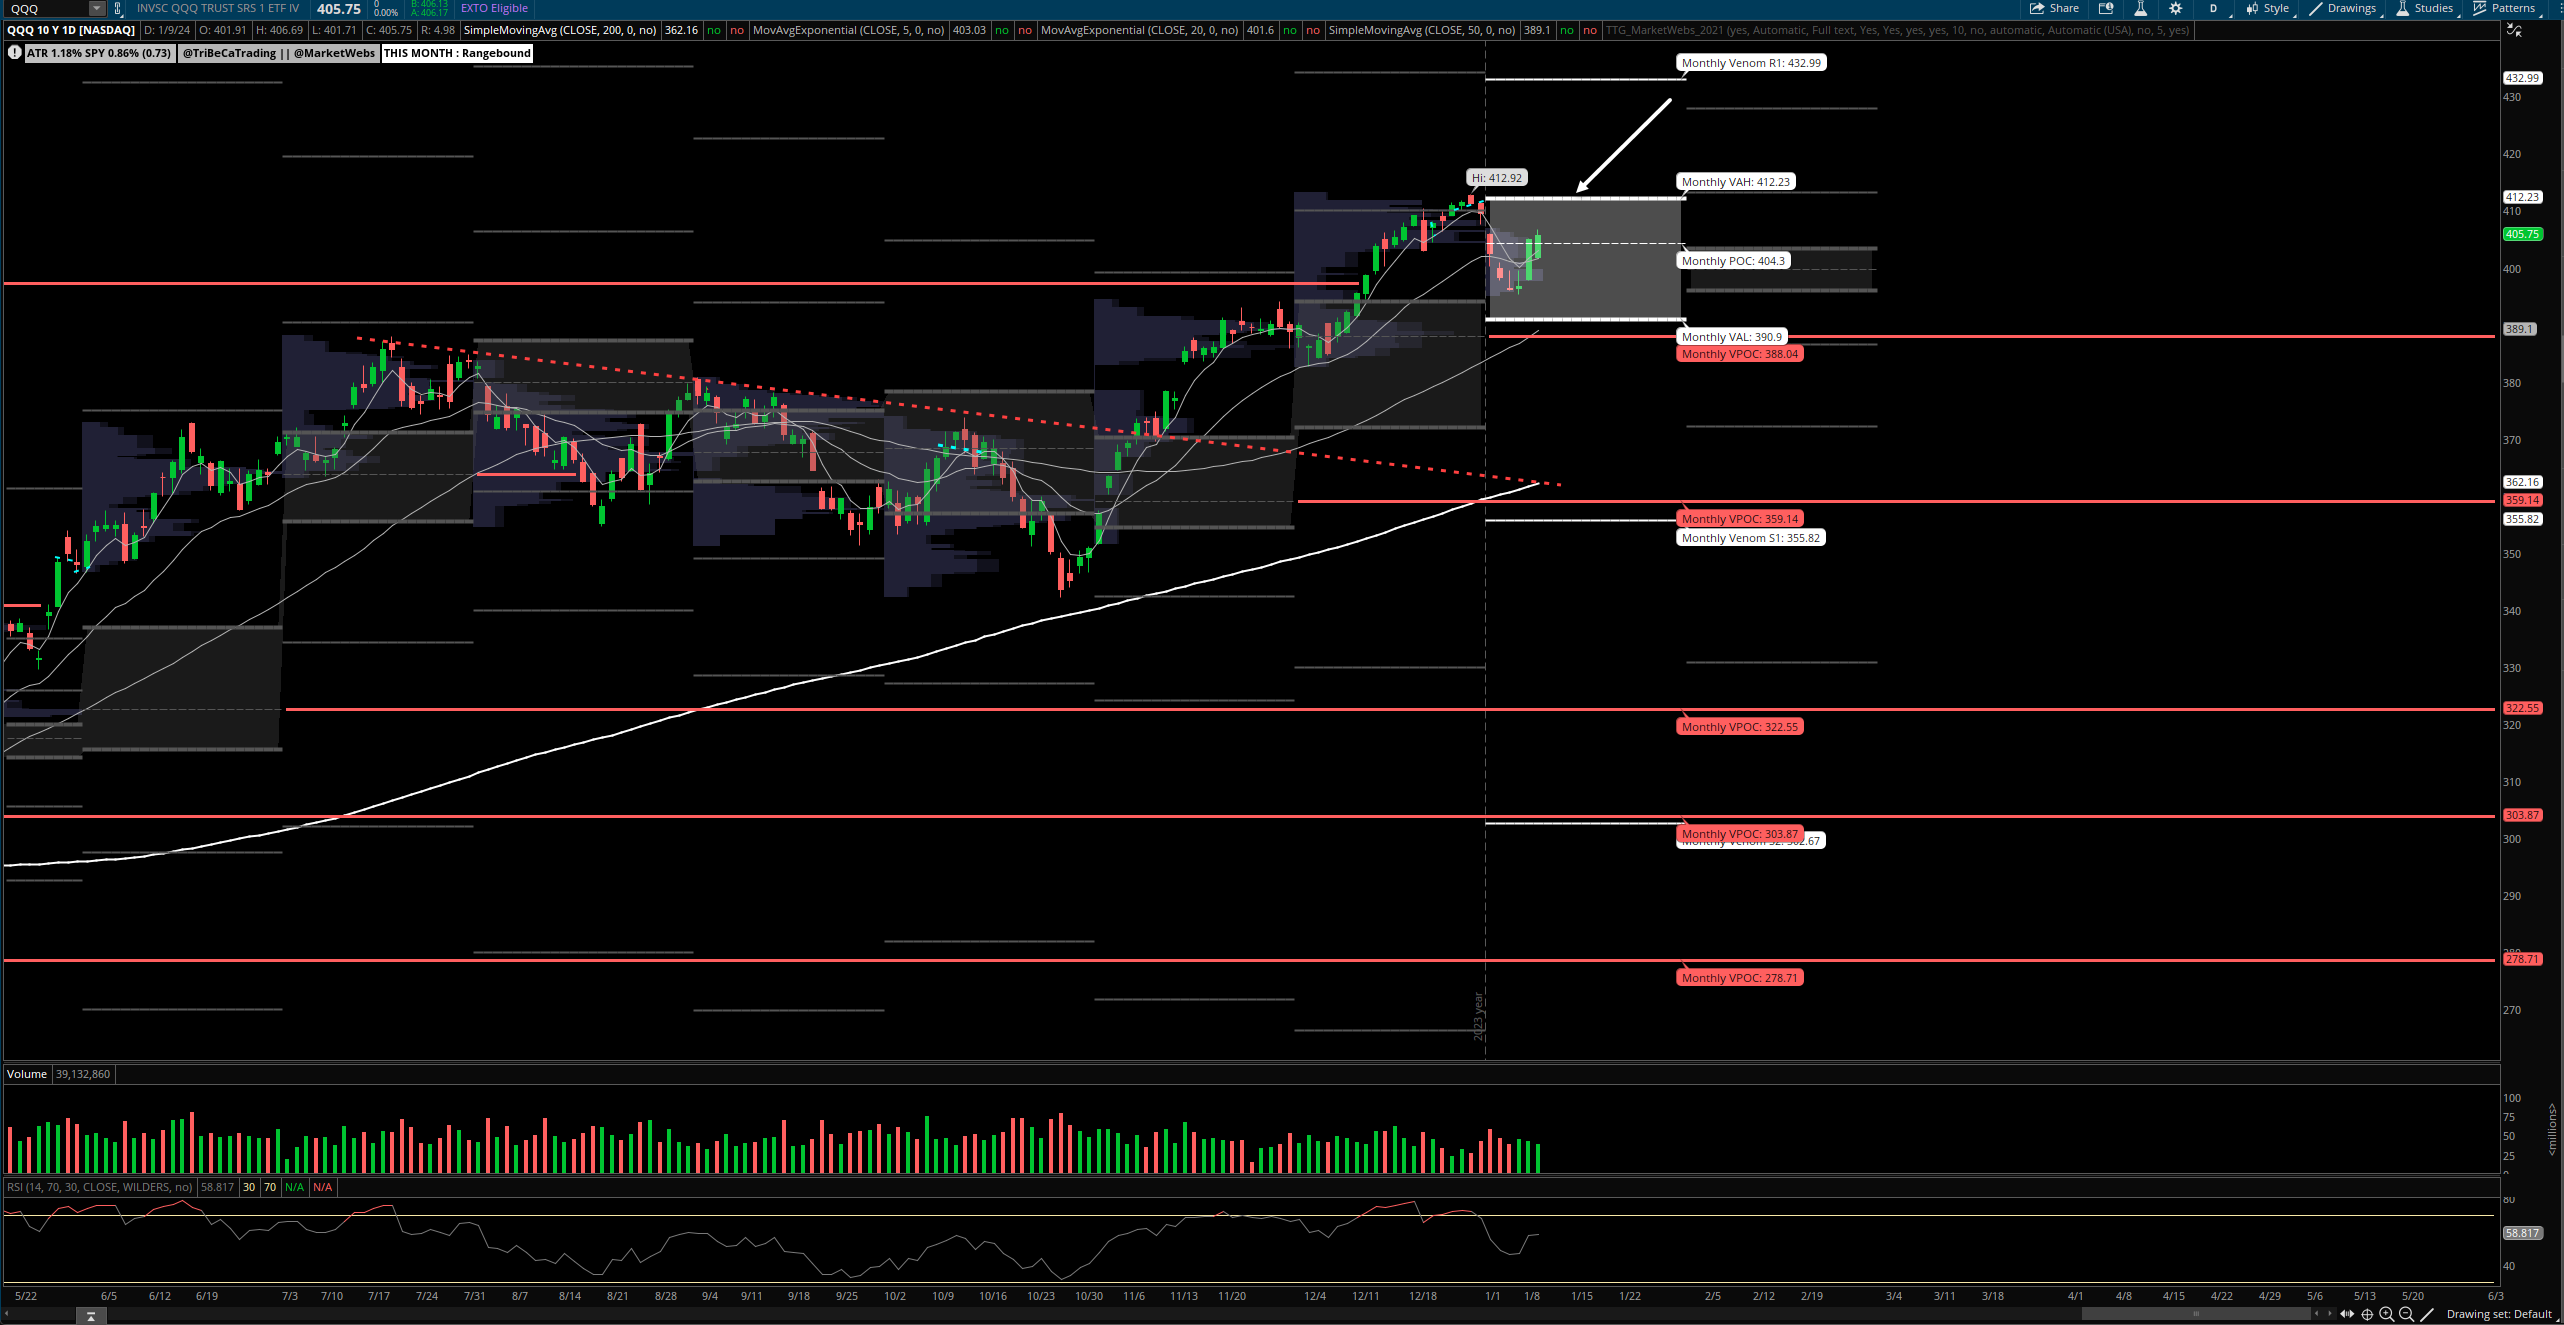
QQQ - NDX 100 ETF - Daily chart: Price outperformed yesterday, and next upside resistance to watch is Jan top of Value Area $412.23
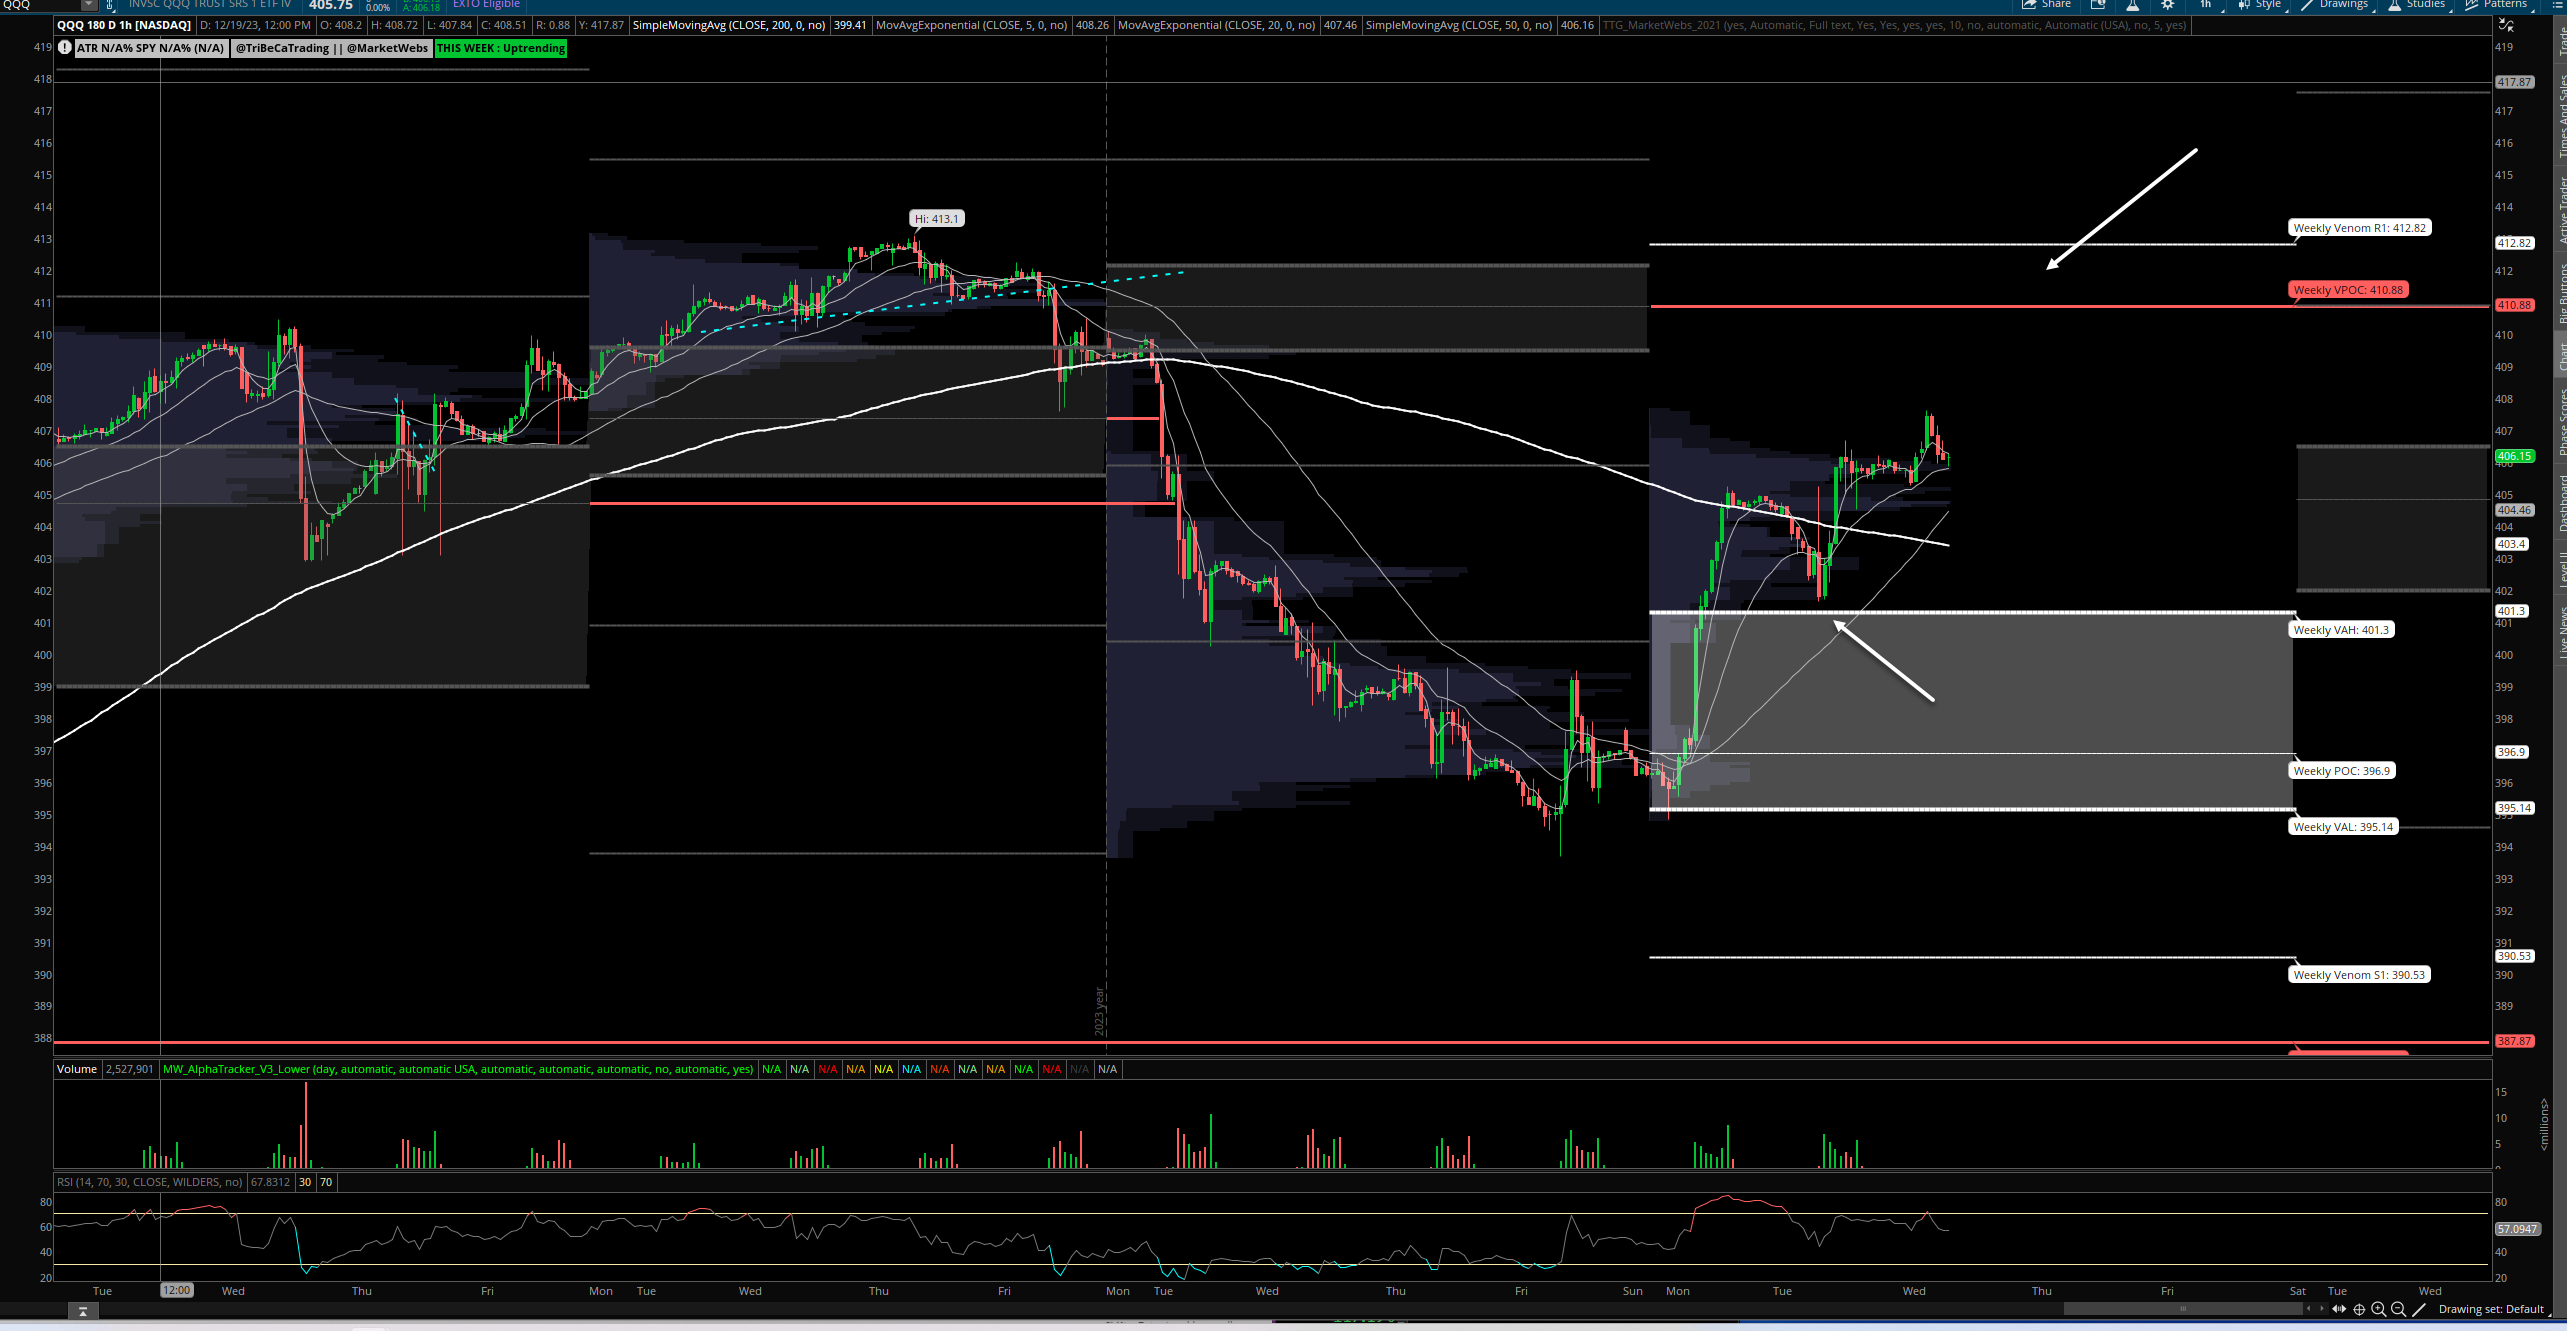
1hr chart: Yesterday, price tested the top of its Value Area for the week & bounced (support $401.3) and next upside level to watch is $410.88 VPOC (red line)
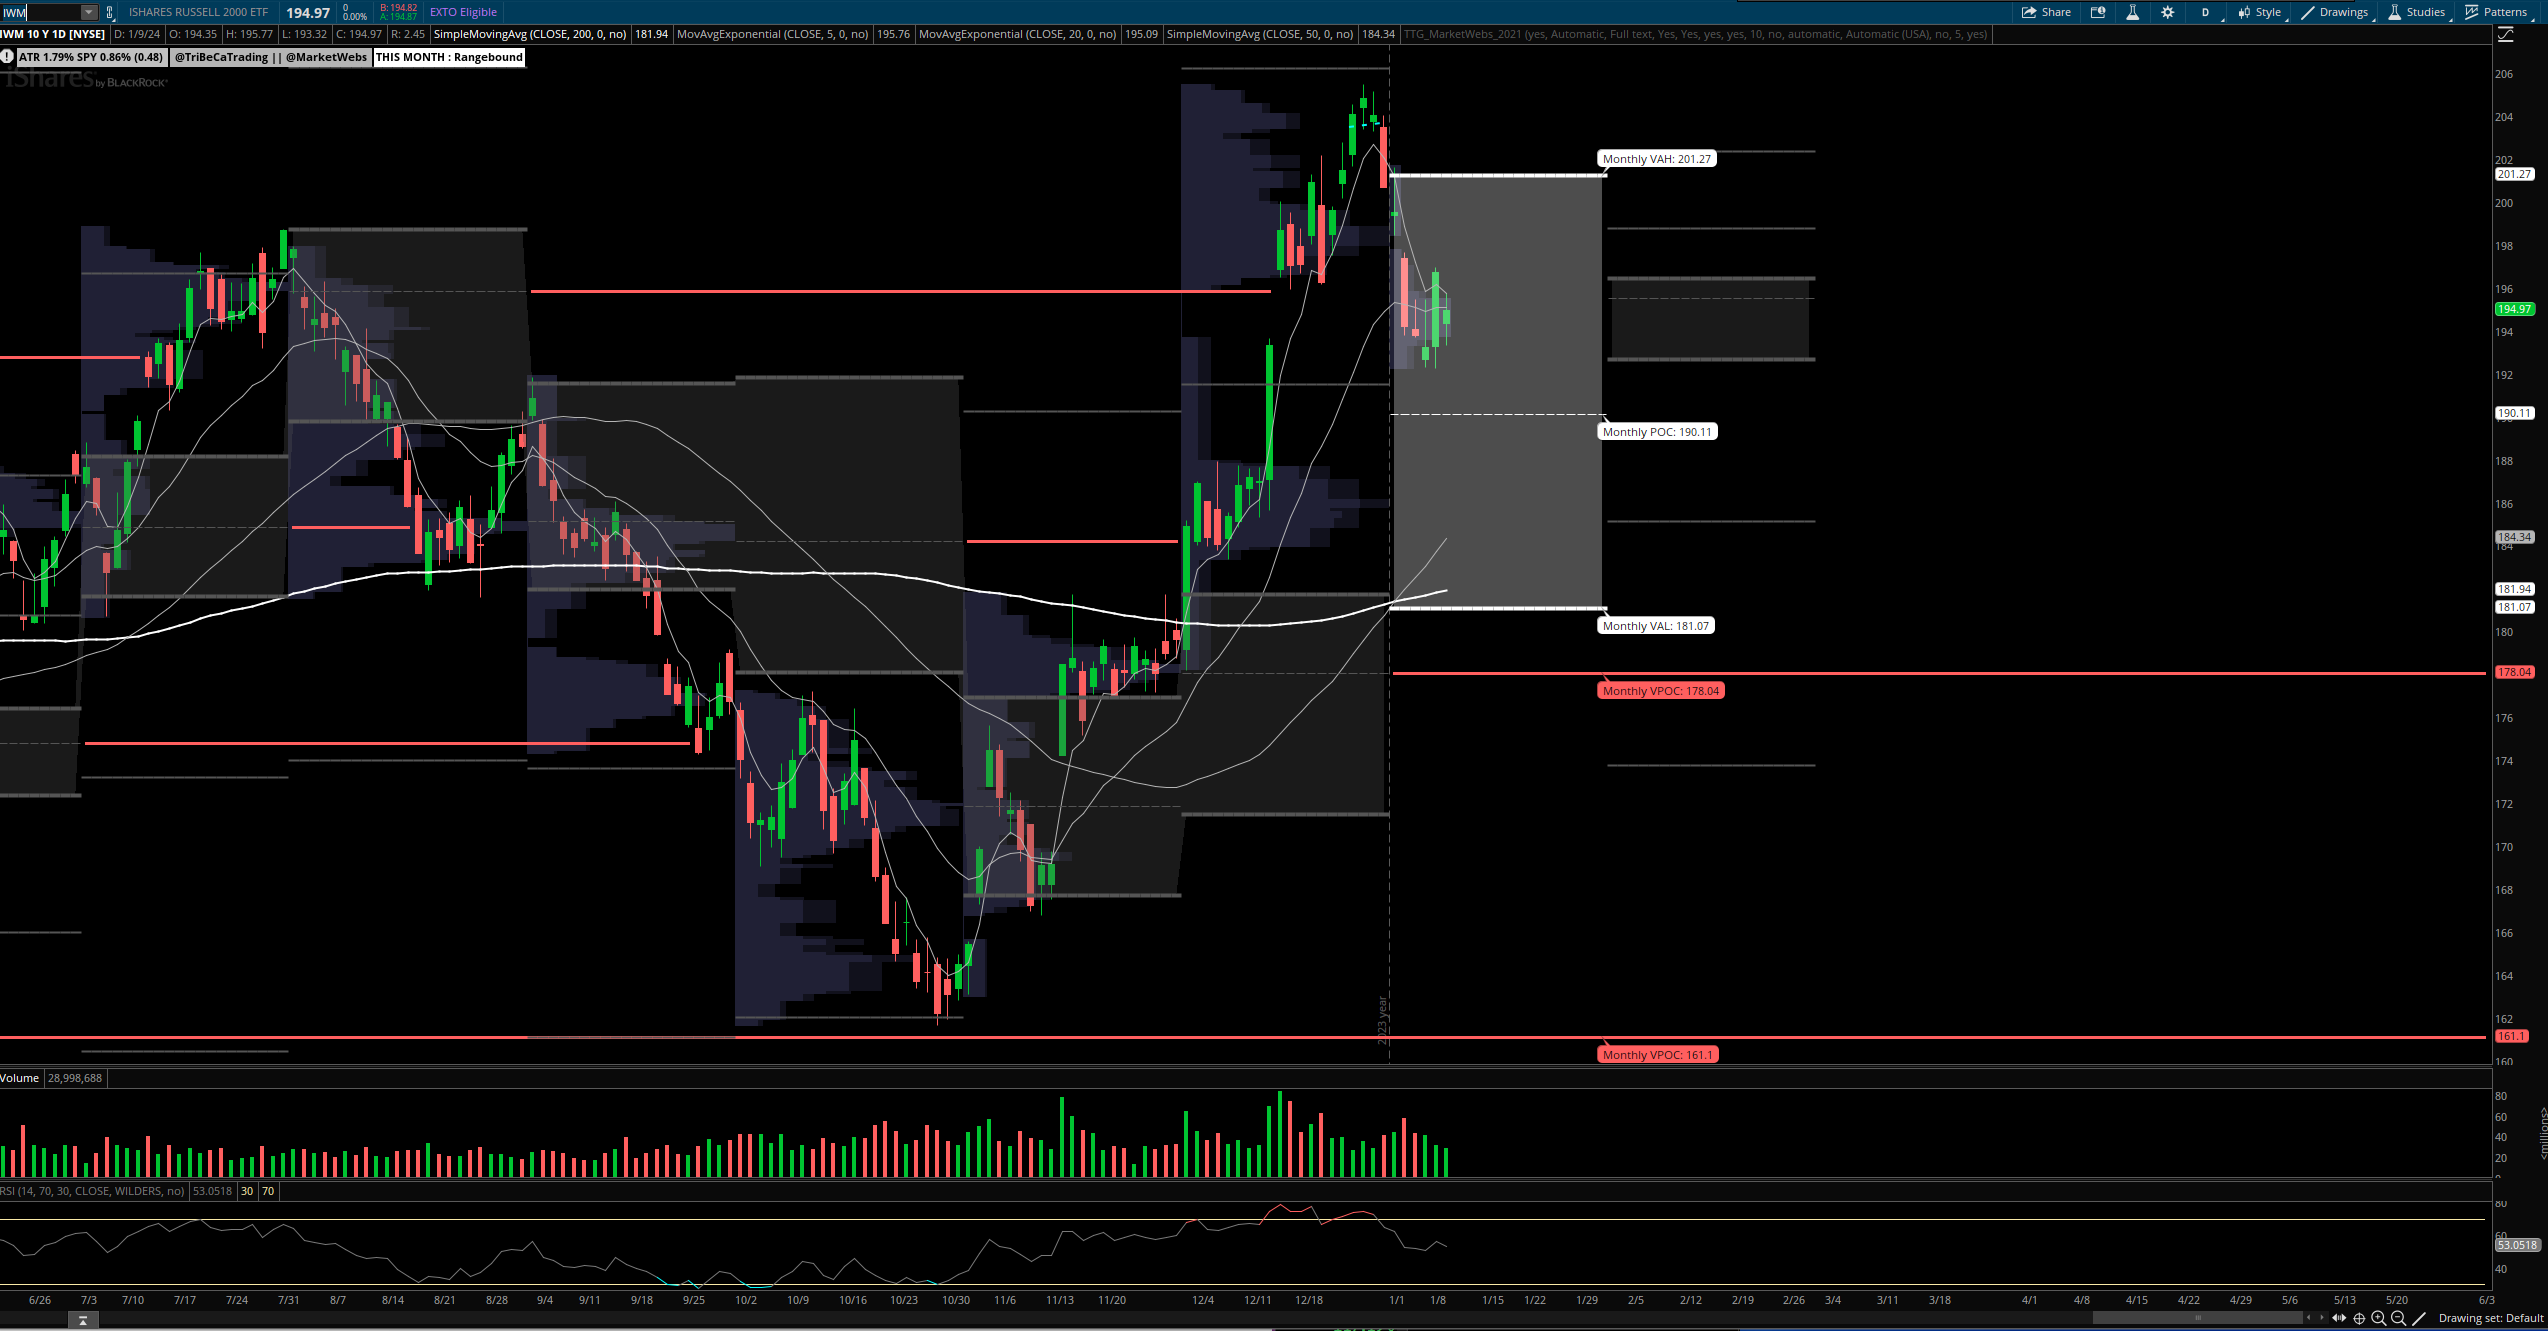
IWM - Russell Small Cap ETF- Daily Chart: Price underperformed yesterday -0.9% and remains right at those short term MAs (5,20d) so will watch to see which way this resolves
1hr chart: Different the SPX & QQQ, price is inside its Value Area for the week indicating some relative weakness , resistance $197.55 & support $191.44

Here is today’s TTG Proprietary Stock Screen “Out of the Box” using Volume At Price
names trending above their Value Areas (on 3 multiple timeframes & not super extended)
Keep reading with a 7-day free trial
Subscribe to The Tribeca Trade Group to keep reading this post and get 7 days of free access to the full post archives.