

TTG Index Charts & Out of the Box Stock Screen 2/15/24 $NOW
TTG Index Charts & Out of the Box Stock Screen 2/15/24 $NOW
Out of the Box MarketWebs Screen
US Dollar -0.2% / 30yr Bonds +0.5% / Crude -0.2% & Nat Gas +2.0% / Gold +0.3% / Copper +0.7% / BTC +1.0%
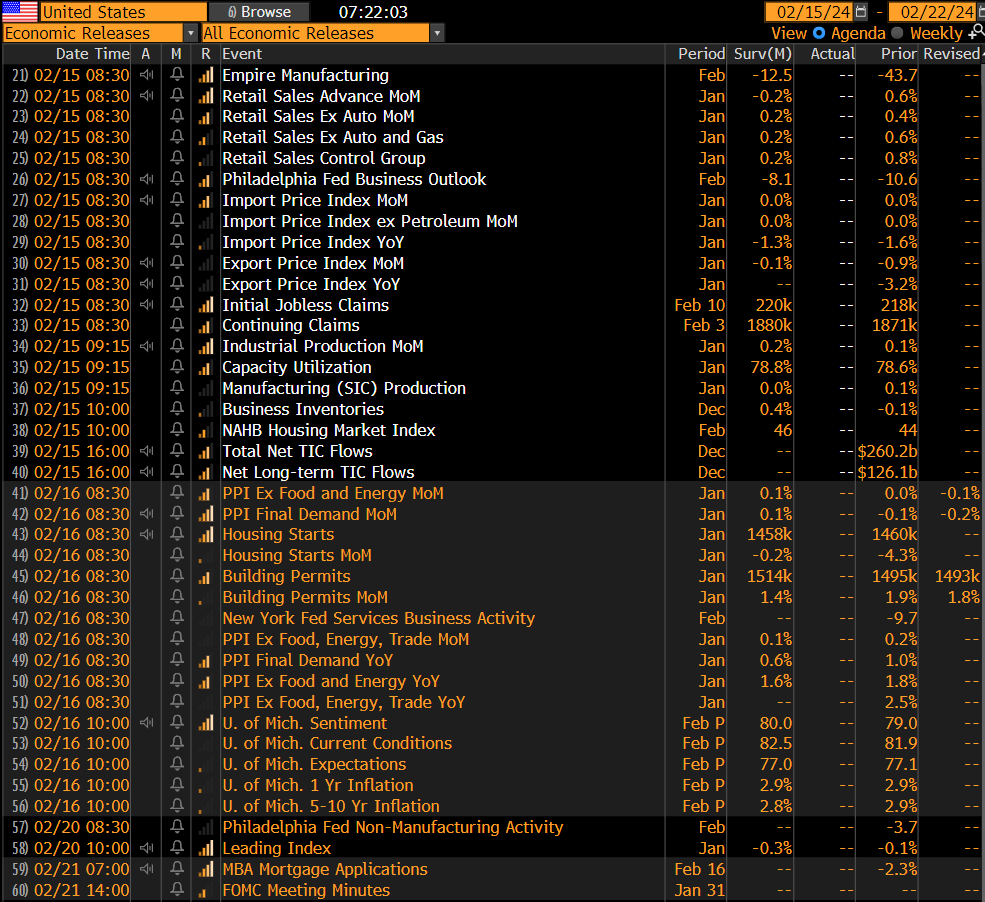
US Upcoming Economics
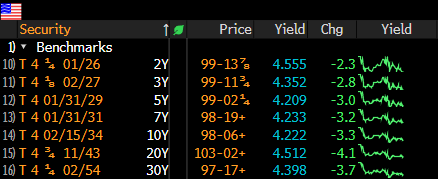
US Bond Yields
Index Updates
At TTG, I use Volume At Price in my chart analysis and I use the MarketWebs Indicator to provide Value Areas & VPOCs which indicate significant support & resistance levels. Learn More Here about Volume At Price and the MarketWebs.
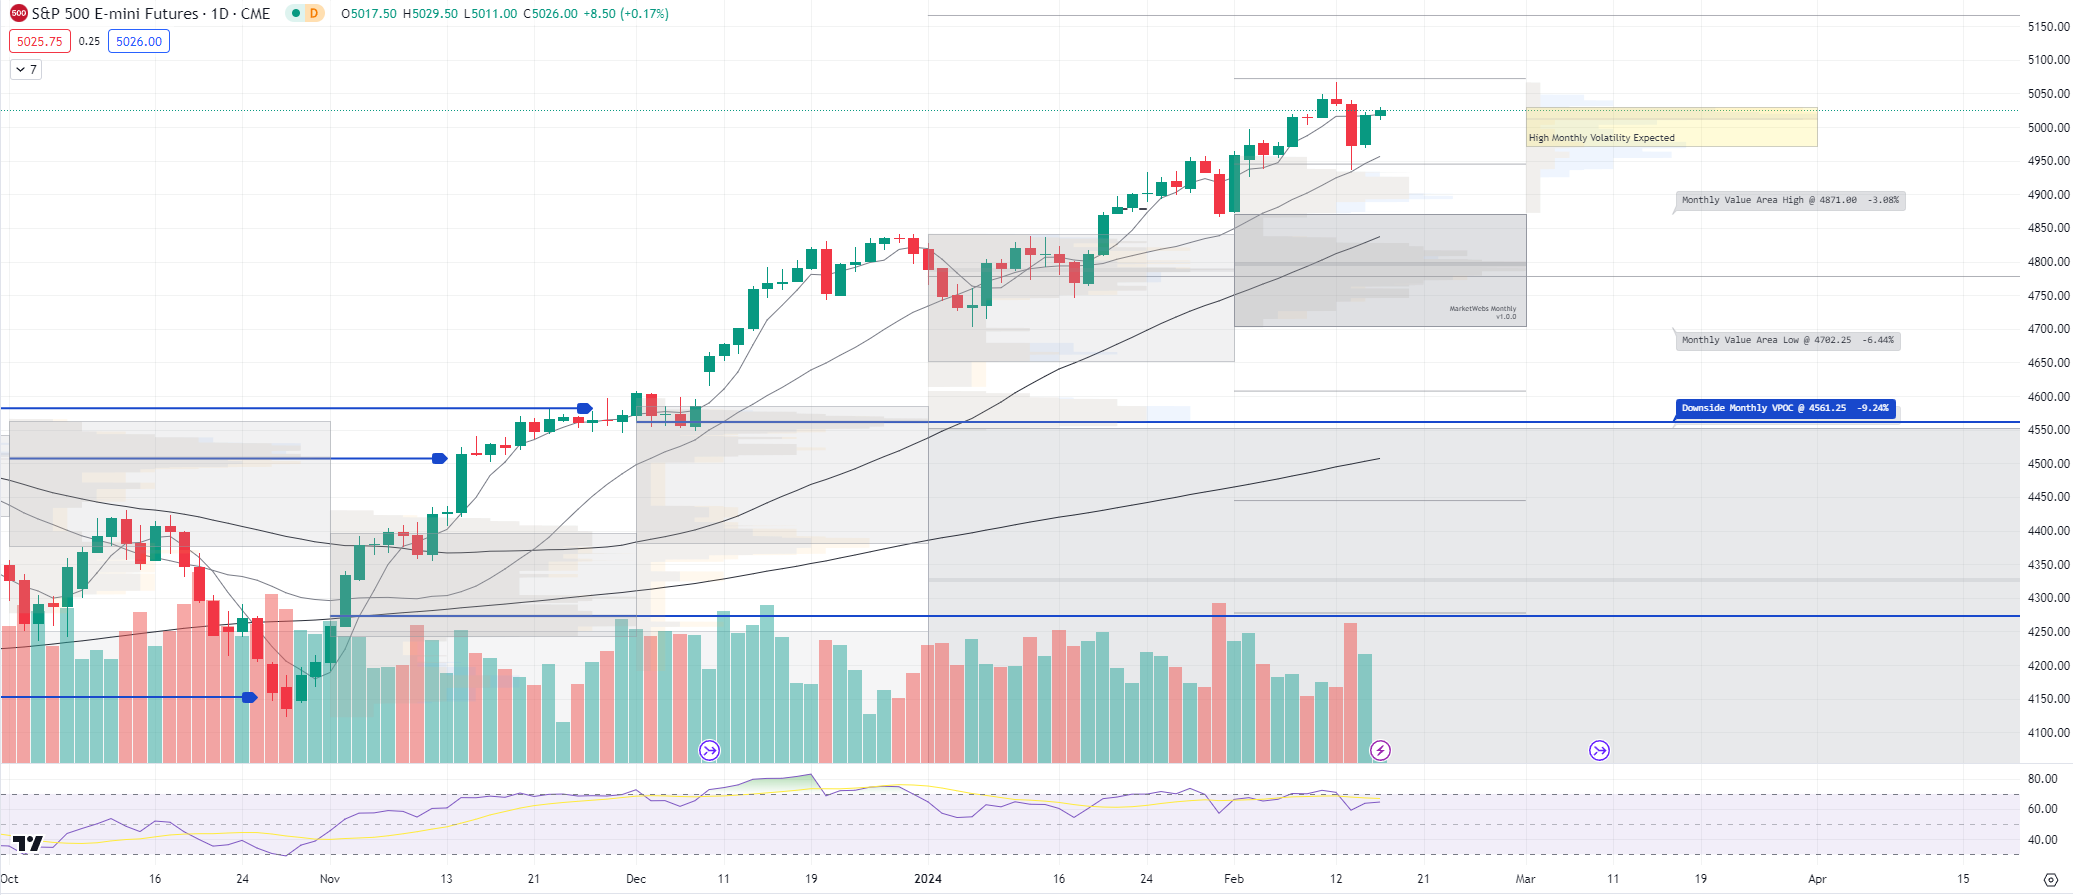
ES_F - SPX Futures - Price ind. +0.1% ahead of Retail Sales and Weekly Jobless Claims. A nice rebound yesterday on its 20d MA (Moving Average) and price is trying to retake its 5d MA
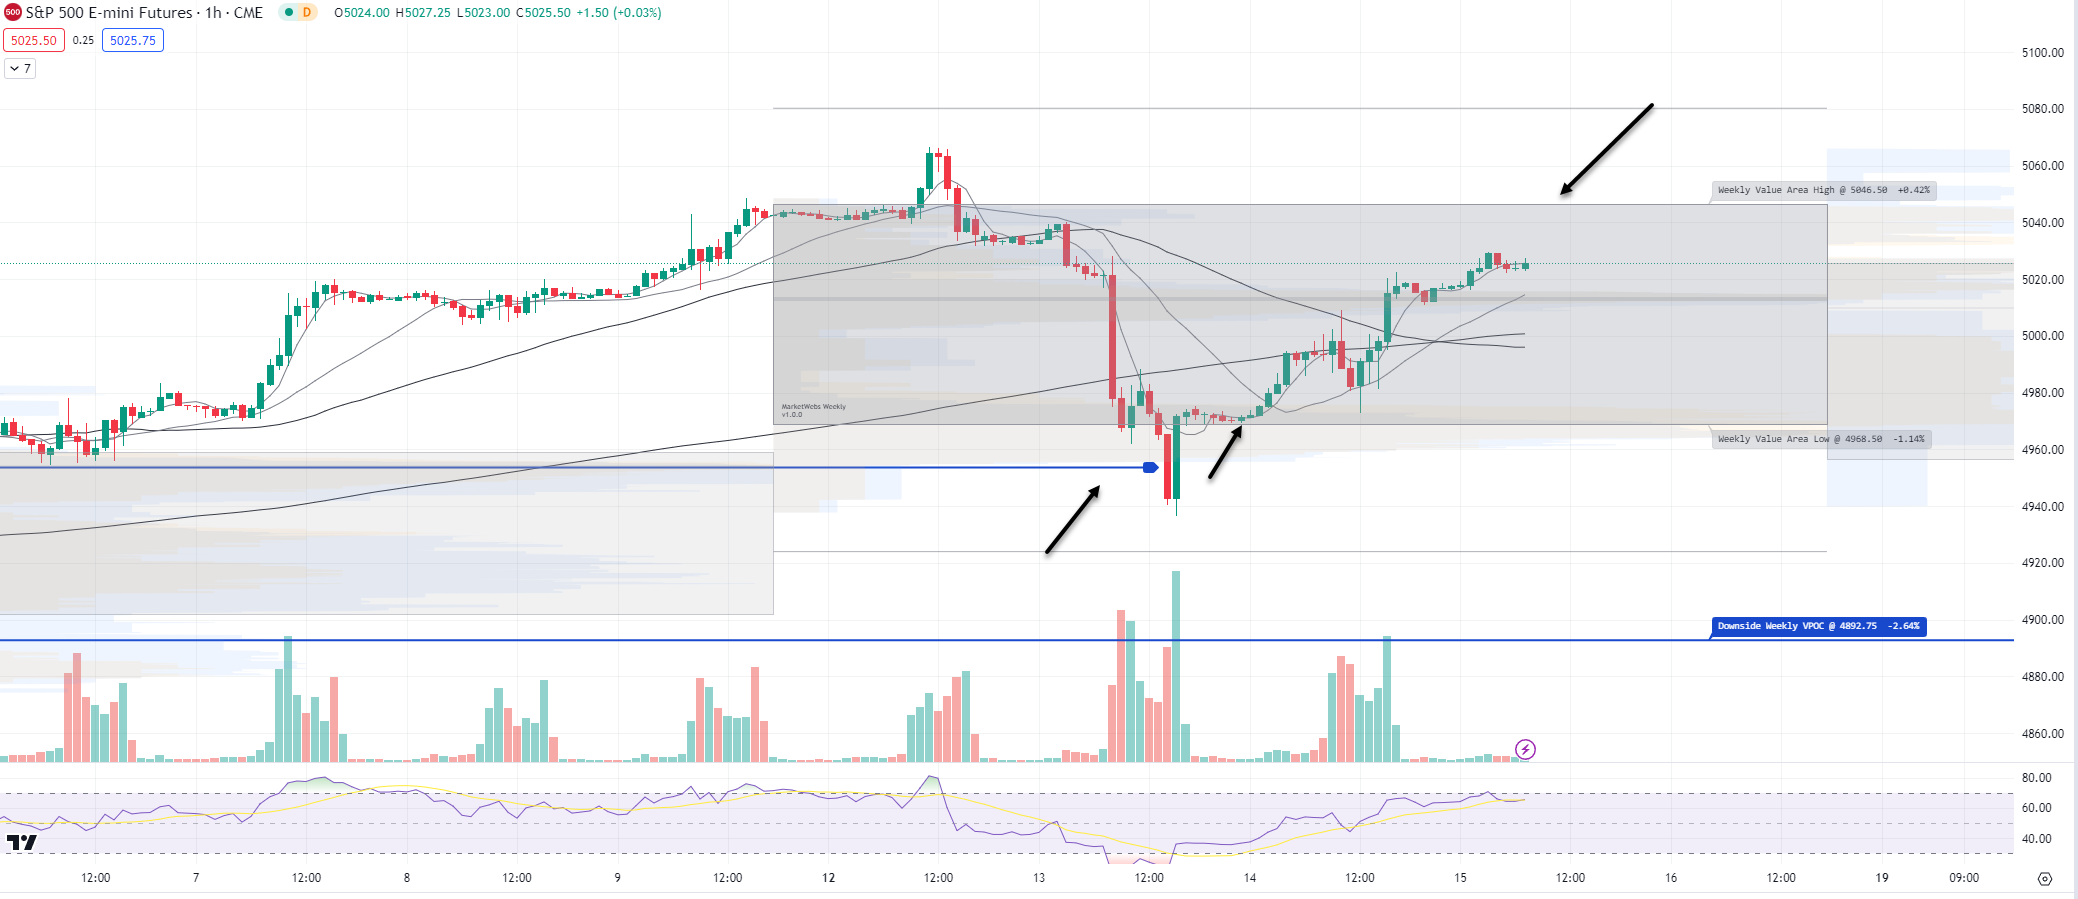
1hr chart: Price grinding higher and next resistance or test to the upside would be top of this week's Value Area 5046.5
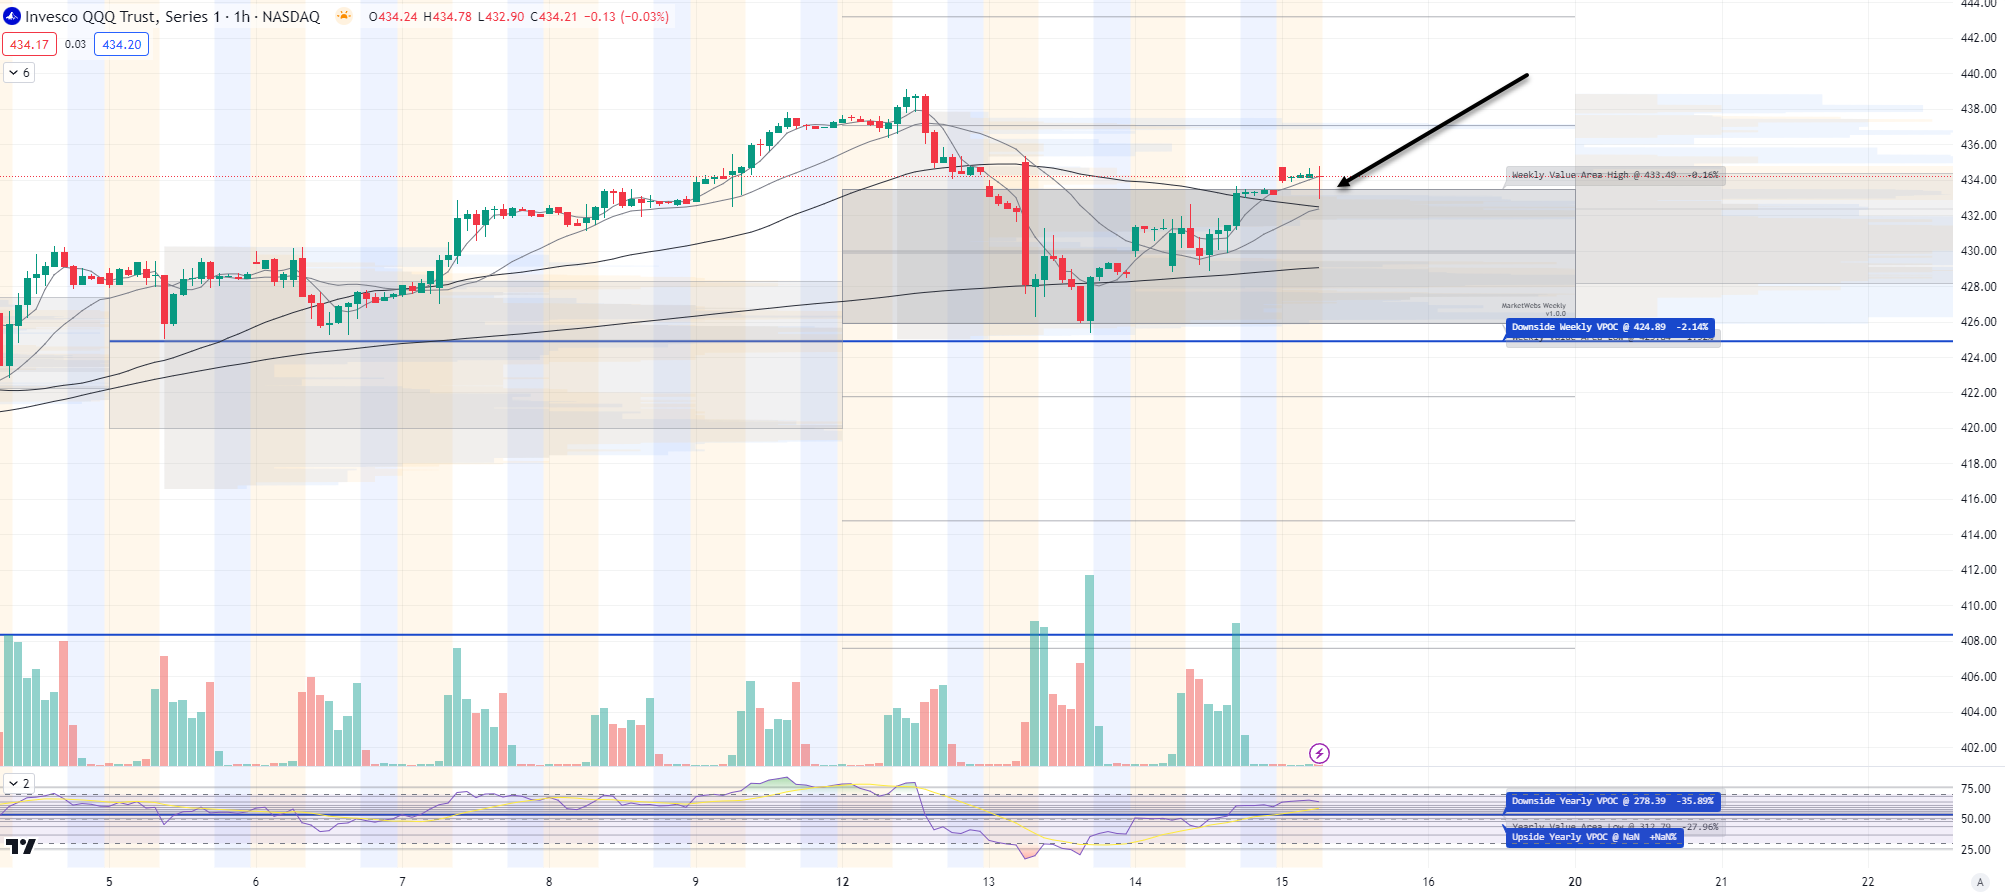
QQQ - NDX 100 ETF - Daily chart: Price ind. +0.1% & after bouncing on its 20d MA , price now testing overhead 5d MA

1hr chart: Price is inside its Value Area for week after the bearish 80% rule played out , levels to watch below
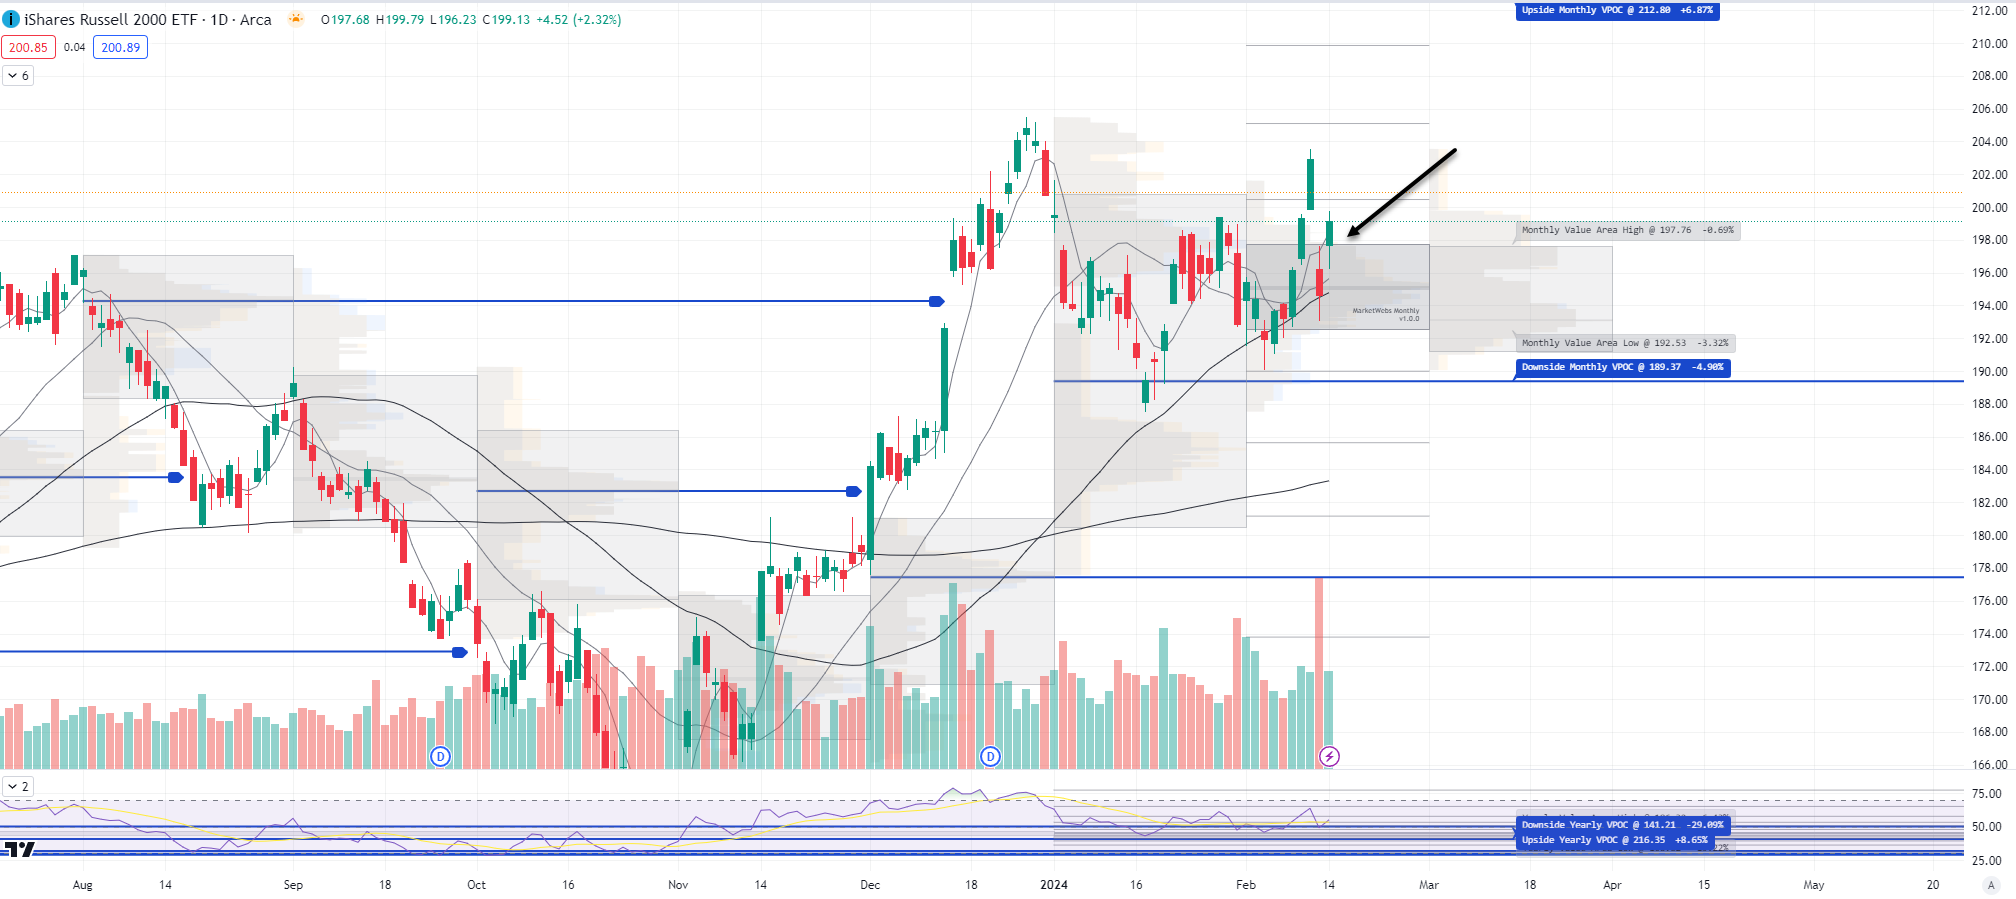
IWM - Russell Small Cap ETF- Price ind. +0.7% and outperforming once again. Will it hold through the Retail Sales report? I am watching to see if price can hold above its Feb Value Area , support $197.76
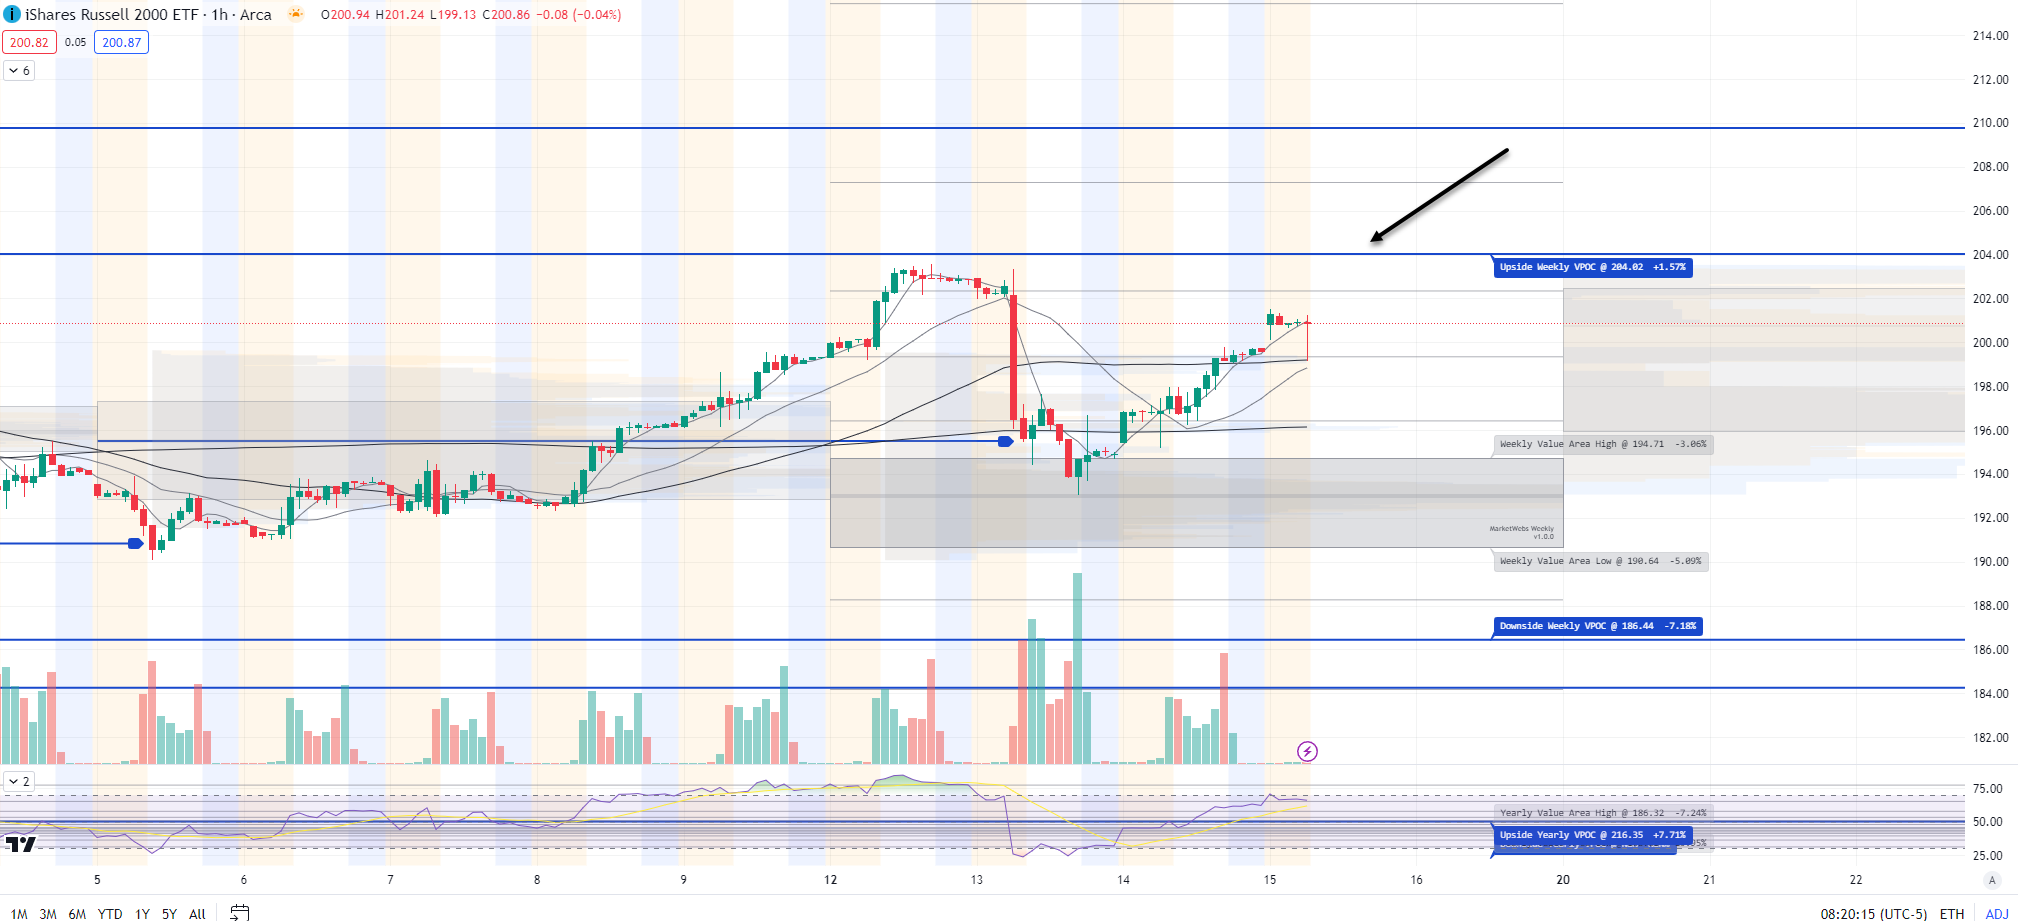
1hr chart: Earlier this week, price held above its Value Area for week, now I would watch this week's highs and further upside VPOC @ $204.02
Here is today’s TTG Proprietary Stock Screen “Out of the Box” using Volume At Price
names trending above their Value Areas (on 3 multiple timeframes & not super extended)
Keep reading with a 7-day free trial
Subscribe to The Tribeca Trade Group to keep reading this post and get 7 days of free access to the full post archives.