

TTG Index Charts & Out of the Box Stock Screen 4/26/24 $TECK
TTG Index Charts & Out of the Box Stock Screen 4/26/24 $TECK
Out of the Box MarketWebs Screen
US Dollar +0.2% / 30yr Bonds +0.3% / Crude +1.0% & Nat Gas -2.9% / Gold +0.5% / Copper +1.0% / BTC -0.5%
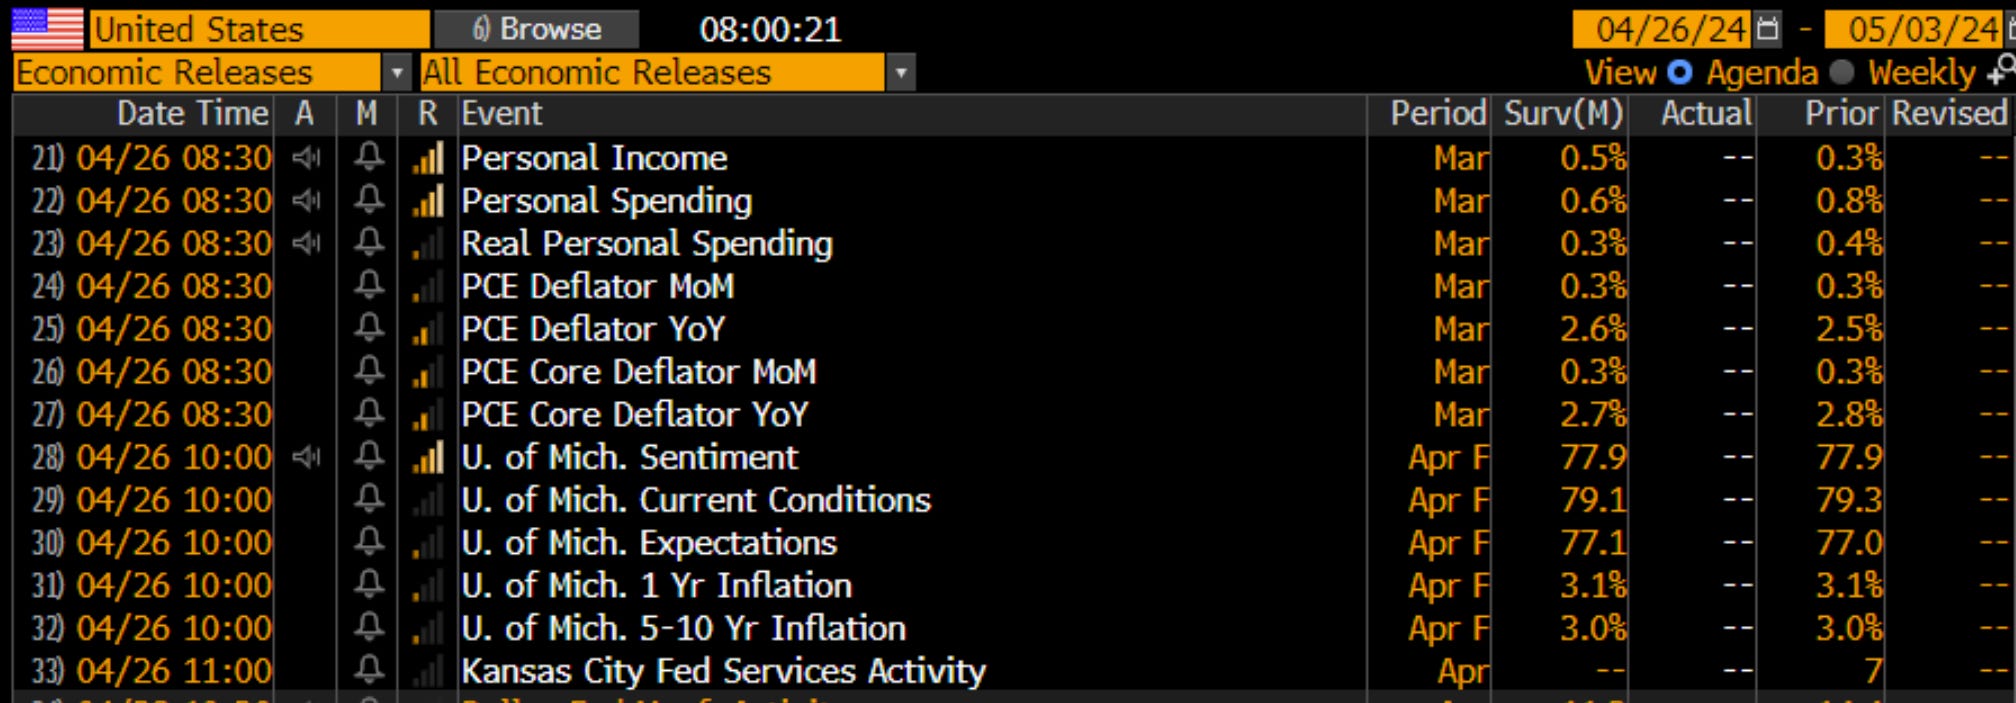
US Upcoming Economics
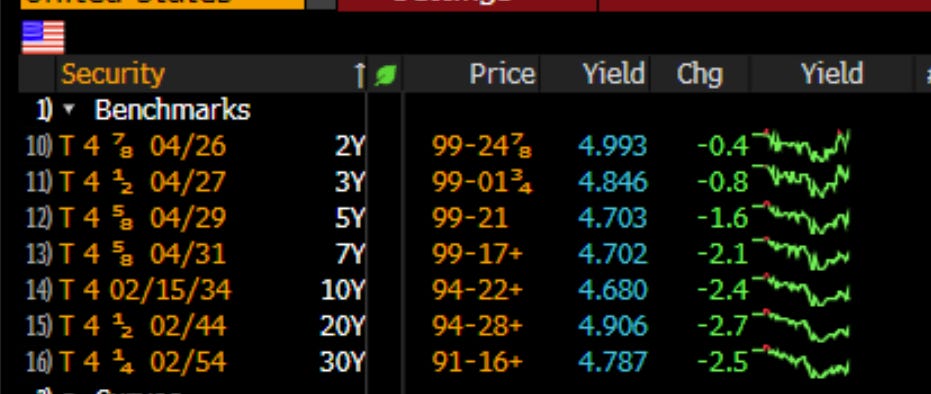
US Bond Yields
Index Updates
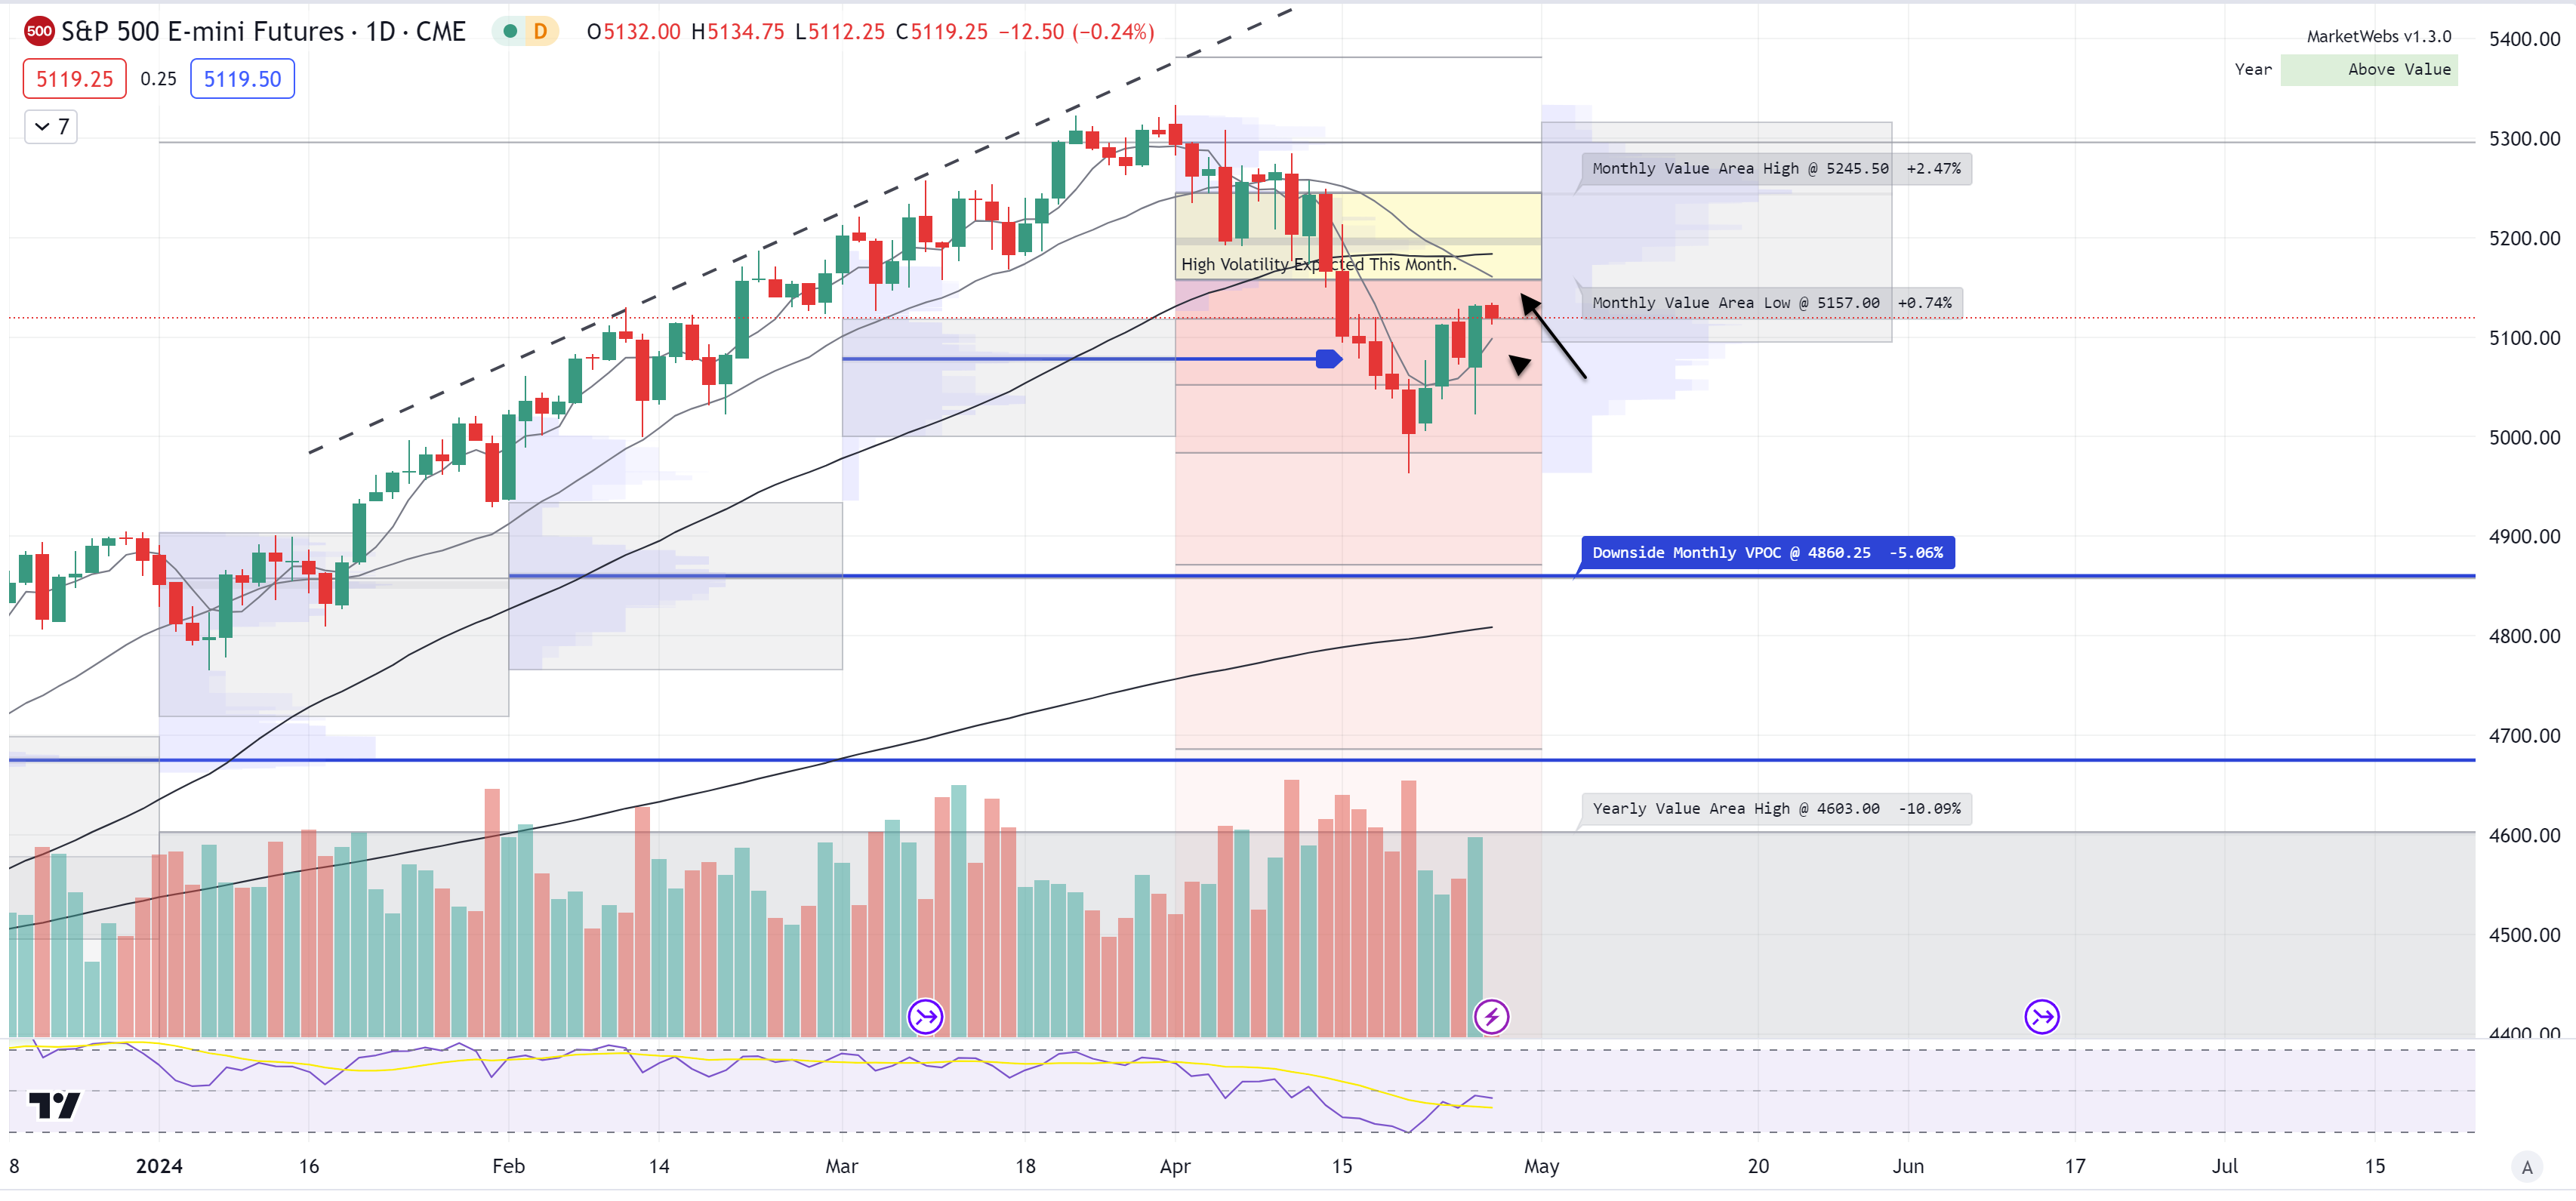
At TTG, I use Volume At Price in my chart analysis and I use the MarketWebs Indicator to provide Value Areas & VPOCs which indicate significant support & resistance levels. Learn More Here about Volume At Price and the MarketWebs.

ES_F - SPX Futures - Daily chart: Price ind. +0.7% ahead of the PCE Deflator (Inflation) report and price has rallied back up to the bottom of the Apr Value Area (resistance), watch 5157 , also note price has maintained above its 5d MA
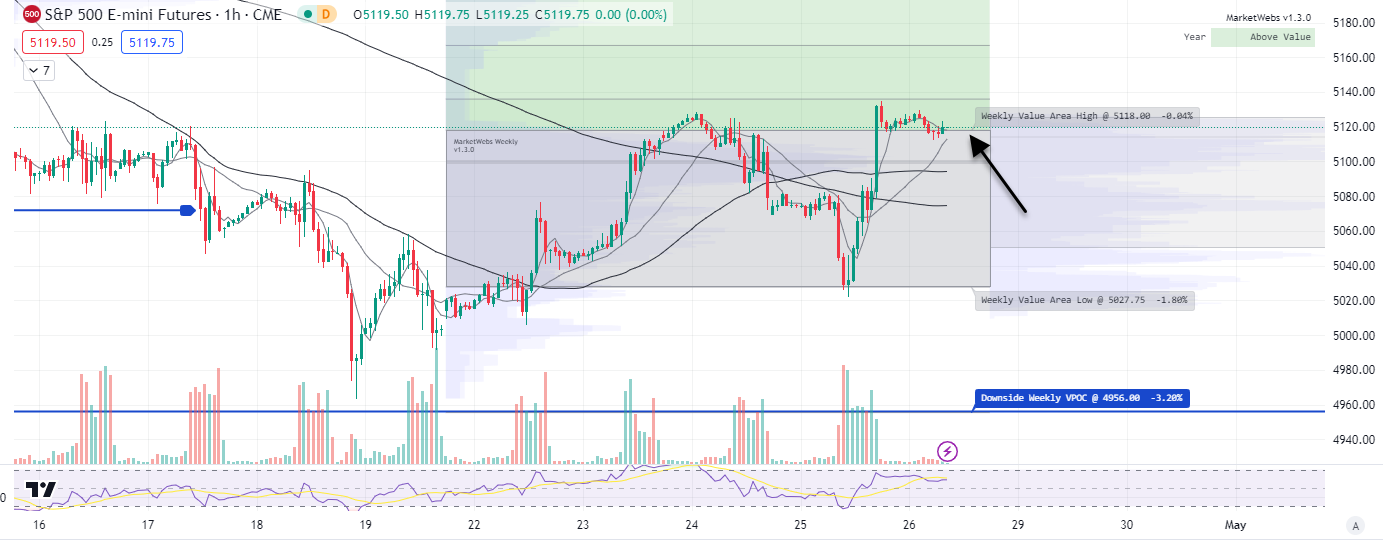
1hr chart: Price right back to where it was earlier in the week at the top of this week's Value Area , watch 5118
QQQ - NDX 100 ETF - Daily chart: Price ind. +1.0%, which is the exact opposite of what price was indicated yesterday morning as earnings reports (today GOOGL MSFT) whip around the price action.
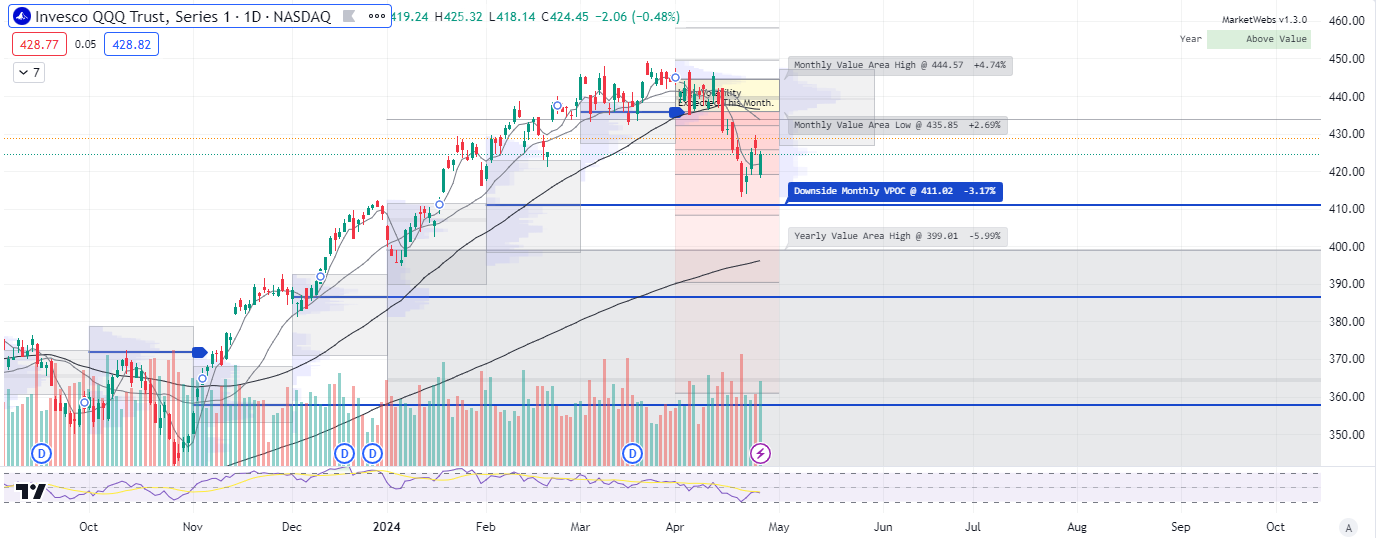
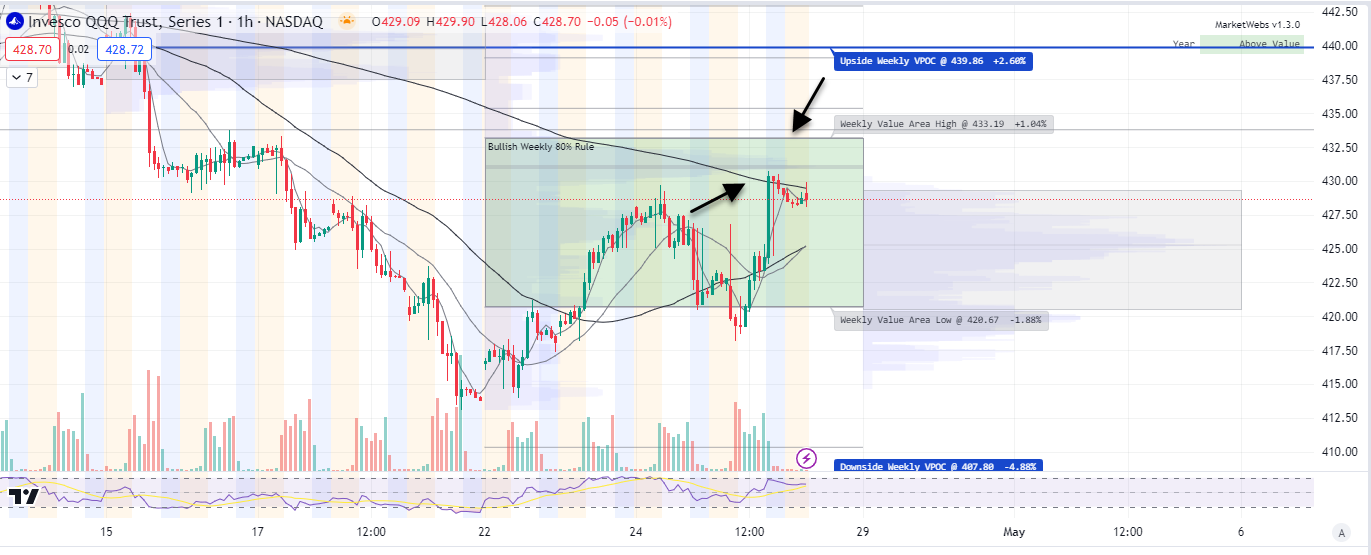
1hr chart: Similar to the S&P , price is just about back to where it was earlier in week.. resistance is up at $433.19 and price is pausing at that 200 period MA (black line)
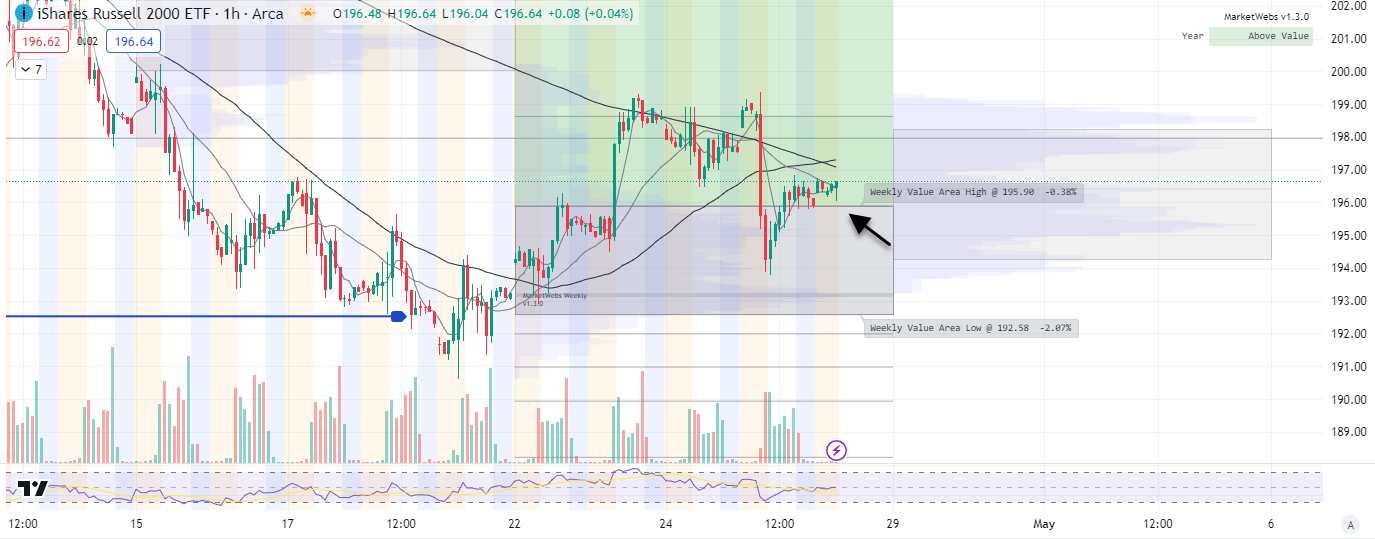
IWM - Russell Small Cap ETF- Daily Chart: Price ~ flat ahead of PCE data and and right at that 5d MA

1hr chart: Price back above this week's Value Area, support to watch $195.9
Here is today’s TTG Proprietary Stock Screen “Out of the Box” using Volume At Price
names trending above their Value Areas (on 3 multiple timeframes & not super extended)
Keep reading with a 7-day free trial
Subscribe to The Tribeca Trade Group to keep reading this post and get 7 days of free access to the full post archives.