


TTG Index Charts & Out of the Box Stocks to Start the Week
Out of the Box MarketWebs Screen
This Index note is provided every Monday morning to help determine Index support & resistance leveks
US Dollar -0.1% / 30yr Bonds +0.9% / Crude +0.5% & Nat Gas +4% / Gold -0.4% / Copper -0.7% / BTC -5.2%
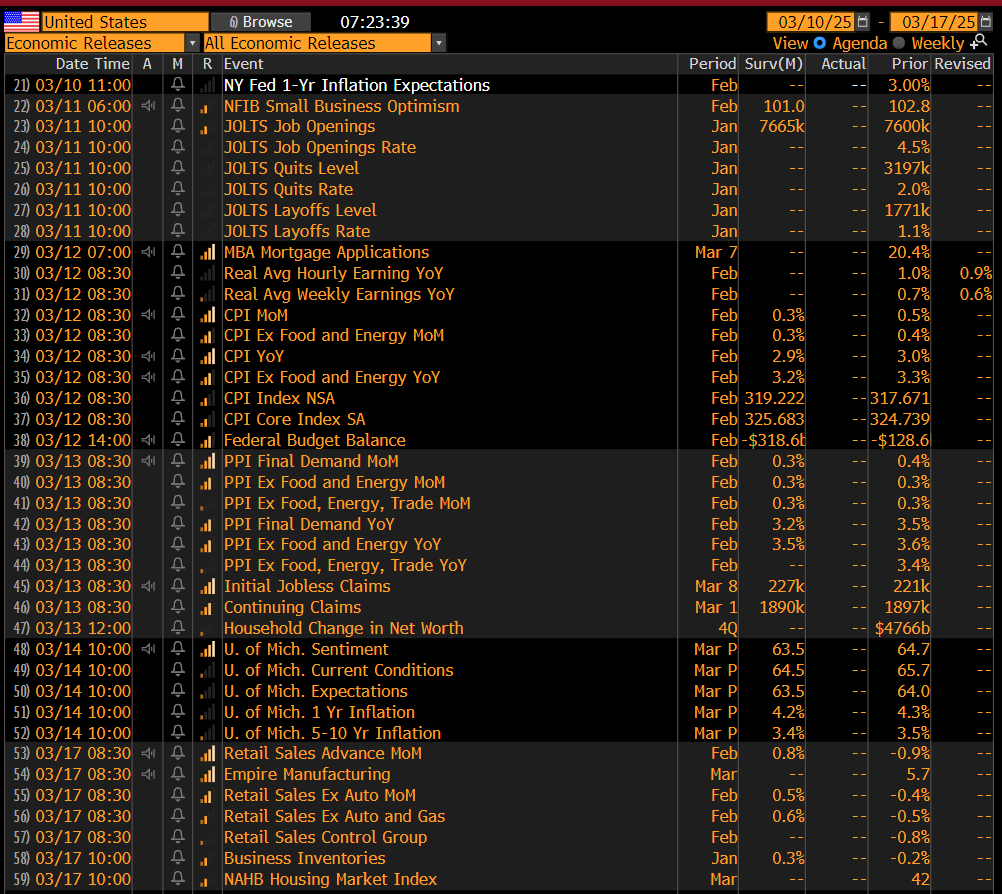
US Upcoming Economics
US Bond Auctions
Index Updates
At TTG, I use Volume At Price in my chart analysis and I use the MarketWebs Indicator to provide Value Areas & VPOCs which indicate significant support & resistance levels. Learn More Here about Volume At Price and the MarketWebs.

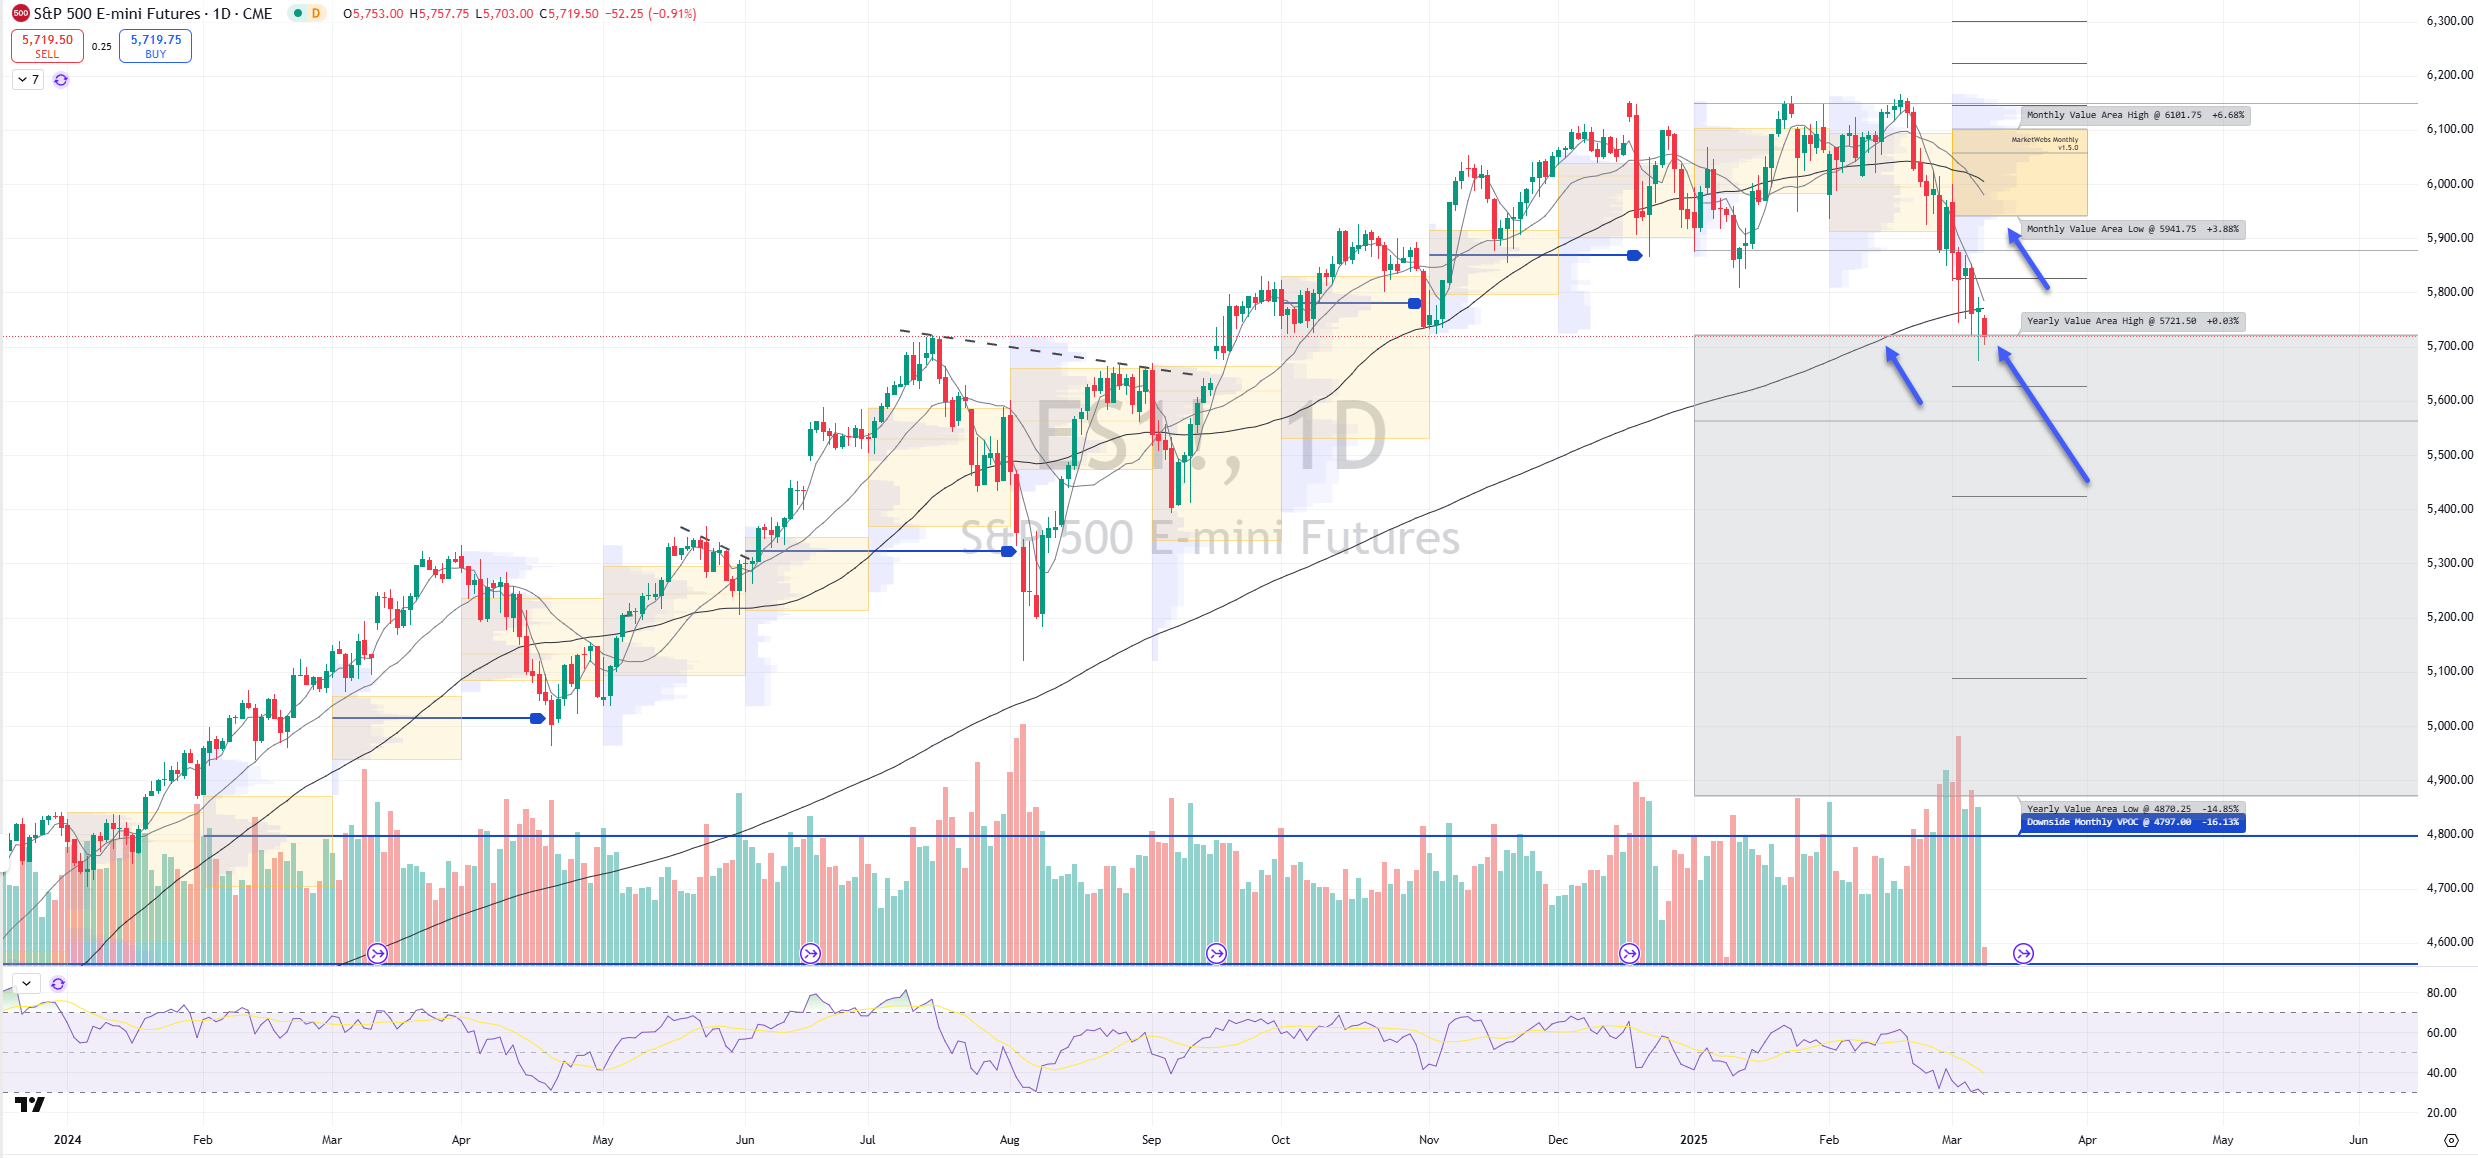
ES_F - SPX Futures - Daily chart: S&P futures ind. -0.9% and no follow through from Friday's reversal. A big support level to watch here is 5721.5 which is the top of '25 Value Area and for me this has to hold for the uptrend in stocks to continue. Also, keep an eye on 200d MA
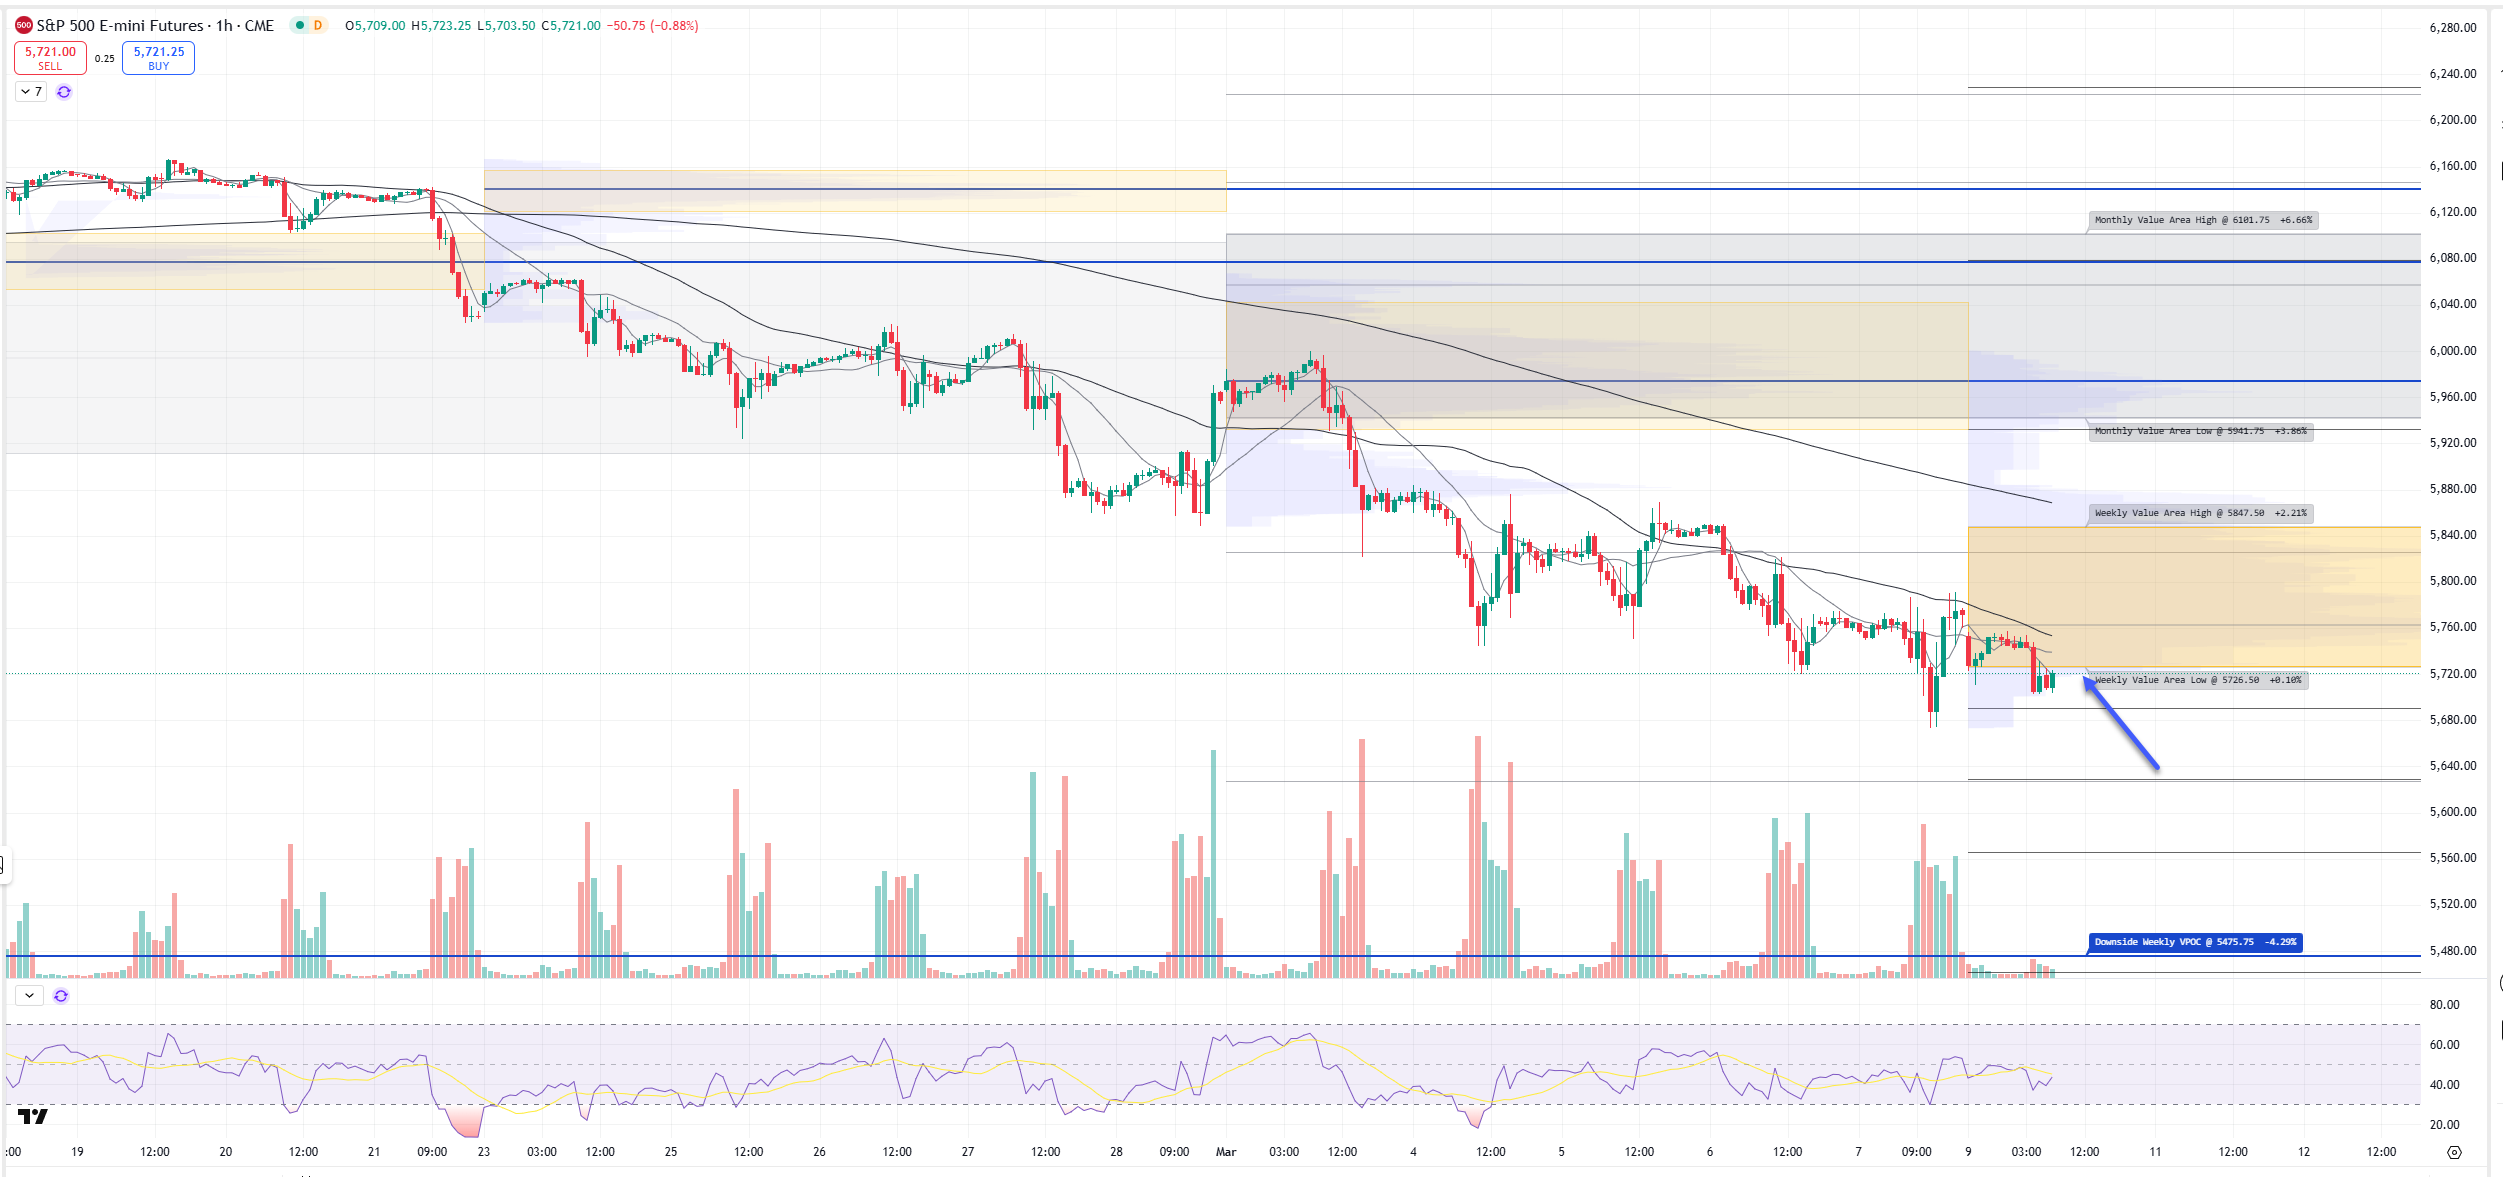
1hr chart: Price starts the week just BELOW its new Value Area for the week, level to watch here is 5726.5 and price remains in a downward channel (Friday's rebound just got price back to upside of channel
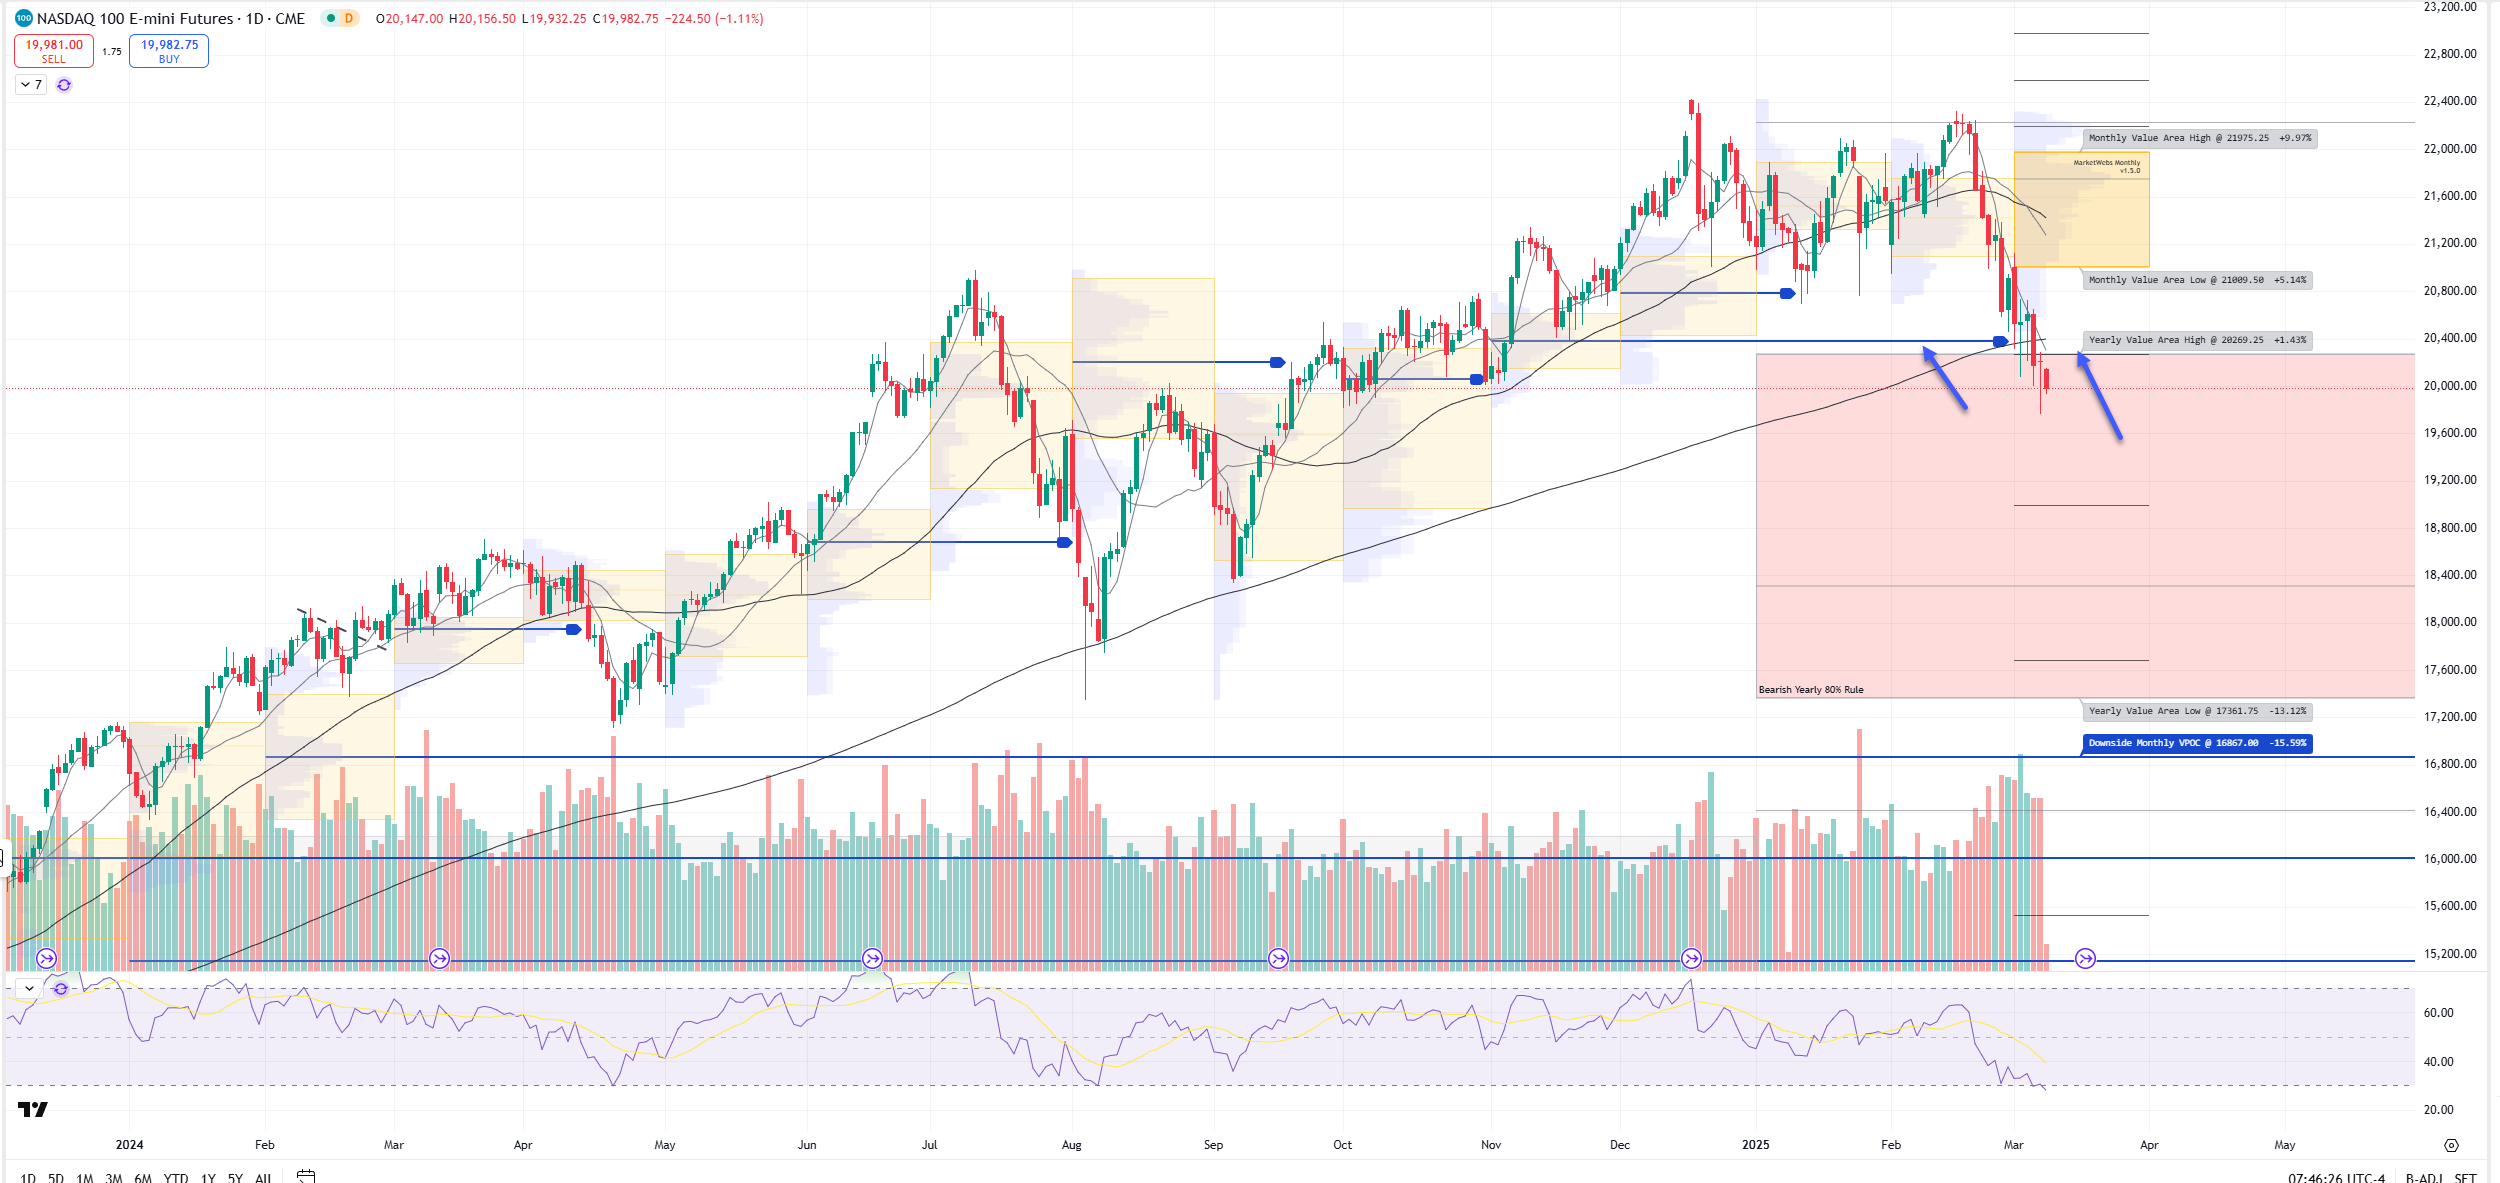
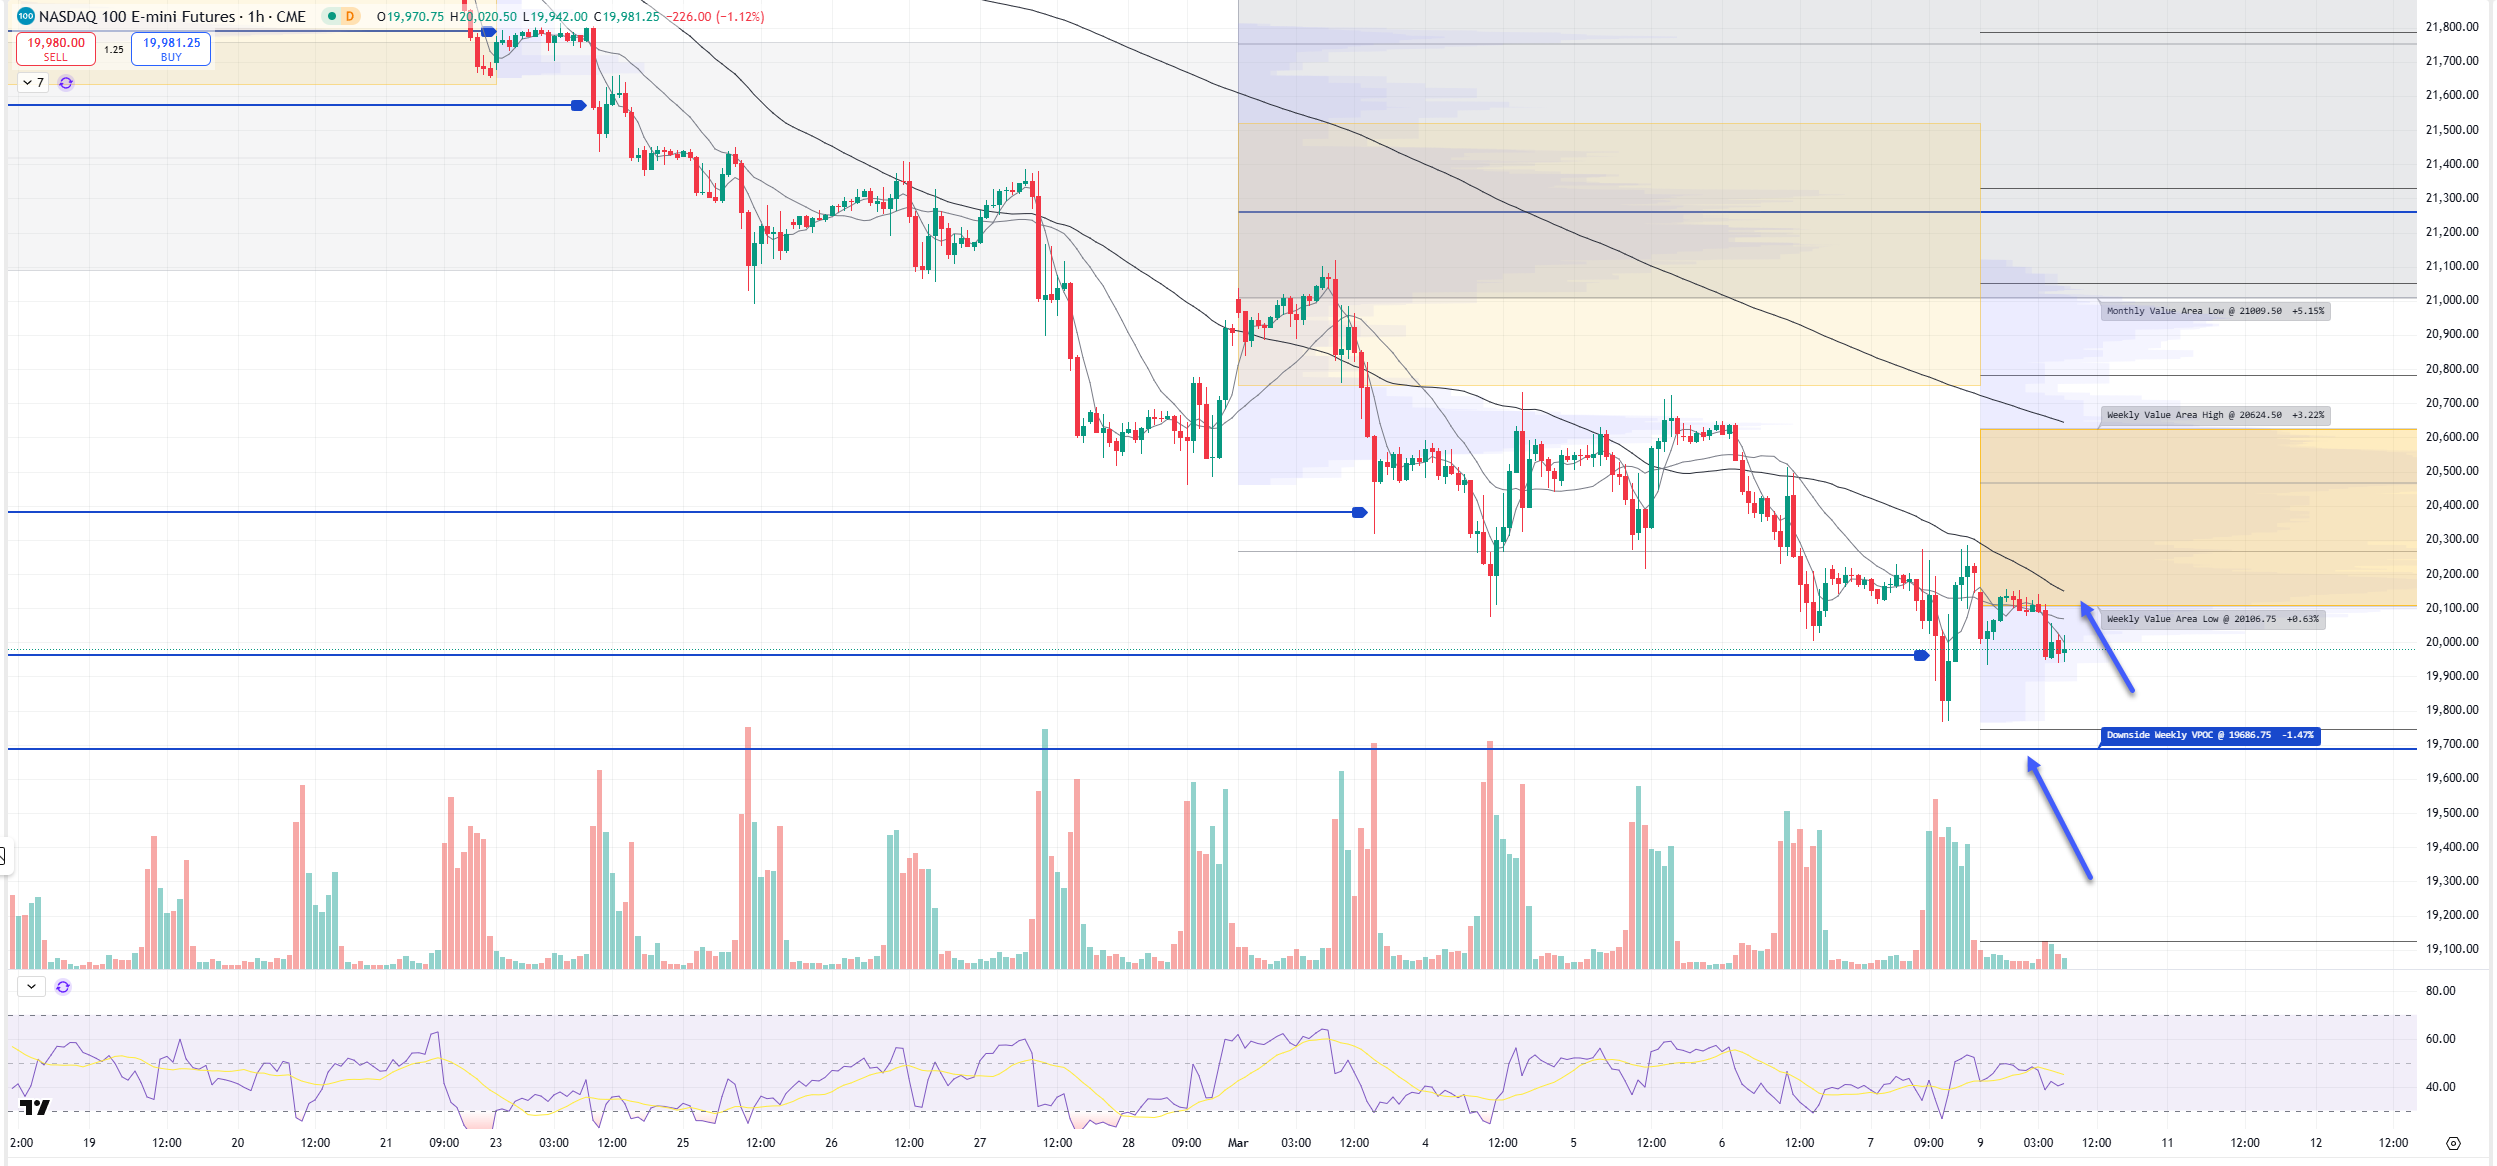
NQ_F - NDX 100 futures- Daily chart: NDX futures ind. -1.2% and price has broken into its '25 Value Area, big level to watch here is 20,269.25 or QQQ $486.56 . Price is also below its 200d MA
1hr chart: Price starts the week BELOW its new Value Area for week, resistance is 20,106.75 or QQQ $487.9 and similar to the S&P, price remains in a downwards channel
RTY_F - Russell Small Cap Futures- Daily Chart: RTY futures ind. -1.1% and price continues to move lower , the #bearish 80% rule remains in place , looking for a move down to 1935.5
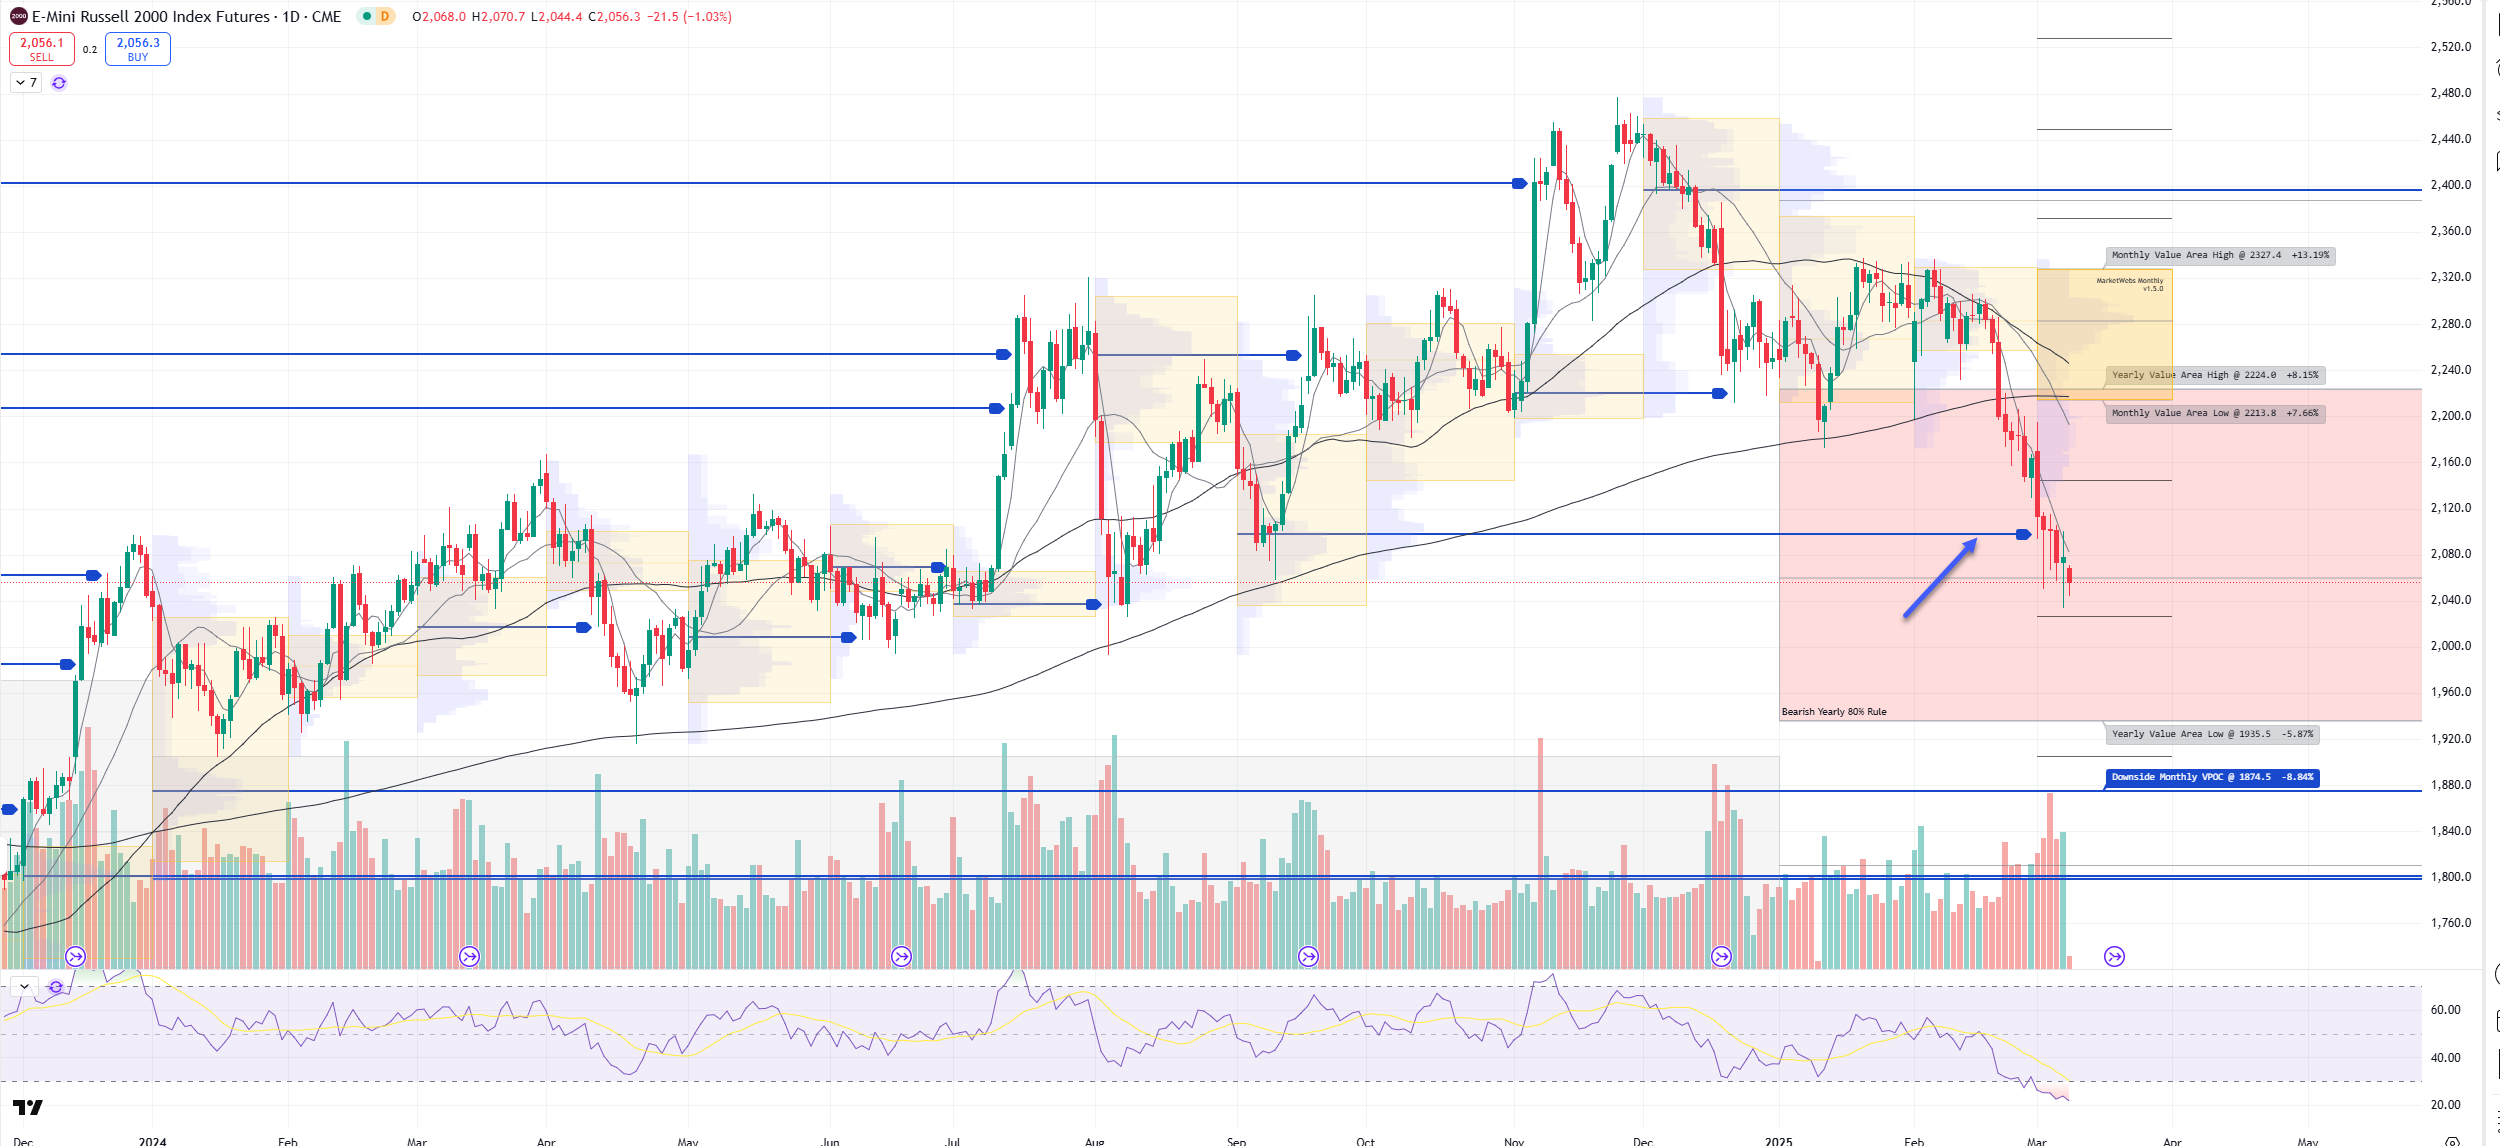
1hr chart: Price starts the week BELOW its new Value Area, resistance 2063.2

Here is today’s TTG Proprietary Stock Screen “Out of the Box” using Volume At Price
names trending above their Value Areas (on 3 multiple timeframes & not super extended)
Keep reading with a 7-day free trial
Subscribe to The Tribeca Trade Group to keep reading this post and get 7 days of free access to the full post archives.