

TTG Index Charts & Out of the Box Stock Screen 7/23/24
TTG Index Charts & Out of the Box Stock Screen 7/23/24
Out of the Box MarketWebs Screen
US Dollar +0.1% / 30yr Bonds +0.3% / Crude -0.4% & Nat Gas +2.5% / Gold +0.6% / Copper -0.6% / BTC -2.3%
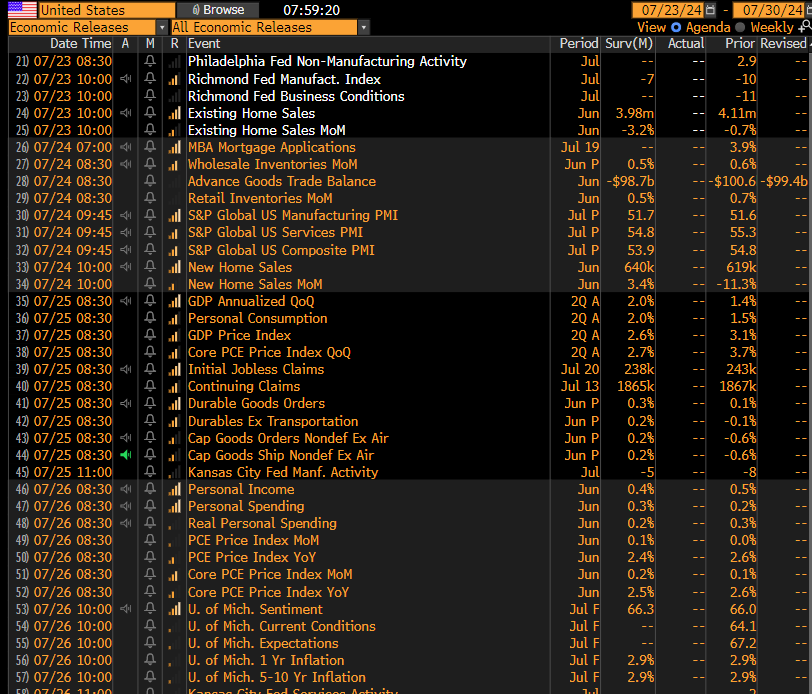
US Upcoming Economics & Fed Speakers

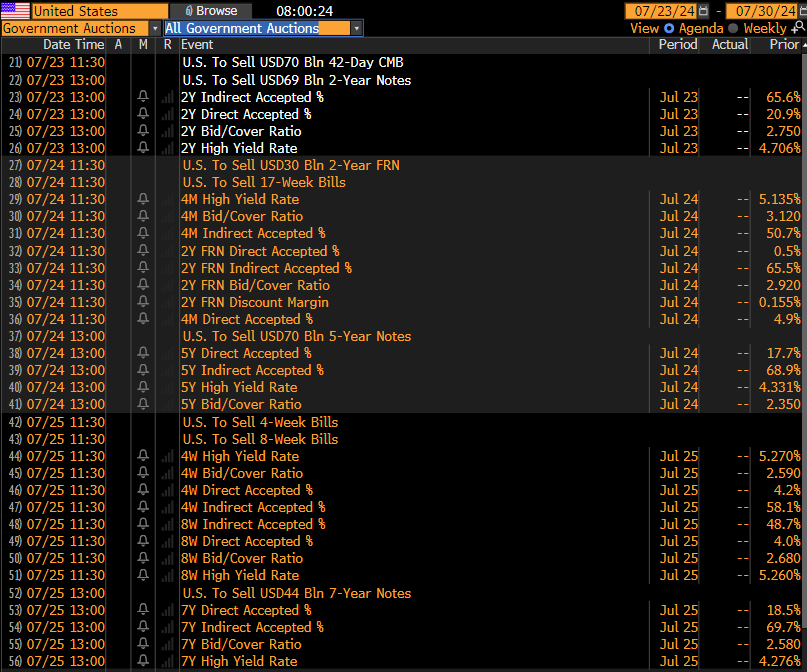
Bond Auctions
Index Updates
At TTG, I use Volume At Price in my chart analysis and I use the MarketWebs Indicator to provide Value Areas & VPOCs which indicate significant support & resistance levels. Learn More Here about Volume At Price and the MarketWebs.

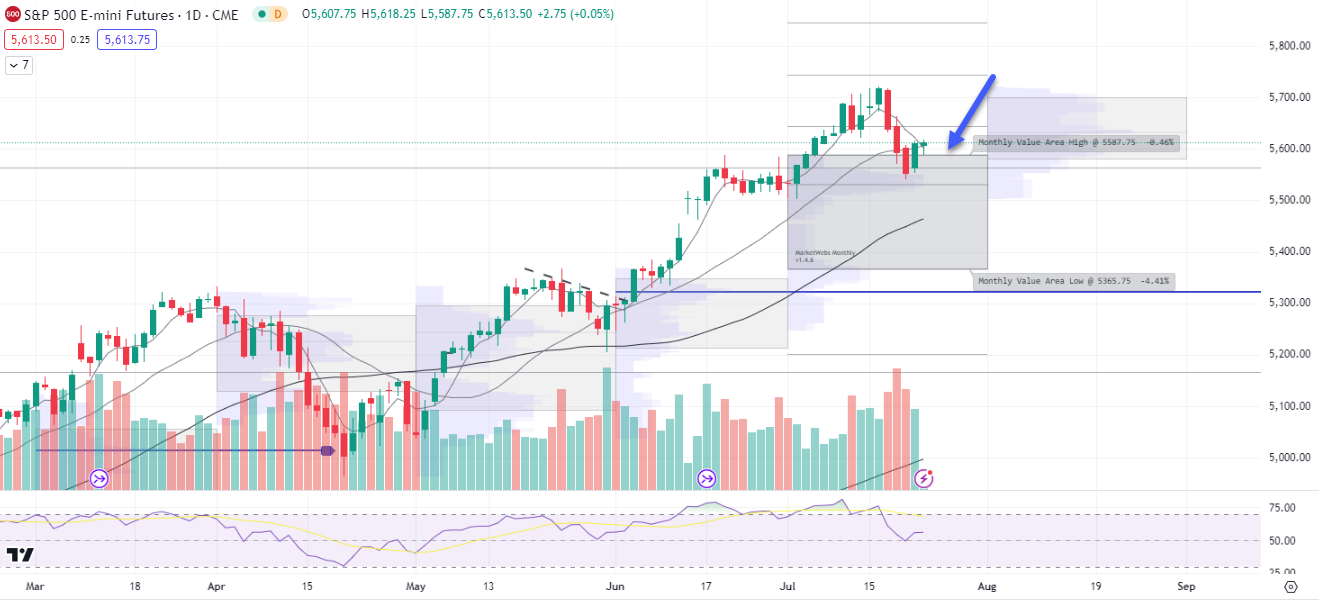
ES_F - SPX Futures - Daily chart: Price quiet this morning, +0.1% and price is now back above its July Value Area, support to watch is 5587.75 and trying to get above those short term MAs (Moving Averages)
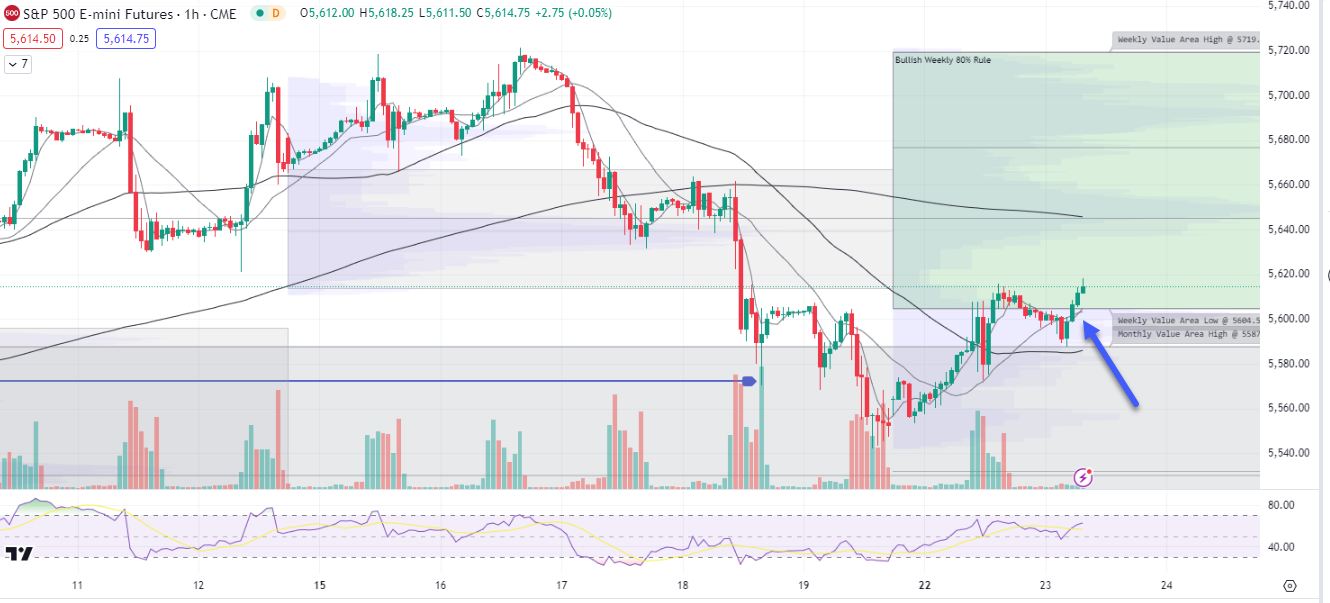
1hr chart: Price also rallied into its Value Area for the week, and has triggered the #bullish 80% rule looking for a move through the Value Area . Support to watch 5604.5
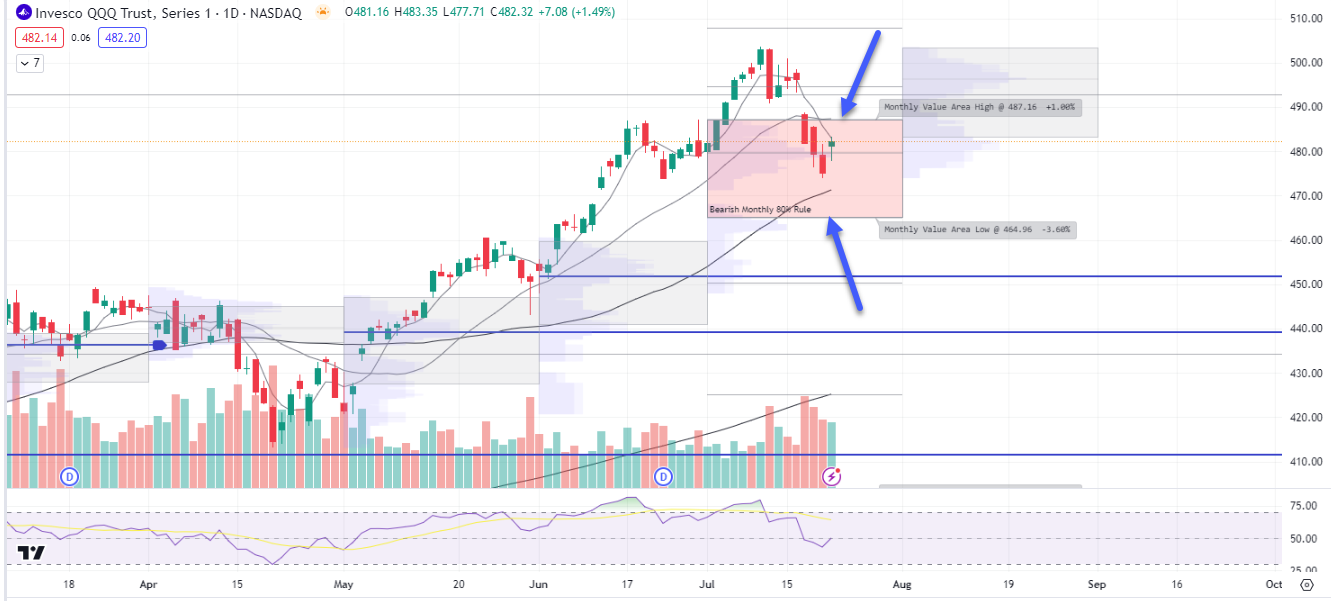
QQQ - NDX 100 ETF - Daily chart: Price flat this morning after a strong move yesterday +1.5%. Note, the #bearish 80% rule is still in effect which aims for a move down to the bottom of Aug Value Area $464.96 and that would be negated if price moves above $487.16
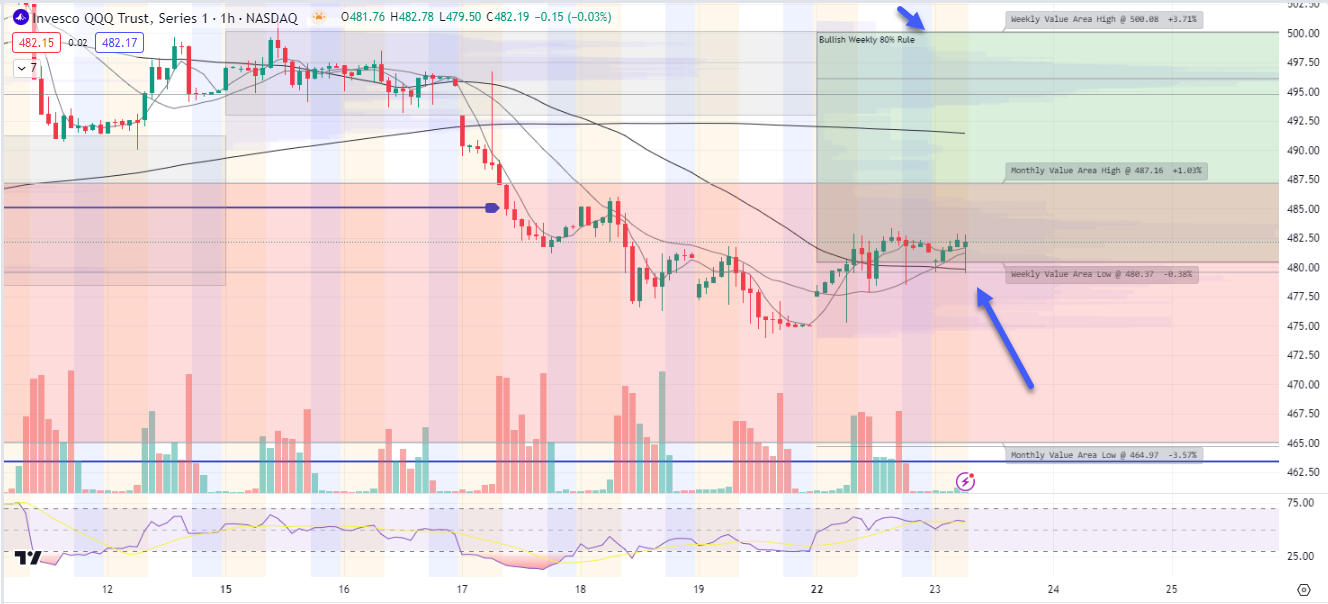
1hr chart: Have a nice level to watch today which is the bottom of the 1hr Value Area, $480.37. Yesterday, price got into this week's Value Area and triggered the #bullish 80% rule (as long as price > $480.37)
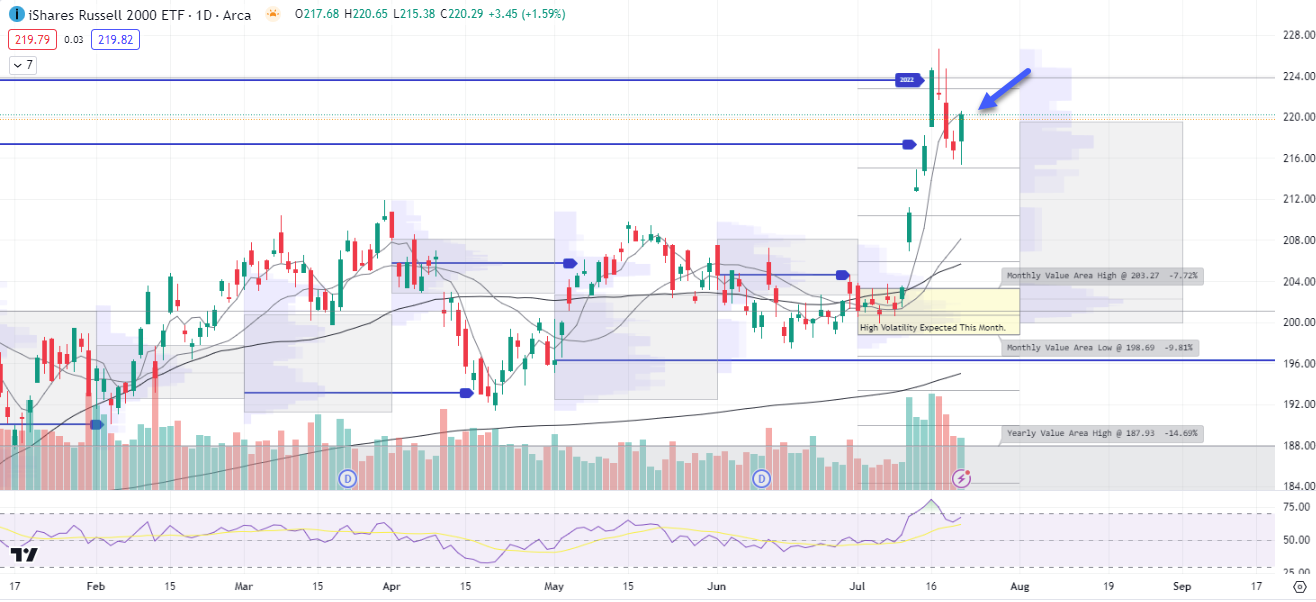
IWM - Russell Small Cap ETF- Daily Chart: Small Caps underperforming a bit this morning, ind. -0.3%. Yesterday, price rallied up to its 5d MA and that is what I am watching for continued strength in the Small Caps. Getting above its 5d MA would indicate a strong short-term trend.
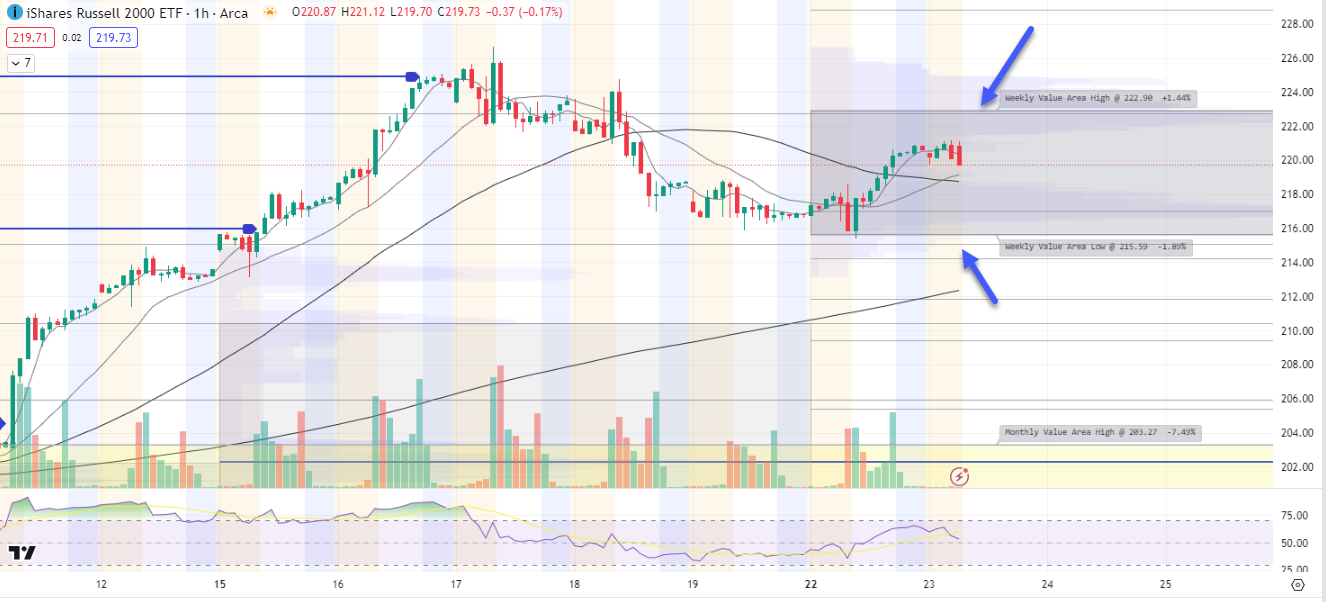
IWM 1hr chart: Price remains inside its Value Area for the week , levels to watch below .
Here is today’s TTG Proprietary Stock Screen “Out of the Box” using Volume At Price
names trending above their Value Areas (on 3 multiple timeframes & not super extended)
Keep reading with a 7-day free trial
Subscribe to The Tribeca Trade Group to keep reading this post and get 7 days of free access to the full post archives.