

TTG Index Charts & Out of the Box Stock Screen 3/25/24 $ATI
TTG Index Charts & Out of the Box Stock Screen 3/25/24 $ATI
Out of the Box MarketWebs Screen
US Dollar -0.2% / 30yr Bonds -0.3% / Crude +0.5% & Nat Gas -2.6% / Gold +0.6% / Copper -0.1% / BTC +4.9%
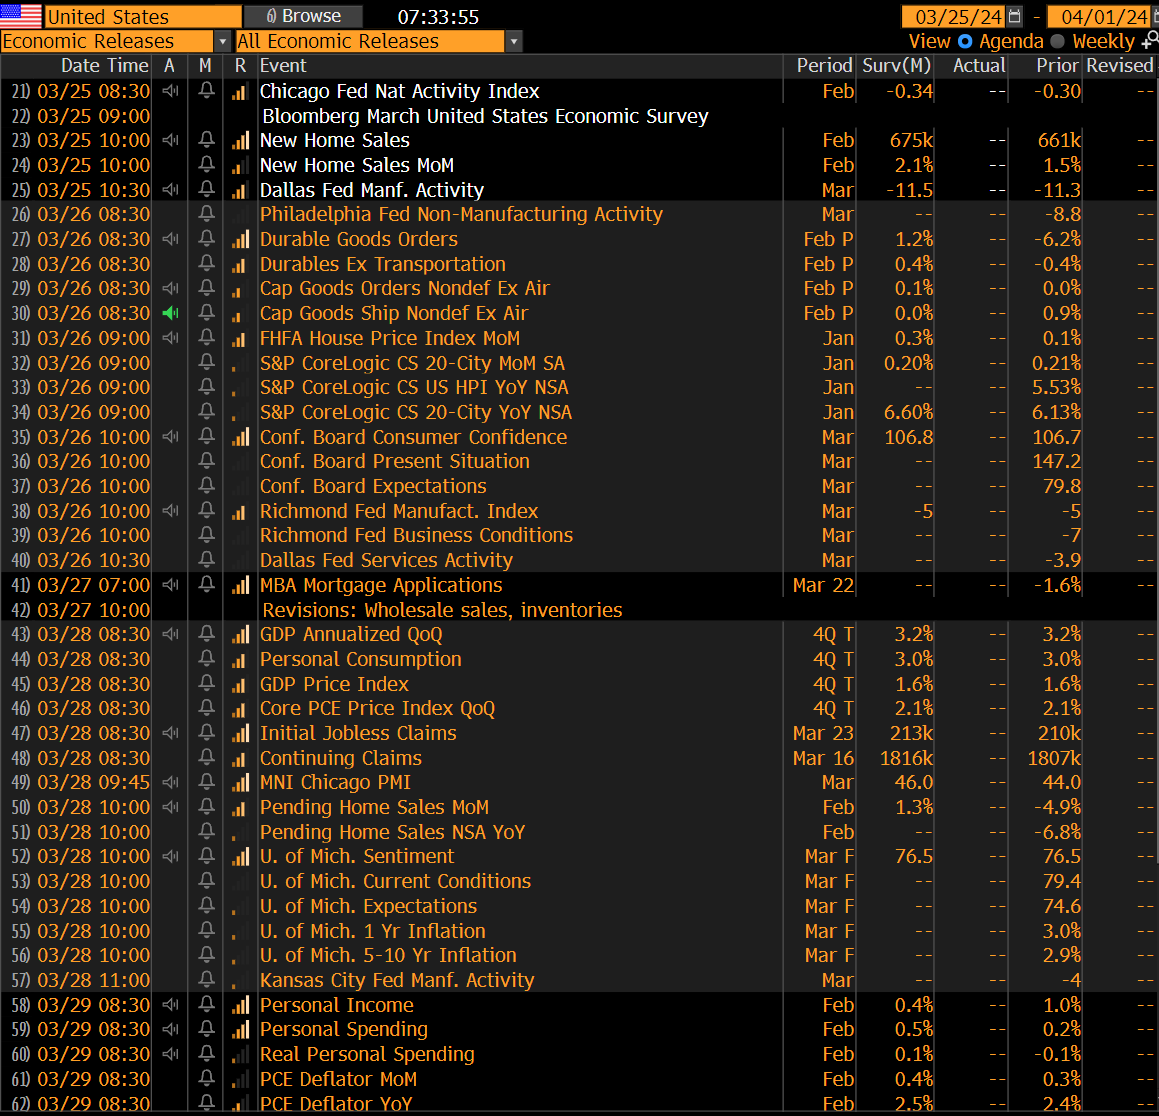
US Upcoming Economics
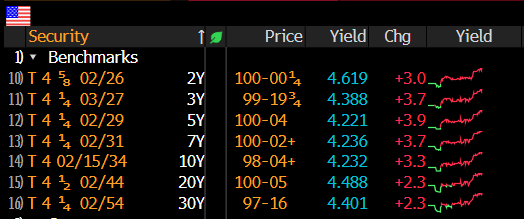
US Bond Yields
Index Updates
At TTG, I use Volume At Price in my chart analysis and I use the MarketWebs Indicator to provide Value Areas & VPOCs which indicate significant support & resistance levels. Learn More Here about Volume At Price and the MarketWebs.
ES_F - SPX Futures - Prices methodically obeying the uptrend channel - and back in the middle of the channel
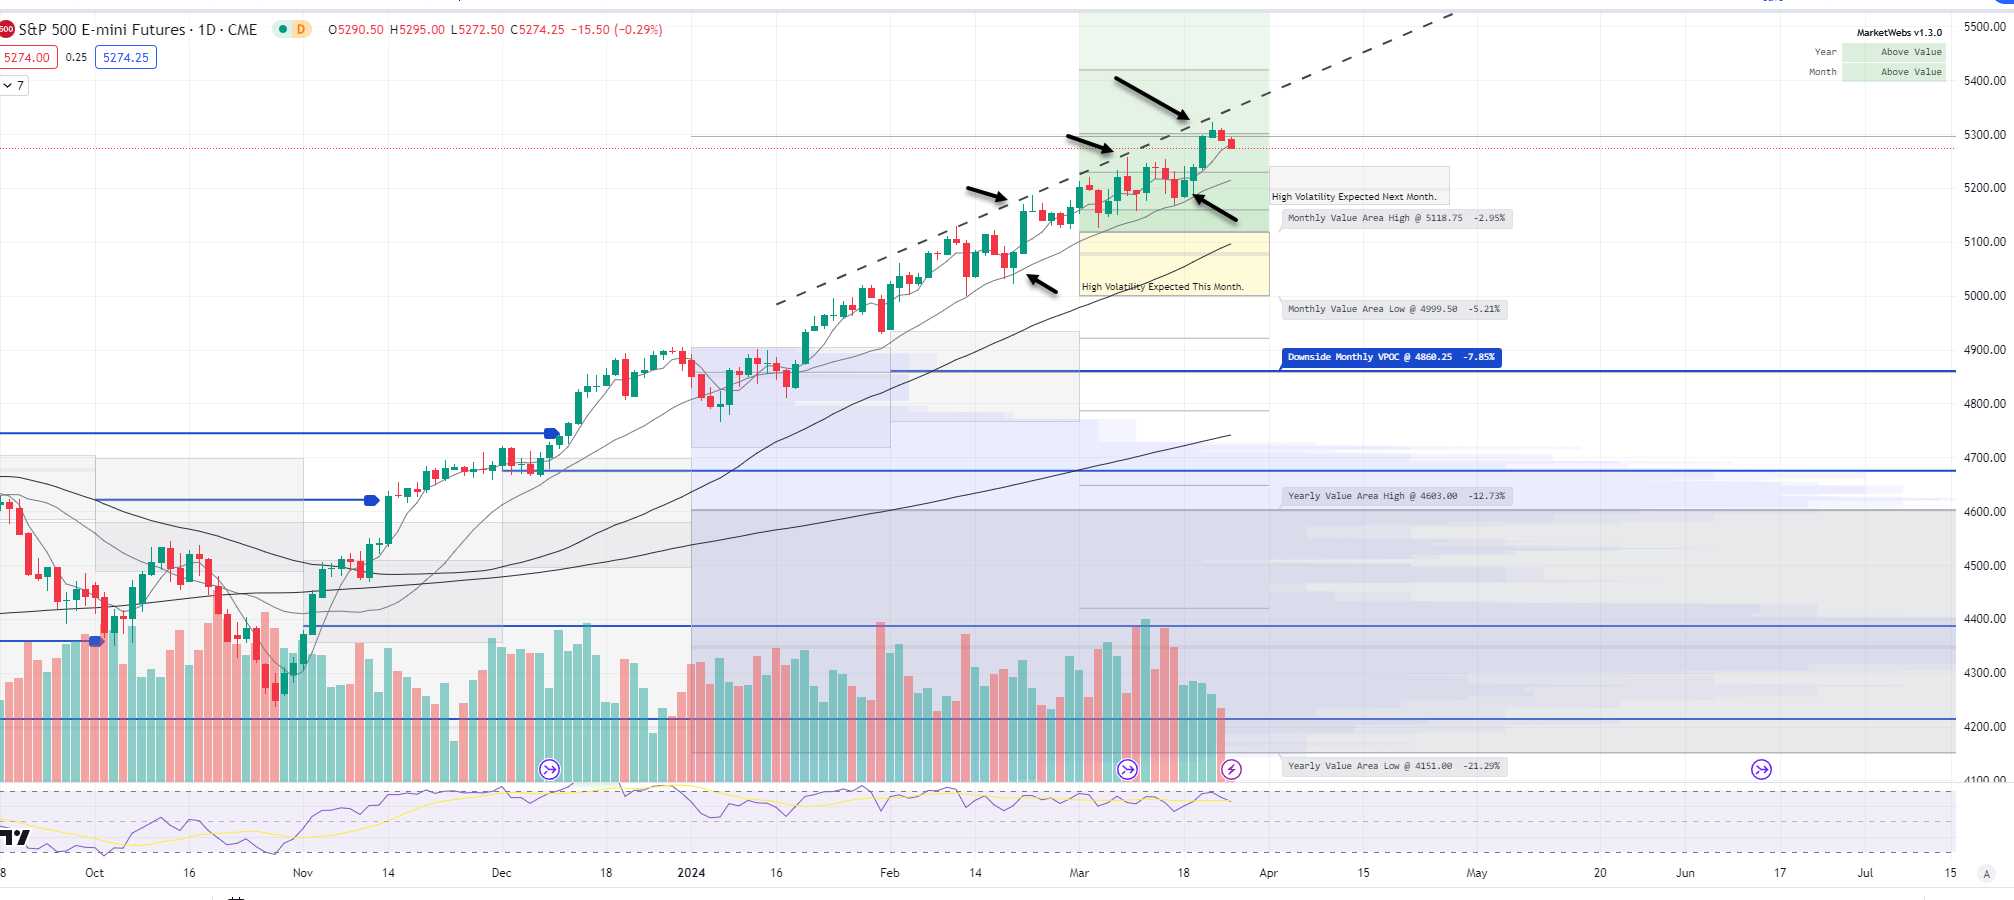
1hr chart: Price ind. -0.3% this morning and starts the week inside is new Value Area for week, resistance 5303.5. Note prices have been trending a bit lower since the FOMC pop last week

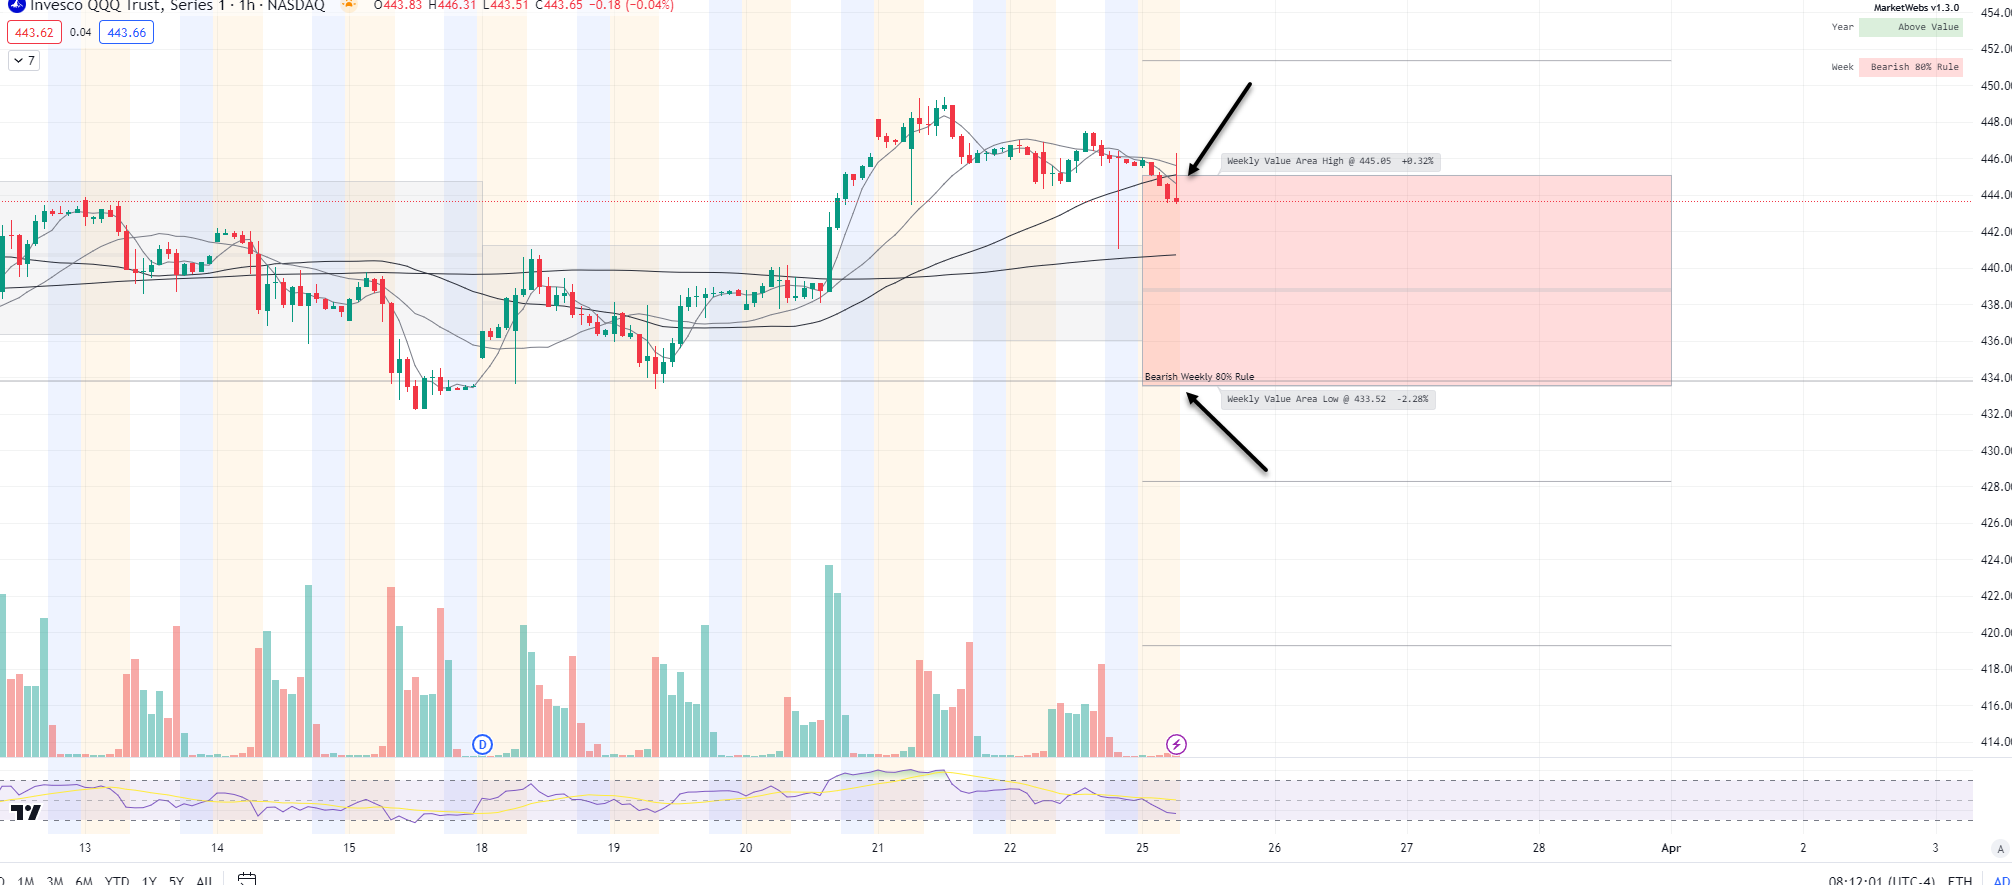
QQQ - NDX 100 ETF - Daily chart: Price ind. -0.6% this morning and underperforming. Support down at $438.48
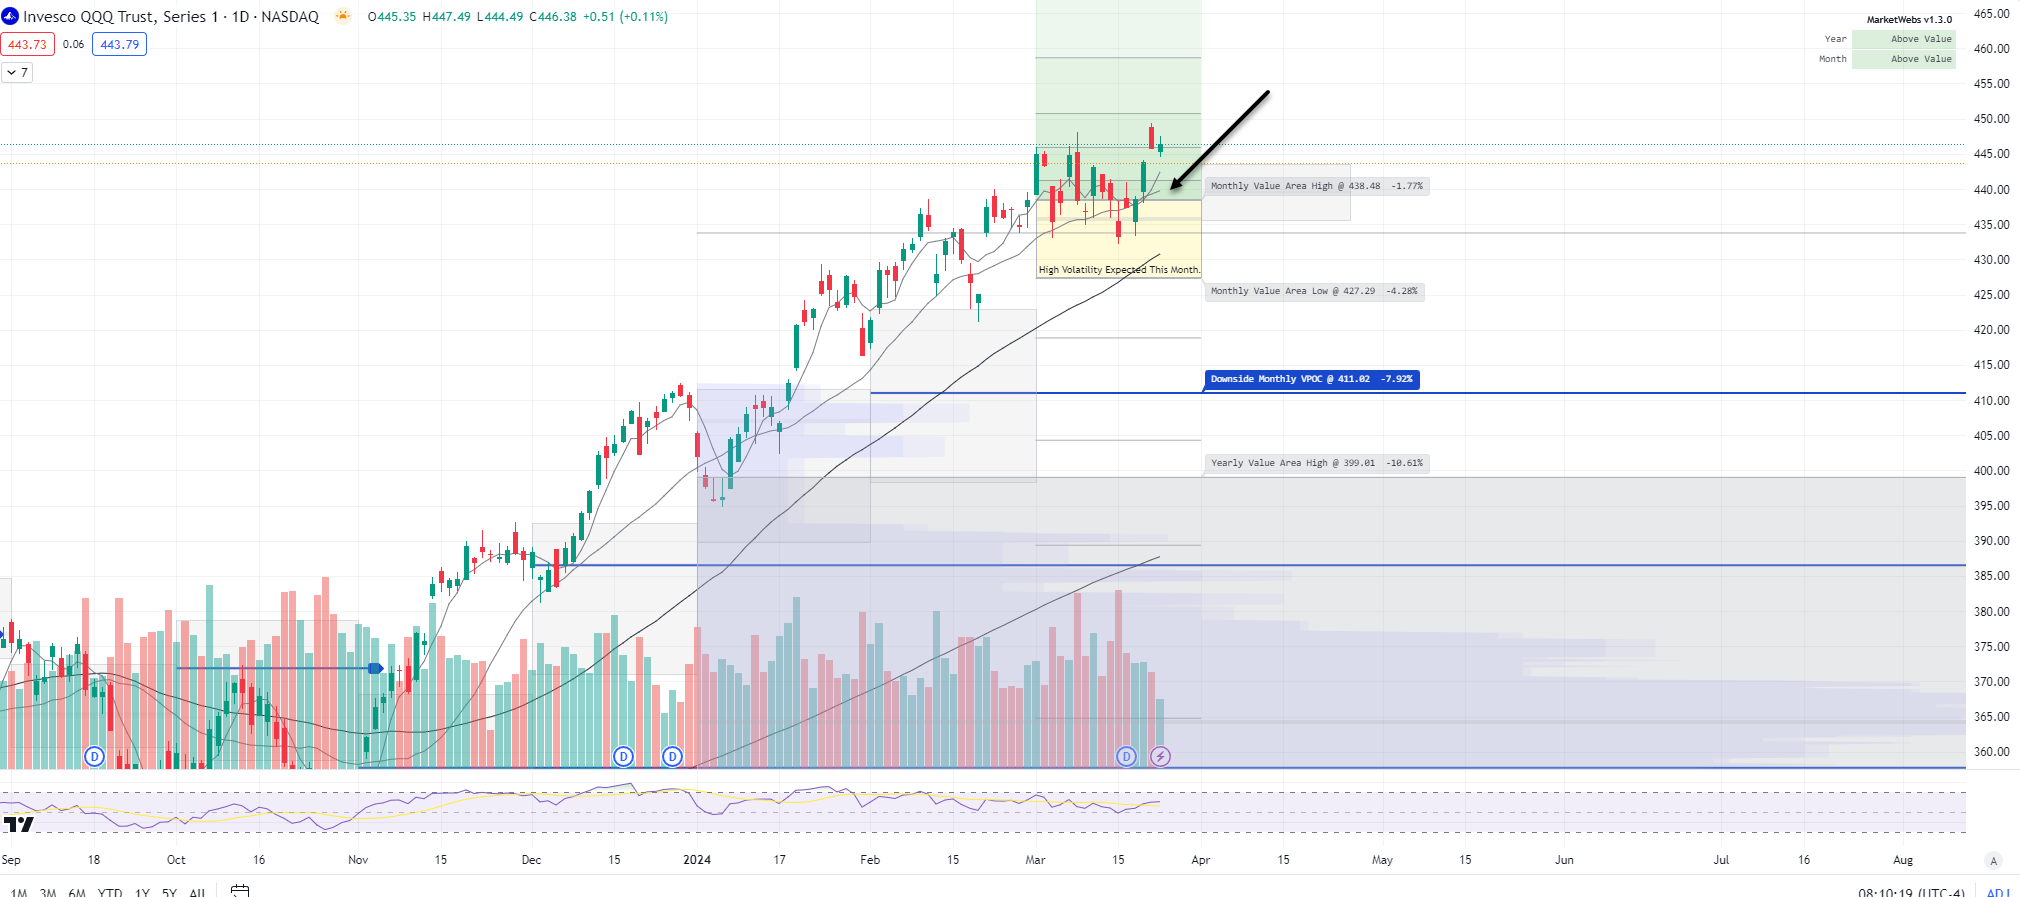
1hr chart: Price has slipped into its Value Area for the week which has triggered the 80% bearish rule - that rule would be cancelled if price can get back above $445.05
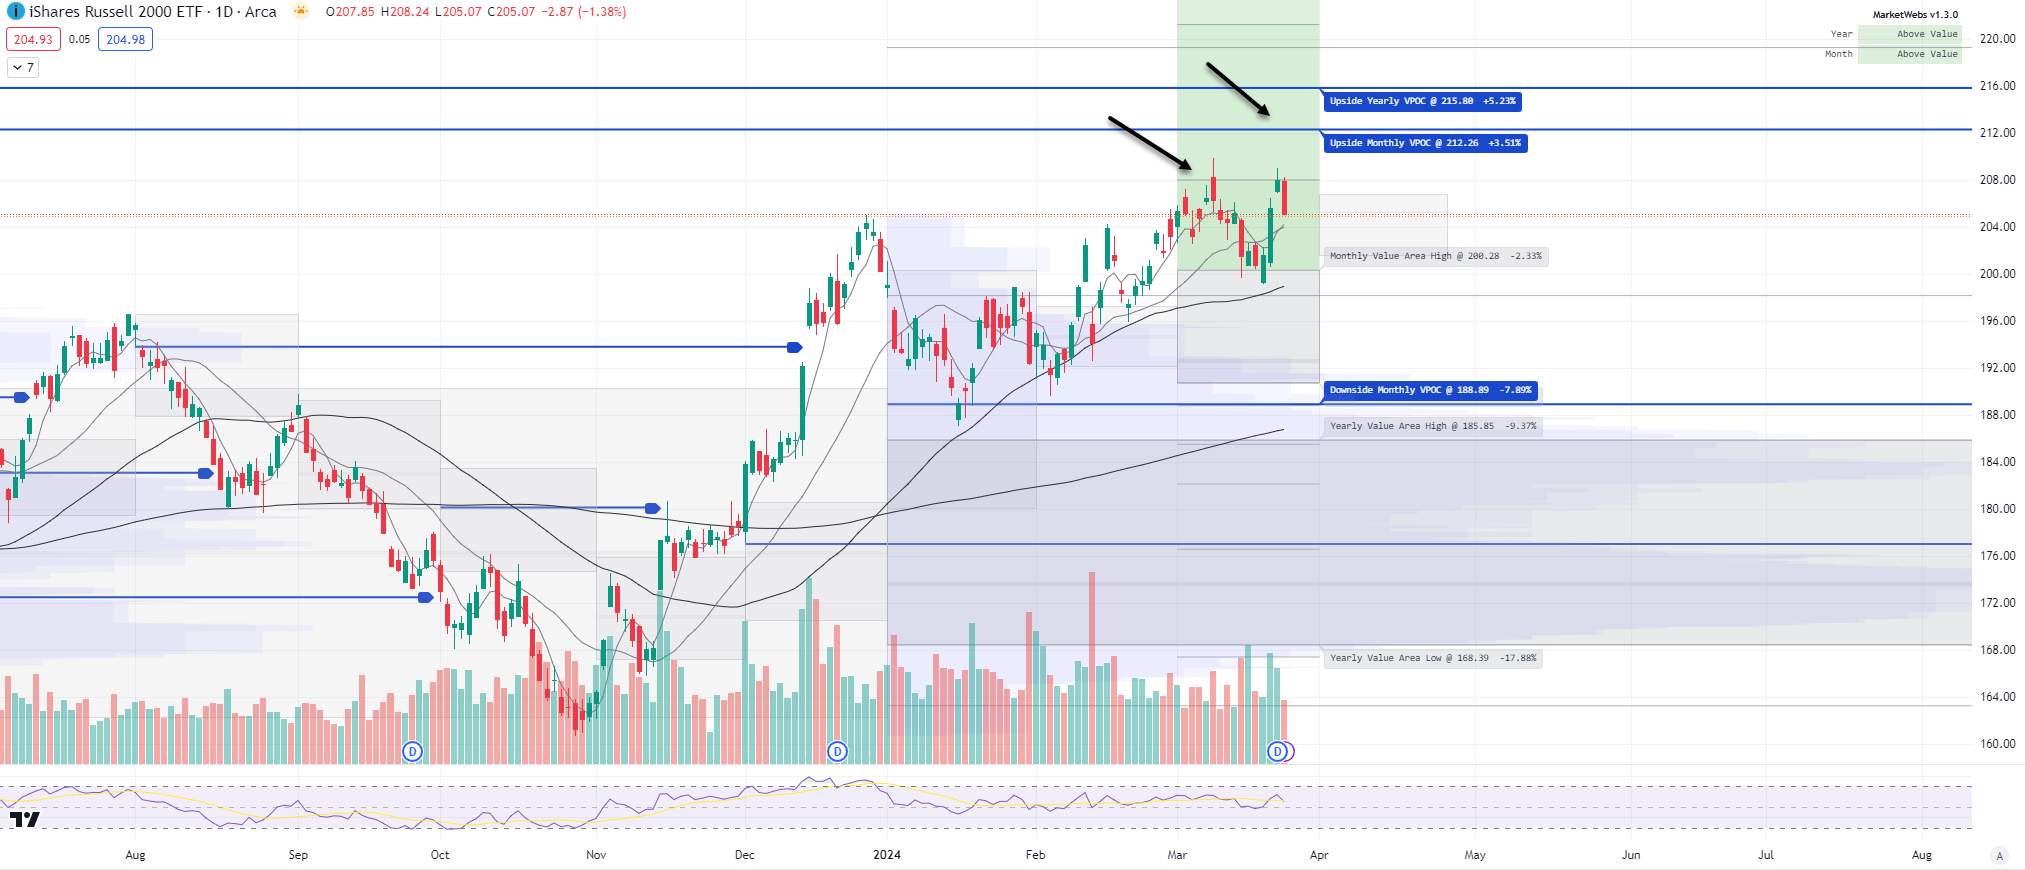
IWM - Russell Small Cap ETF- Price ind. -0.1% so outperforming the other indices slightly. Note price was not able to get above the 3/8 highs and something to keep an eye on.
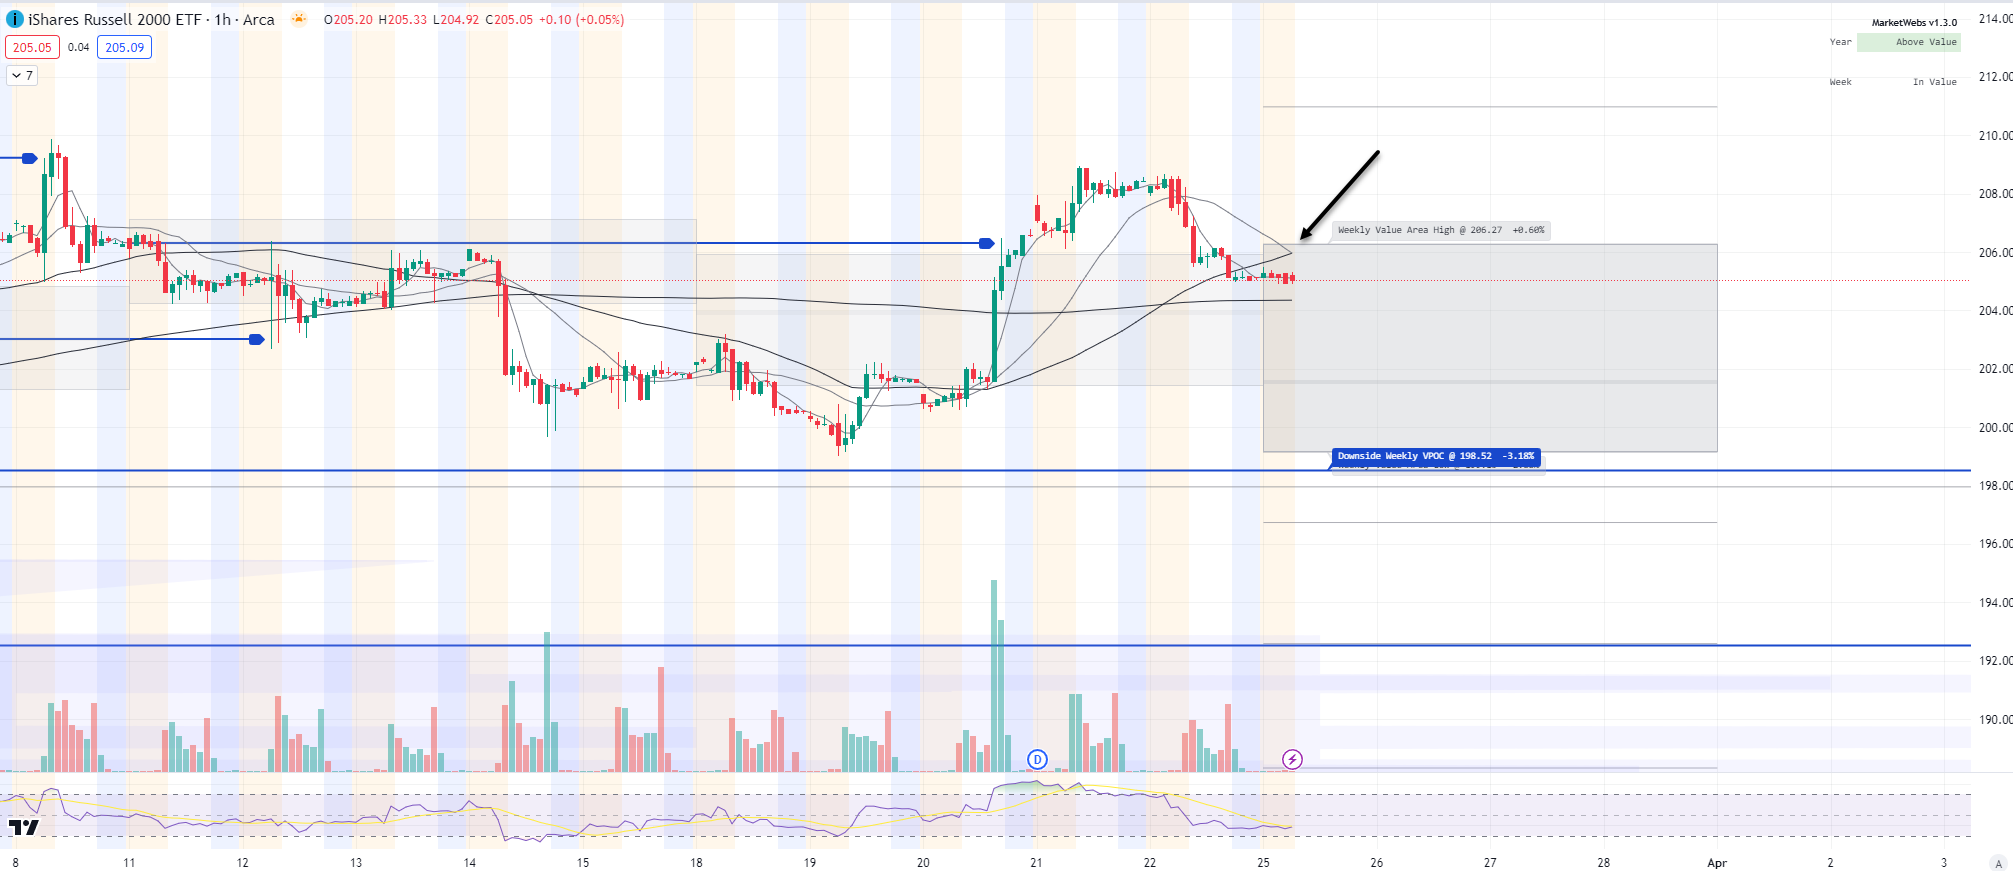
1hr chart: Price starts the week inside its Value Area, resistance up at $206.27
Here is today’s TTG Proprietary Stock Screen “Out of the Box” using Volume At Price
names trending above their Value Areas (on 3 multiple timeframes & not super extended)
Keep reading with a 7-day free trial
Subscribe to The Tribeca Trade Group to keep reading this post and get 7 days of free access to the full post archives.