

TTG Index Charts & Out of the Box Stock Screen 7/26/24
TTG Index Charts & Out of the Box Stock Screen 7/26/24
Out of the Box MarketWebs Screen
US Dollar flat / 30yr Bonds +0.2% / Crude -0.4% & Nat Gas -0.4% / Gold +0.9% / Copper +0.4% / BTC +4.2%
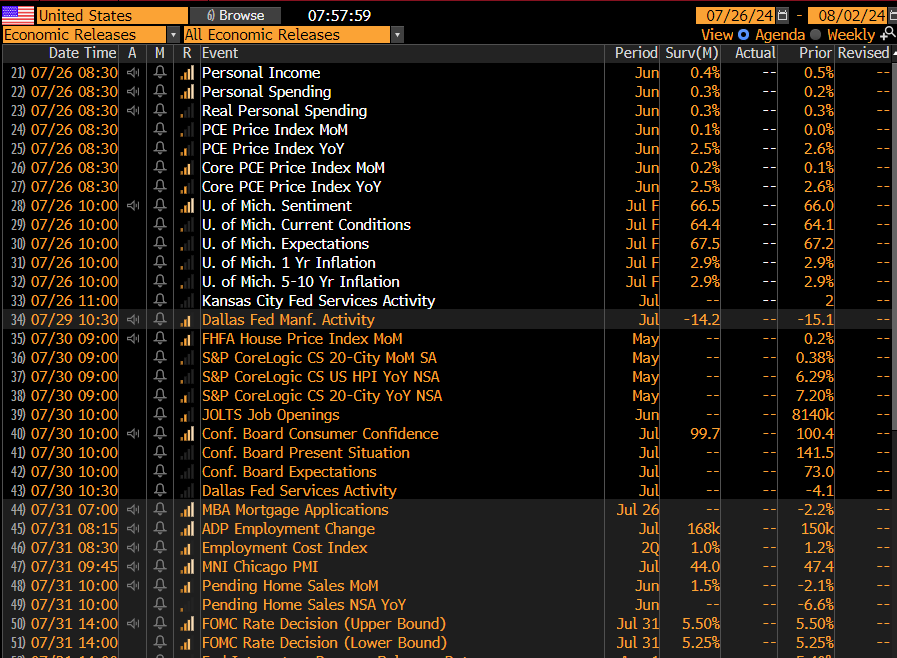
US Upcoming Economics
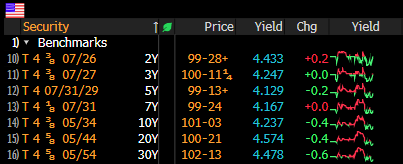
Bond Yields
Index Updates
At TTG, I use Volume At Price in my chart analysis and I use the MarketWebs Indicator to provide Value Areas & VPOCs which indicate significant support & resistance levels. Learn More Here about Volume At Price and the MarketWebs.

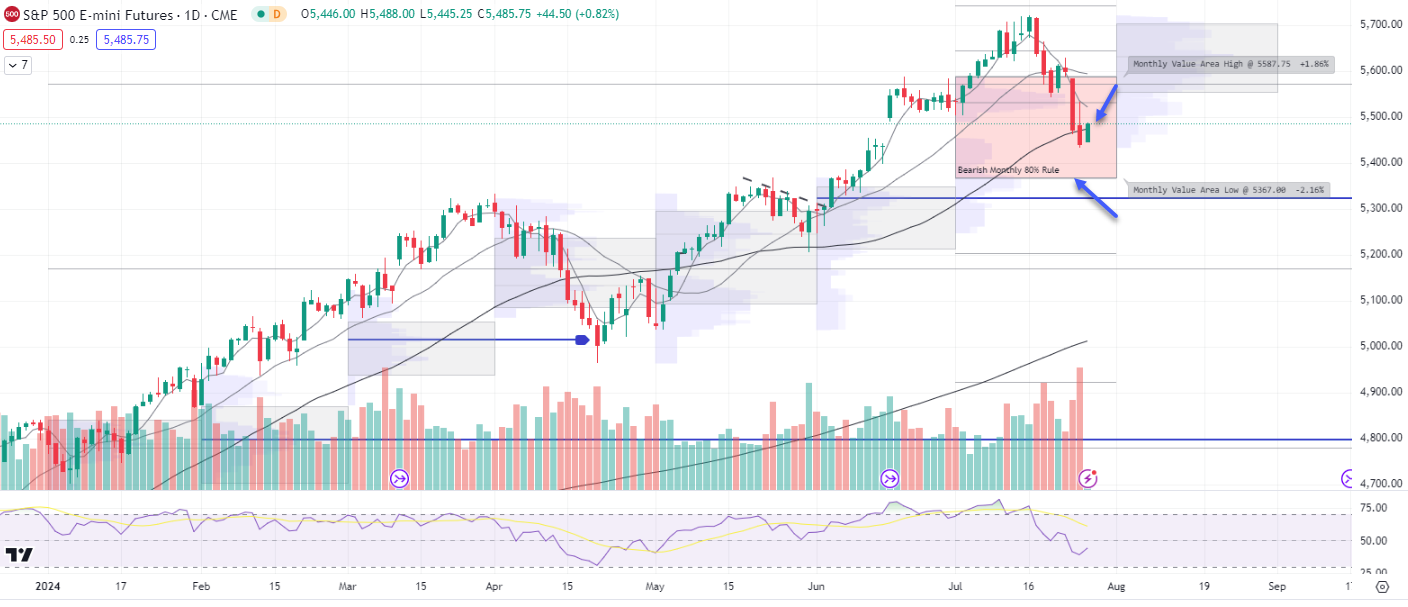
ES_F - SPX Futures - Daily chart: Prices bounce this morning ahead of monthly inflation data (PCE) and price is trying to regain its 50d MA. Note the #bearish 80% rule is in effect looking for a move down to the bottom of the July Value Area
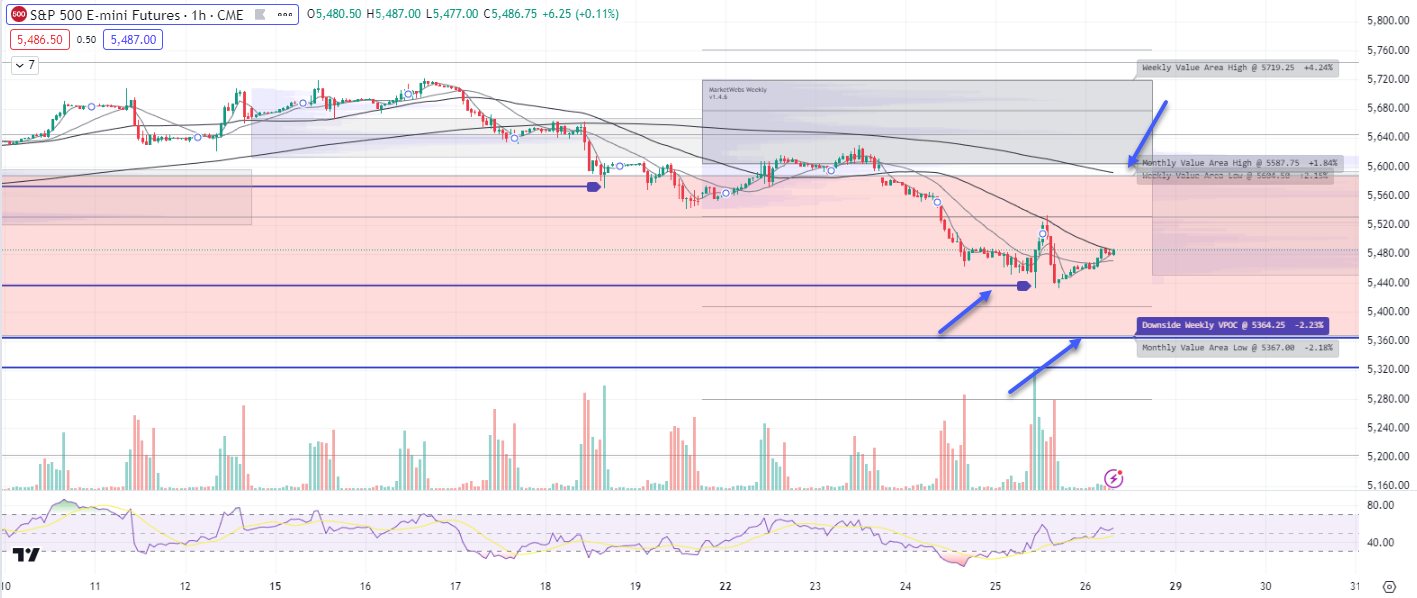
1hr chart: Price staying above that last VPOC takeout (blue line), as mentioned yesterday this was an area for a potential bounce. Now, let's see if price can stay above
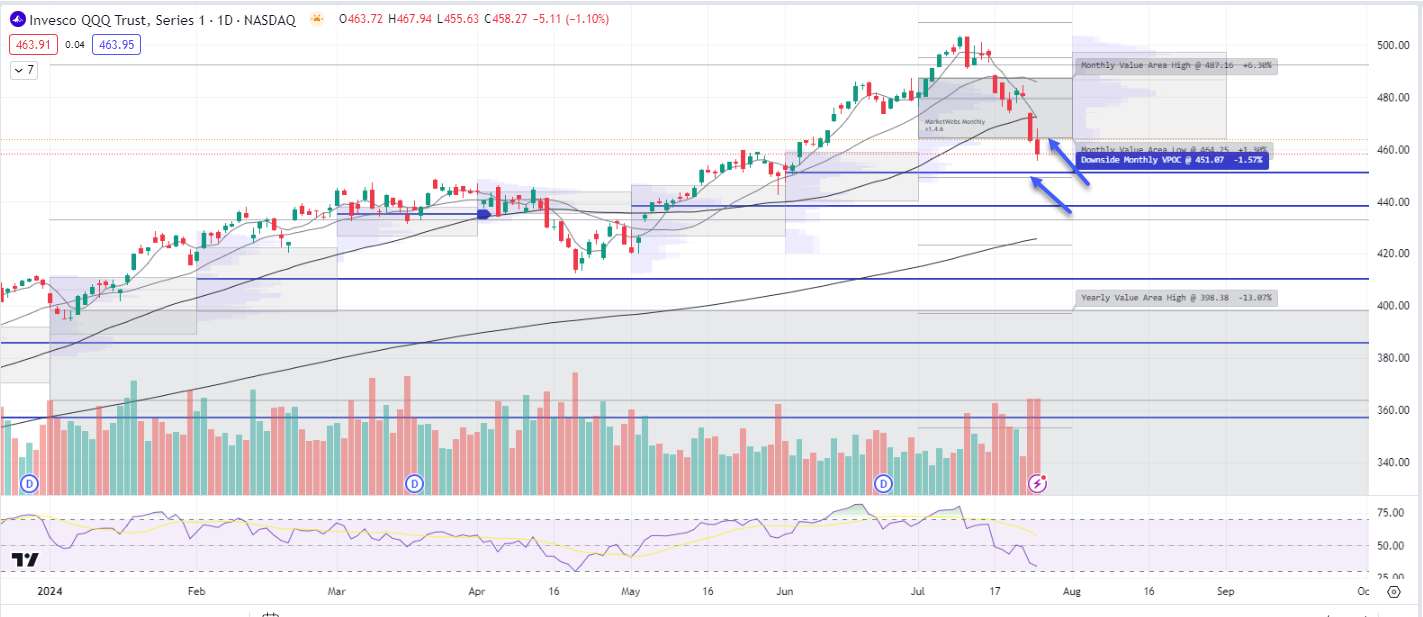
QQQ - NDX 100 ETF - Daily chart: Price ind +1.2% ahead of PCE data. Yesterday, price broke below its July Value Area and that will now be resistance to watch $464.25. Also, note VPOC lower at $451.07
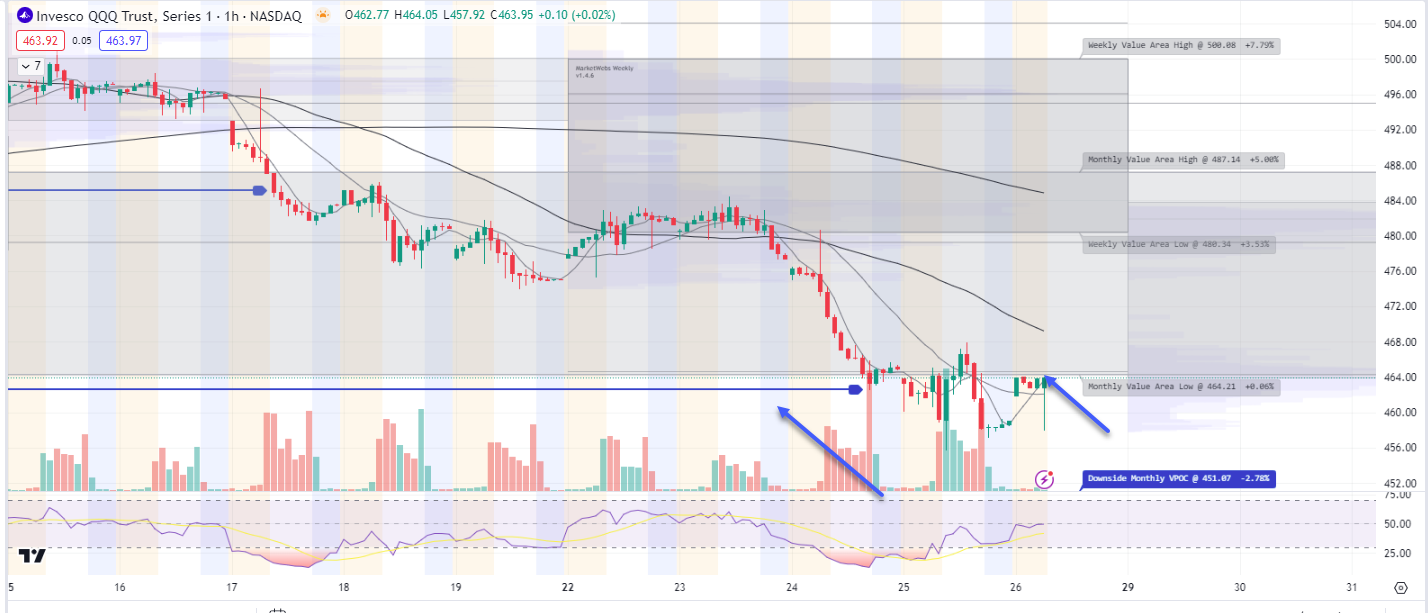
1hr chart: As mentioned in Daily Chart section watch that bottom of July Value Area, note, that lines up closely with the VPOC take out (blue line)
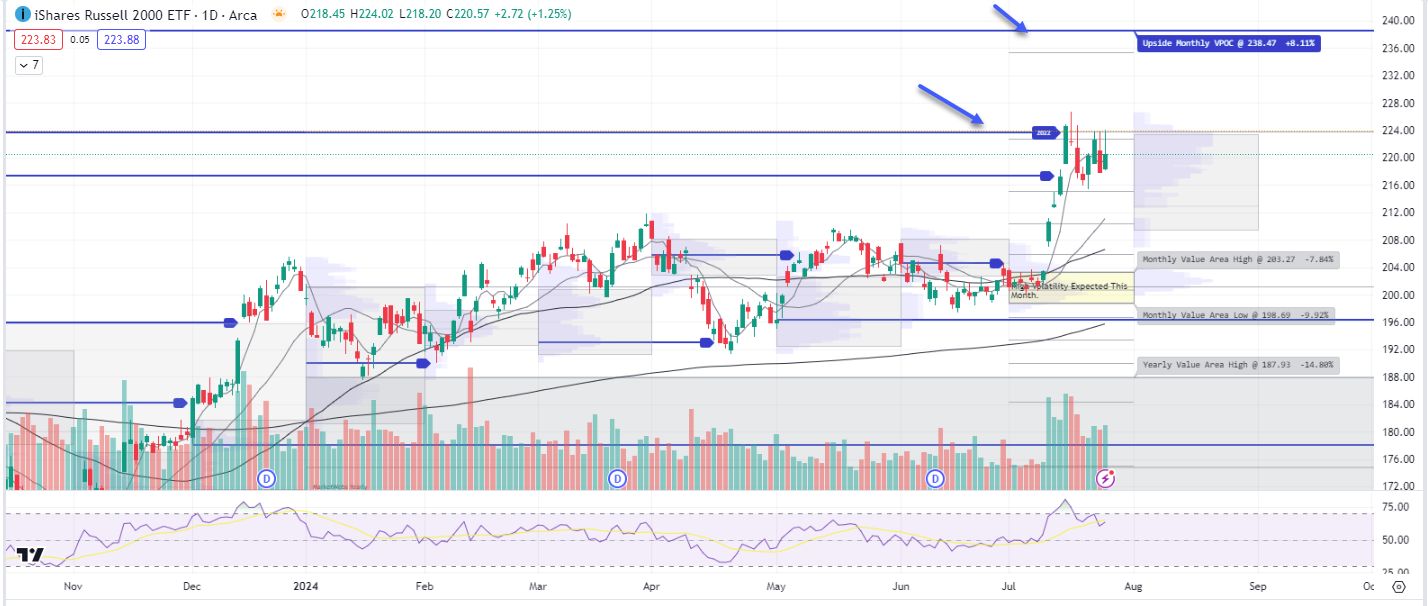
IWM - Russell Small Cap ETF- Daily Chart: Small Caps ind. +1.5% ahead of the PCE data at 8:30am and trying to resolve here out of bull pennant / flag. Note, price has had some difficultly closing in highs last two days.
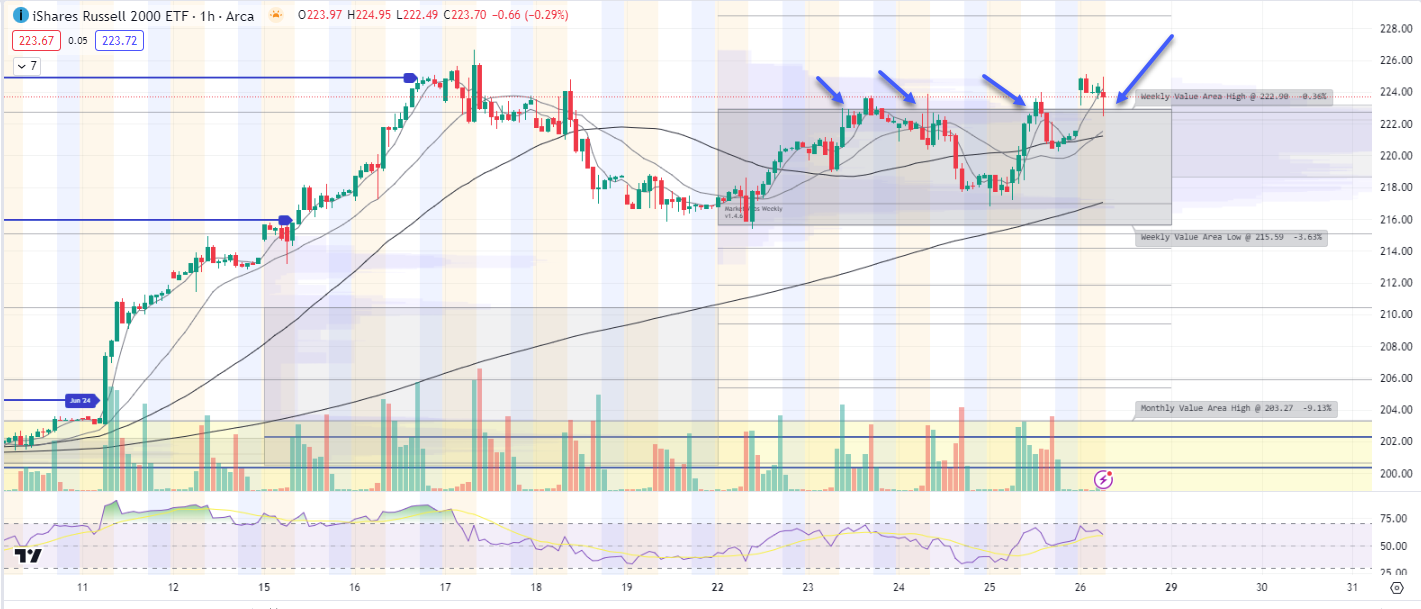
IWM 1hr chart: Interestingly, price is now through the top of this week's Value Area, an area that has been rejected a few times this week, watch $222.90
Here is today’s TTG Proprietary Stock Screen “Out of the Box” using Volume At Price
names trending above their Value Areas (on 3 multiple timeframes & not super extended)
Keep reading with a 7-day free trial
Subscribe to The Tribeca Trade Group to keep reading this post and get 7 days of free access to the full post archives.