

TTG Index Charts & Out of the Box Stock Screen 4/5/24
TTG Index Charts & Out of the Box Stock Screen 4/5/24
Out of the Box MarketWebs Screen
US Dollar +0.1% / 30yr Bonds -0.3% / Crude -0.1% & Nat Gas -0.1% / Gold +0.1% / Copper -0.8% / BTC -2.8%
US Upcoming Economics

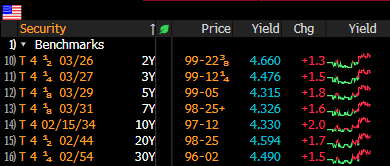
US Bond Yields
Index Updates
At TTG, I use Volume At Price in my chart analysis and I use the MarketWebs Indicator to provide Value Areas & VPOCs which indicate significant support & resistance levels. Learn More Here about Volume At Price and the MarketWebs.
ES_F - SPX Futures - Daily chart: Prices bouncing a touch this morning ahead of the monthly Jobs report. Price finally broke the uptrend channel and sank into the Apr Value Area. The next support to watch is the bottom of the April Value Area 5157.5 as the #bearish 80% rule is in effect. Note, that lines up closely with the 50d MA . Resistance is 5245.5
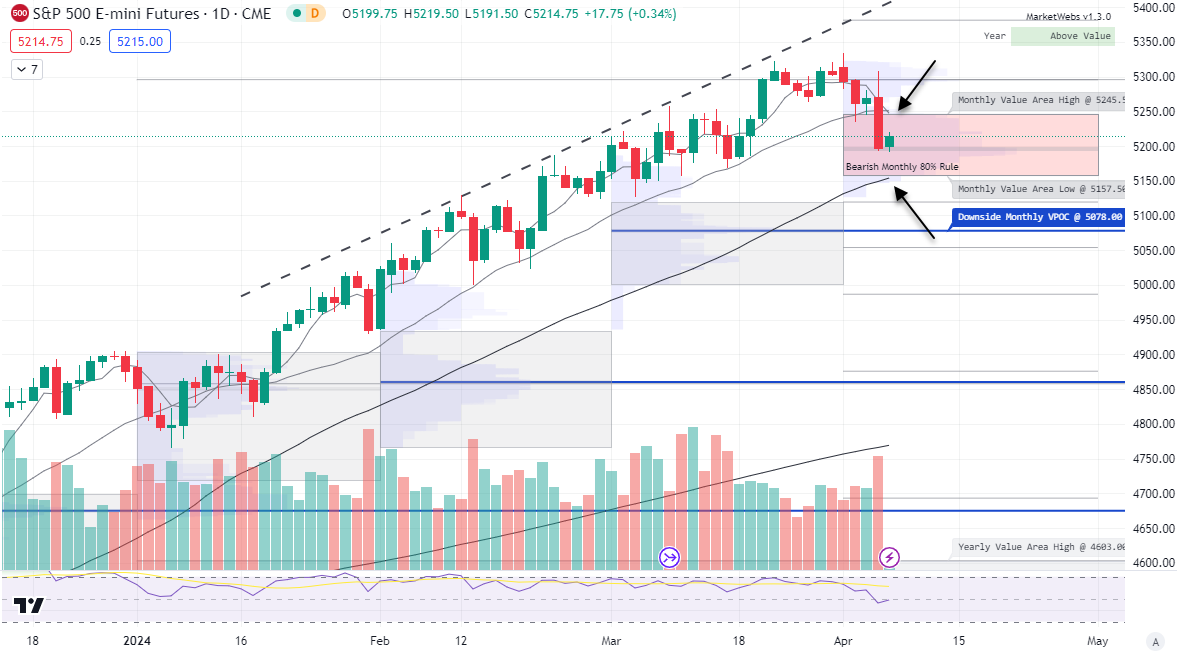
1hr chart: Price is below its Value Area for week, next downside VPOC is 5142.5

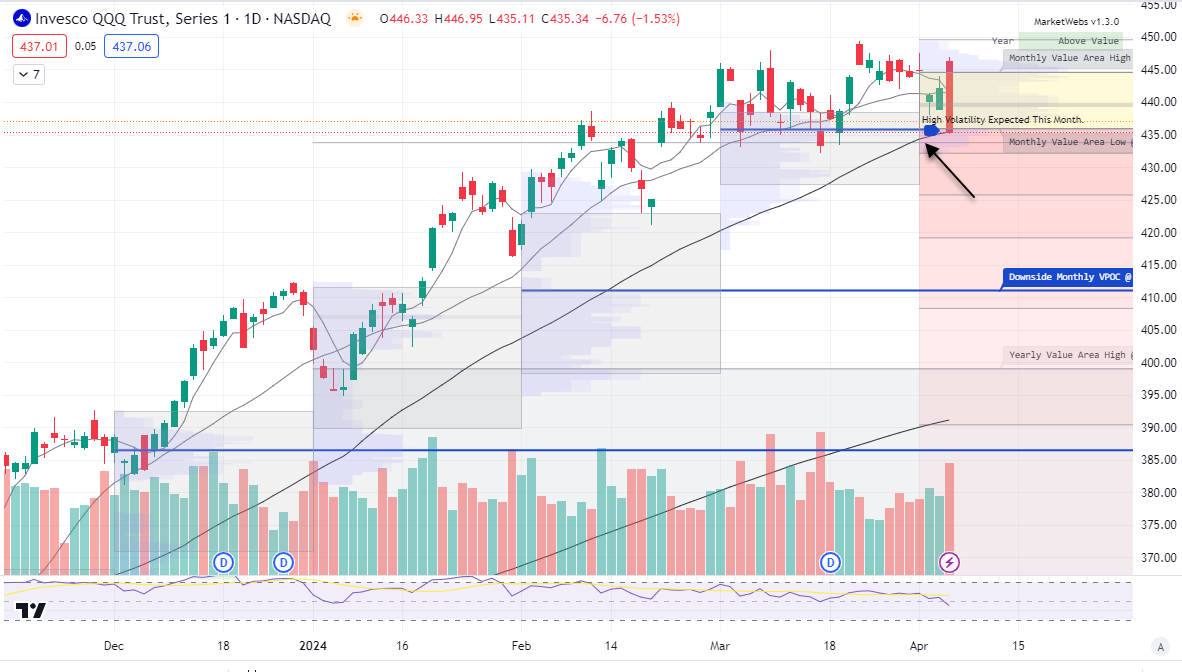
QQQ - NDX 100 ETF - Daily chart: That's one heck of a bearish engulfing/ reversal candle yesterday. Price tried to get back above its April Value Area and full on rejection and all the way down to its bottom of Value Area + 50d MA . Watch 50d MA & $435.85 support
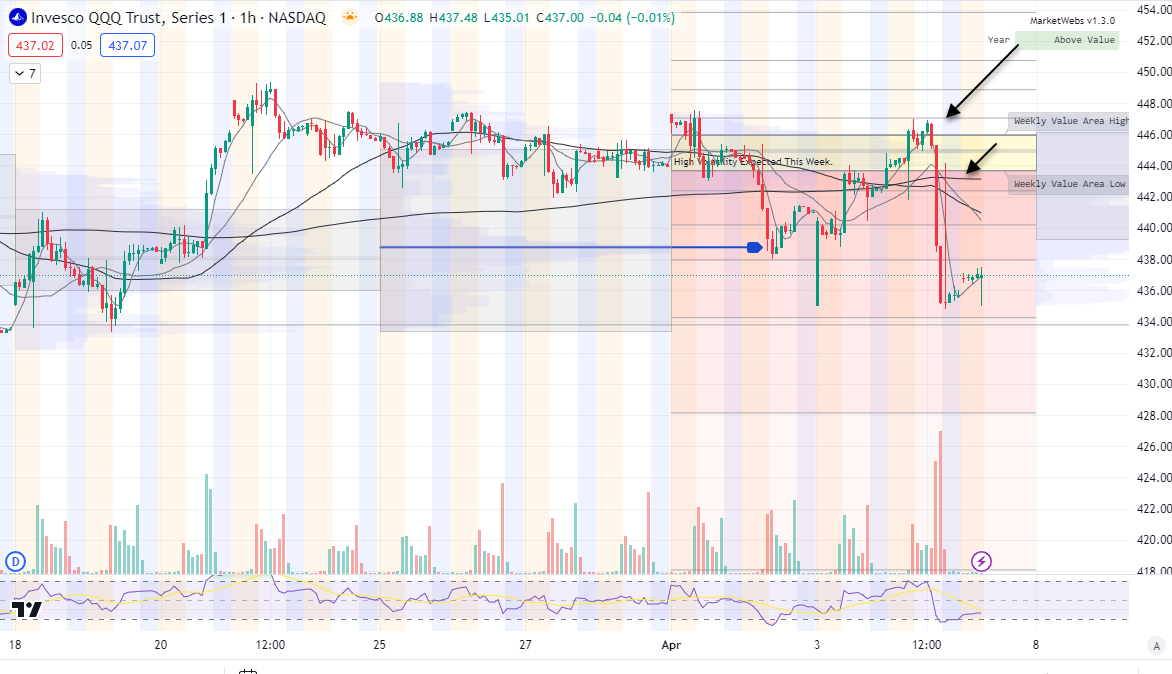
1hr chart: Price was also rejected at this week's top of Value Area and is decently below Value
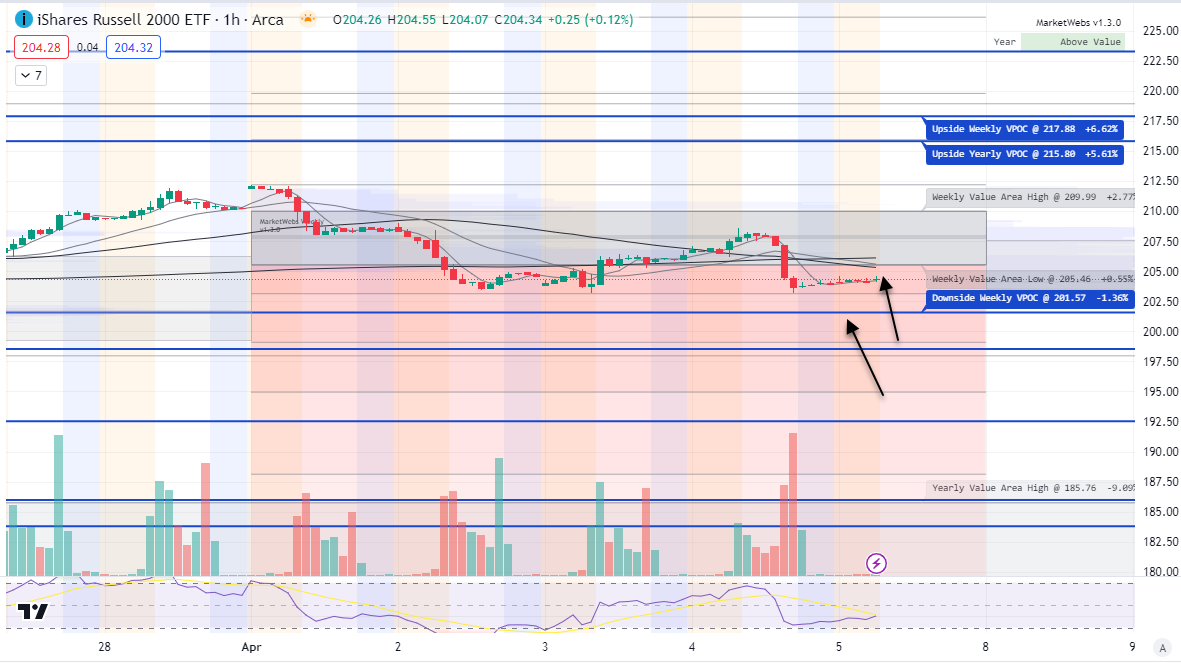
IWM - Russell Small Cap ETF- Price also was rejected at its April top of Value Area and now downside levels to watch area $202.05 bottom of Value Area and 50d MA

1hr chart: Price is below its Value Area for week, resistance to watch $205.46 and there are lower VPOCs to watch
Here is today’s TTG Proprietary Stock Screen “Out of the Box” using Volume At Price
names trending above their Value Areas (on 3 multiple timeframes & not super extended)
Keep reading with a 7-day free trial
Subscribe to The Tribeca Trade Group to keep reading this post and get 7 days of free access to the full post archives.