

TTG Index Charts & Out of the Box Stock Screen 4/15/24
TTG Index Charts & Out of the Box Stock Screen 4/15/24
Out of the Box MarketWebs Screen
US Dollar flat / 30yr Bonds -0.1% / Crude -1.0% & Nat Gas -2.0% / Gold +0.0% / Copper +1.2% / BTC -1.0%
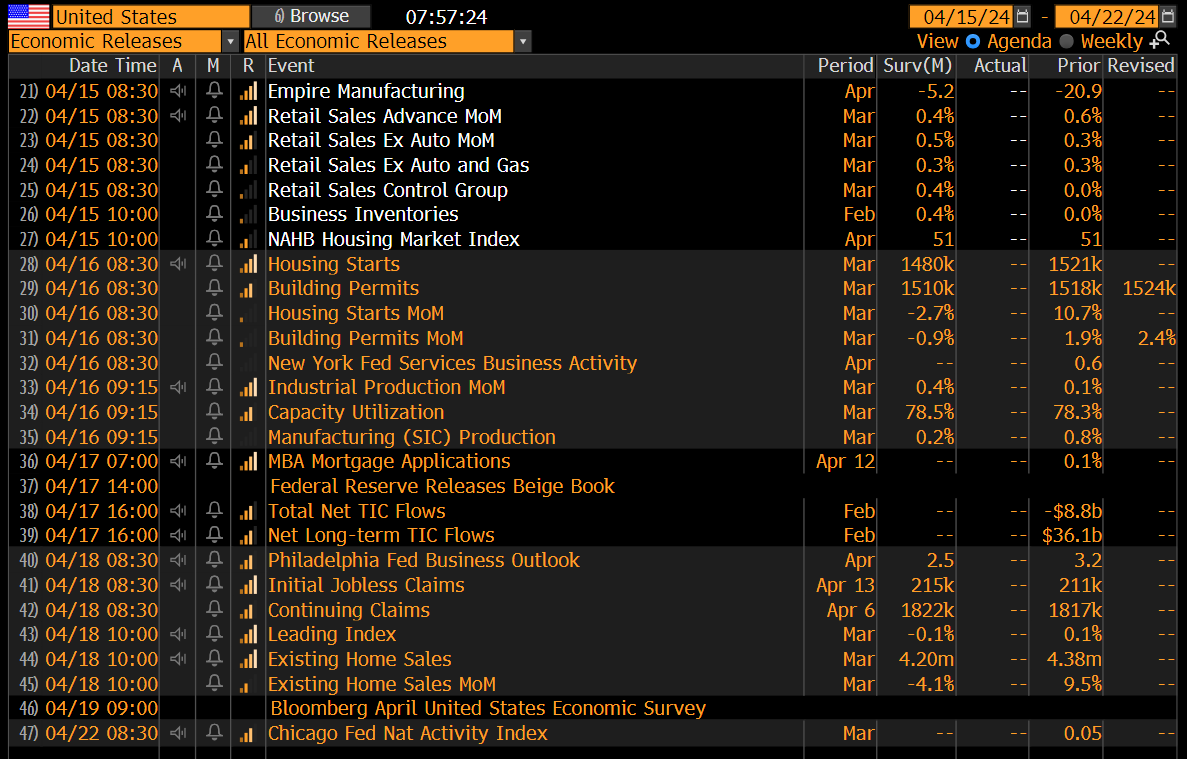
US Upcoming Economics
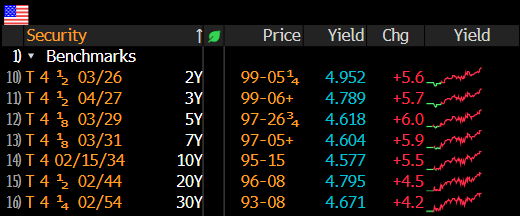
US Bond Yields
Index Updates
At TTG, I use Volume At Price in my chart analysis and I use the MarketWebs Indicator to provide Value Areas & VPOCs which indicate significant support & resistance levels. Learn More Here about Volume At Price and the MarketWebs.
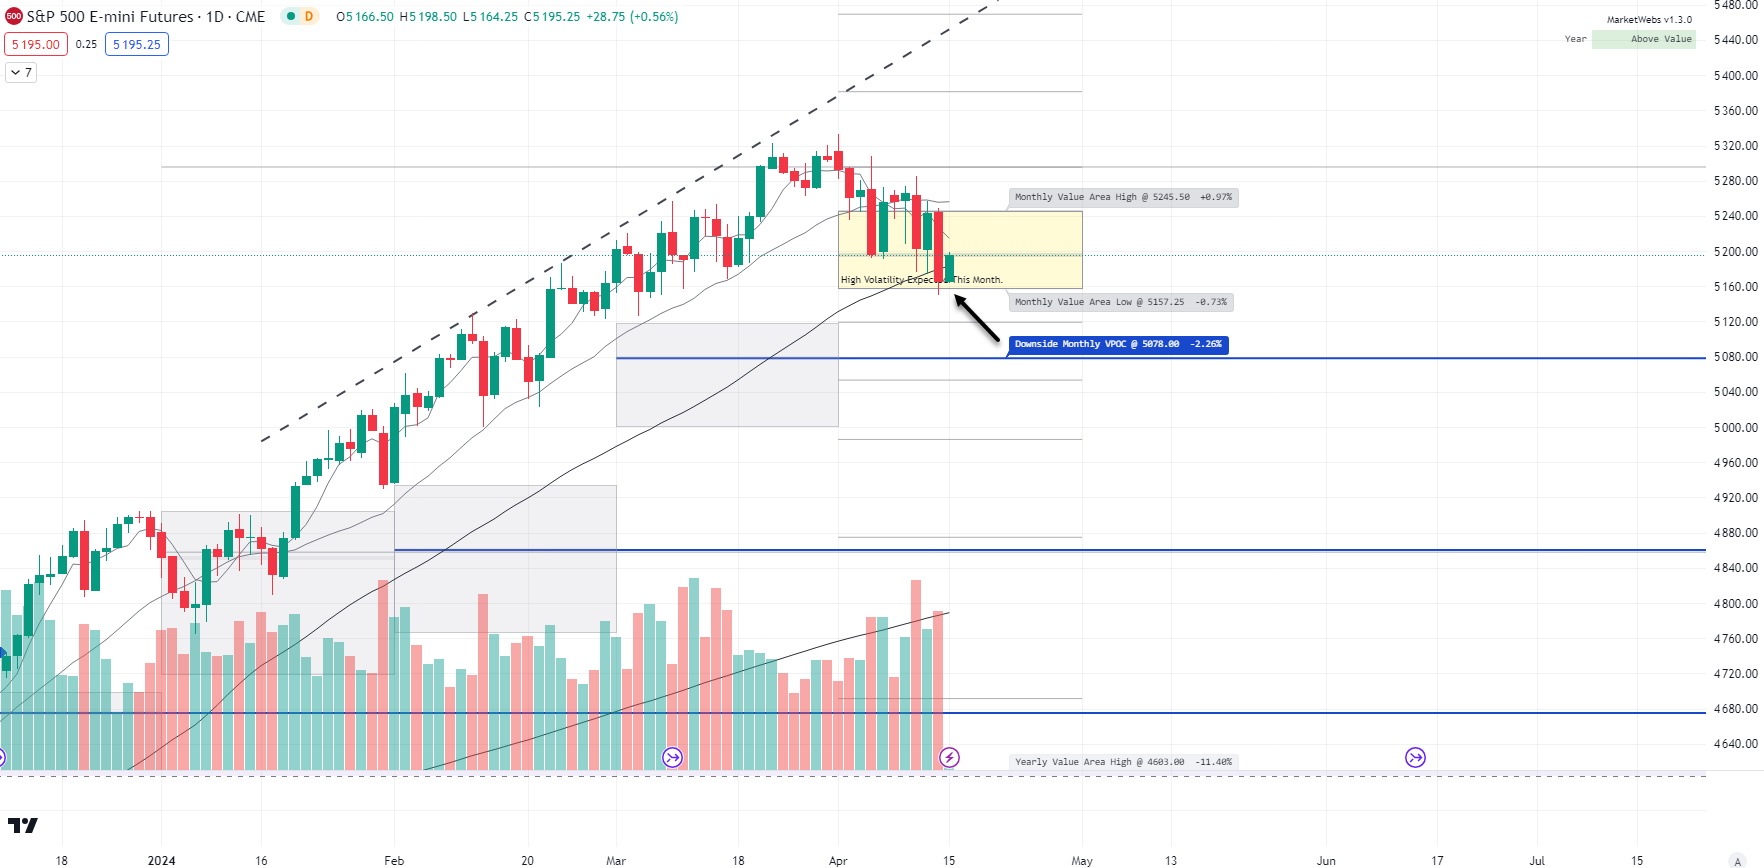
ES_F - SPX Futures - Daily chart: Price bouncing this morning. ind. +0.5% after testing its bottom of Apr Value Area, and the #bearish 80% rule completed on Friday with a move down to the bottom of Value Area. The support level to watch now is 5157.5.
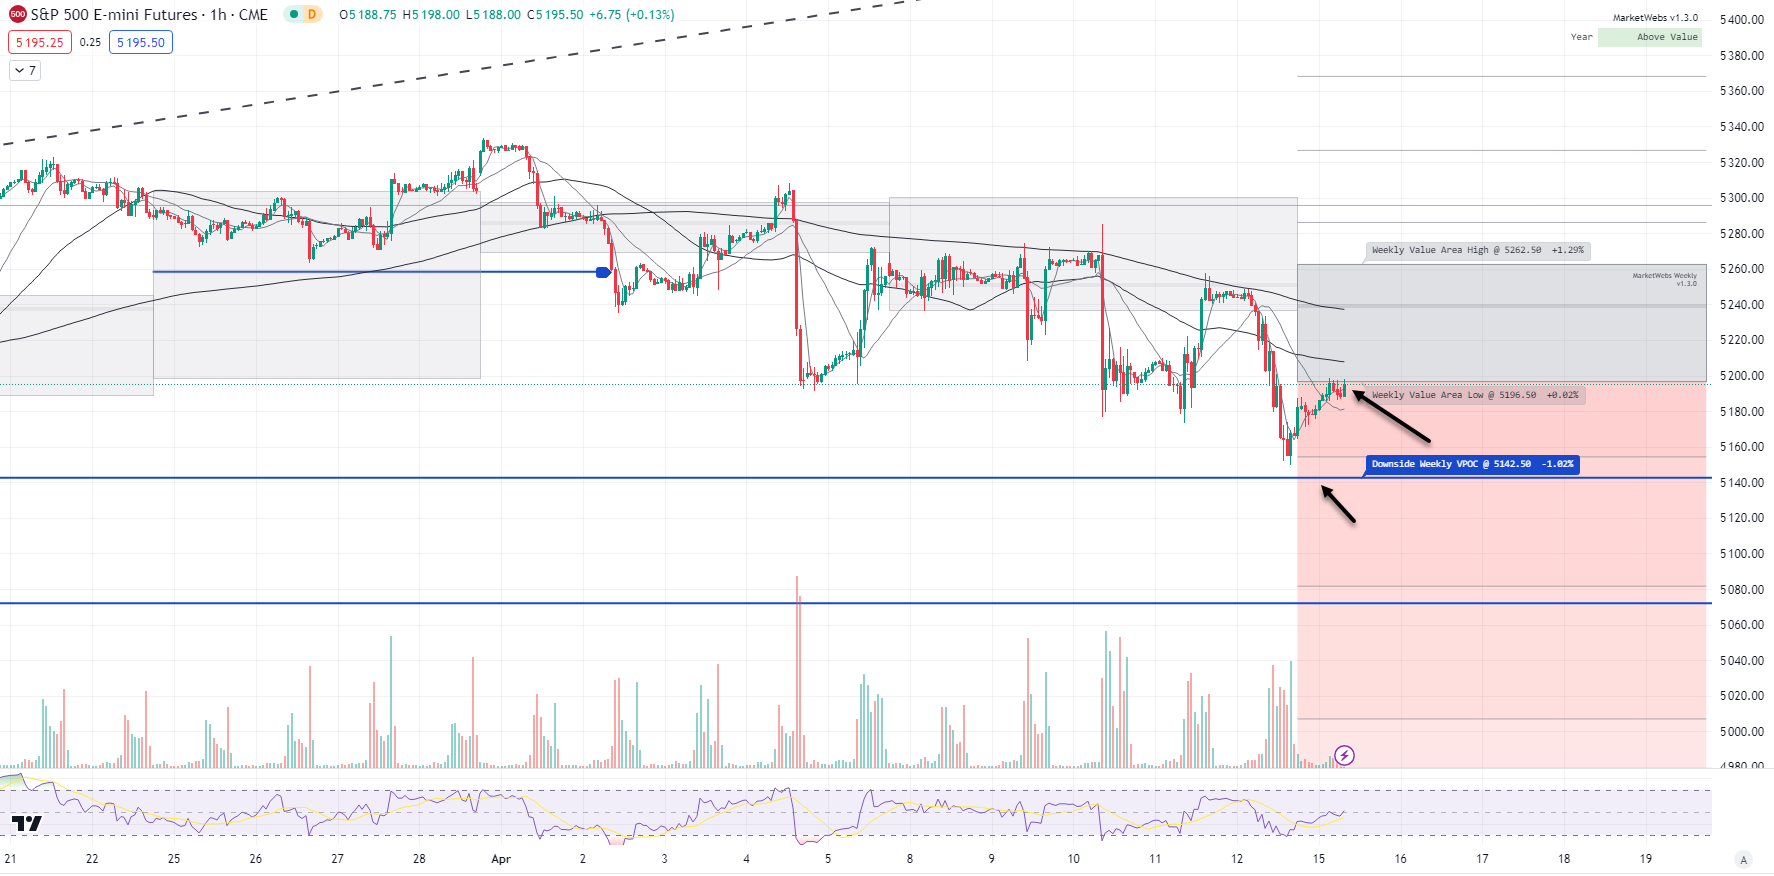
1hr chart: Price starts the week below its new Value Area for week and short-term resistance level to watch is 5196.50 - this will be important to see price get into its Value Area vs trending lower
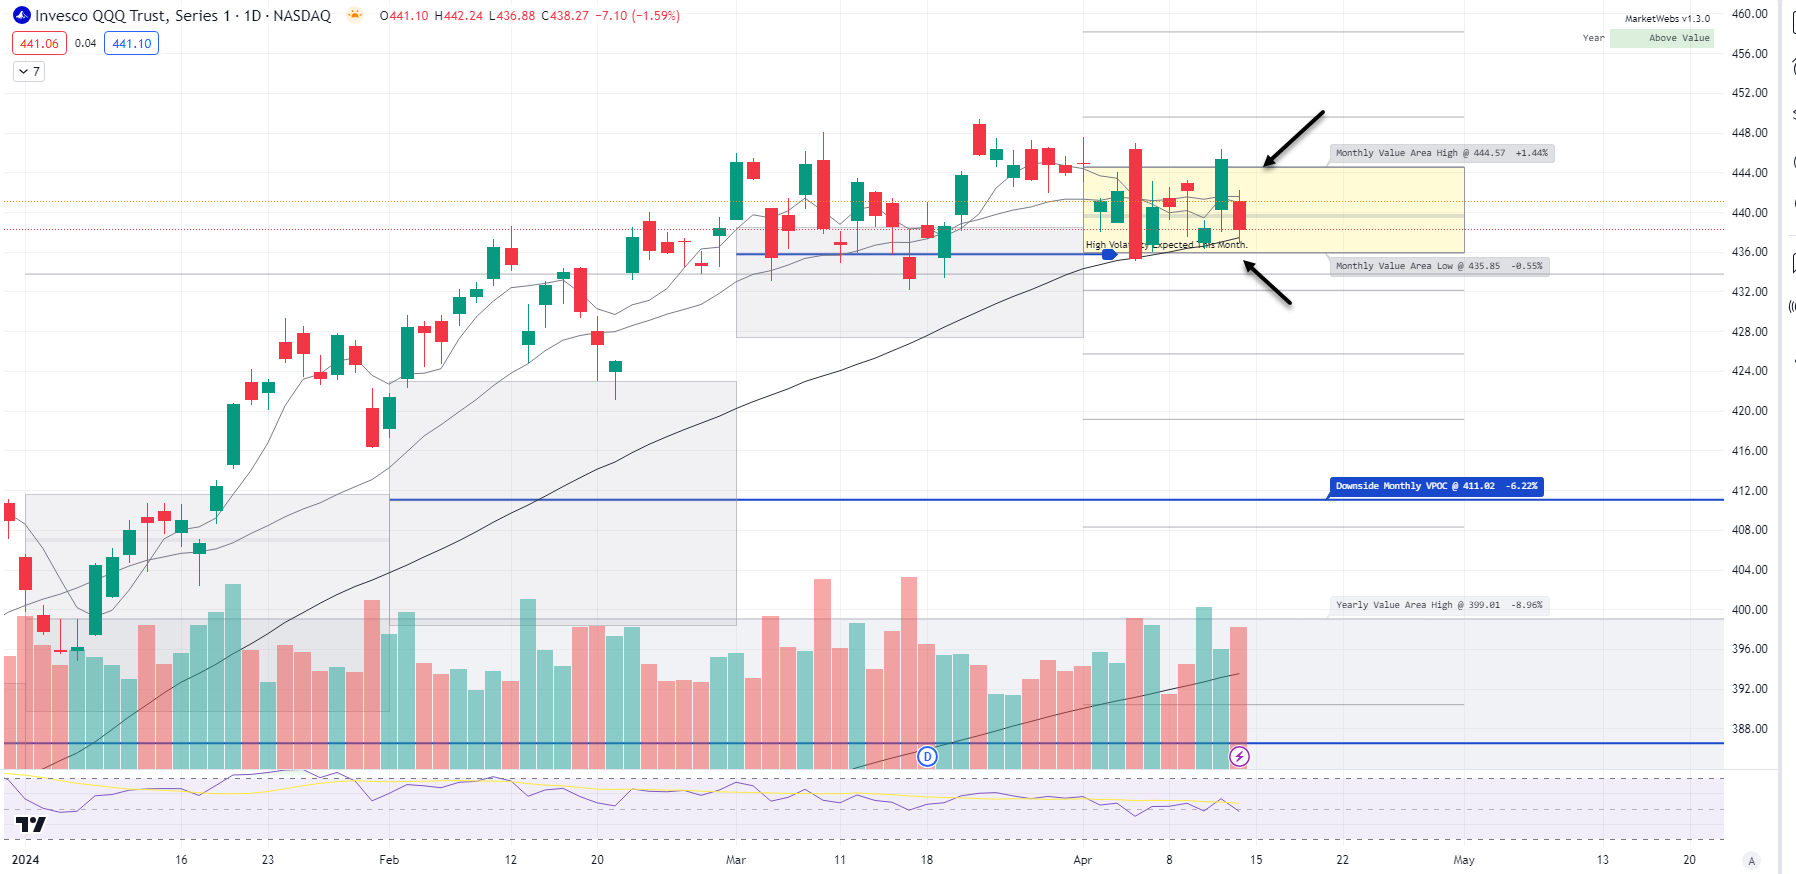
QQQ - NDX 100 ETF - Daily chart: QQQ ind. +0.6% this morning and holding within its April Value Area - so no break higher (Thurs) and no break lower (Fri) , price remains inside its April Value Area, the chop continues for the QQQs; levels to watch below
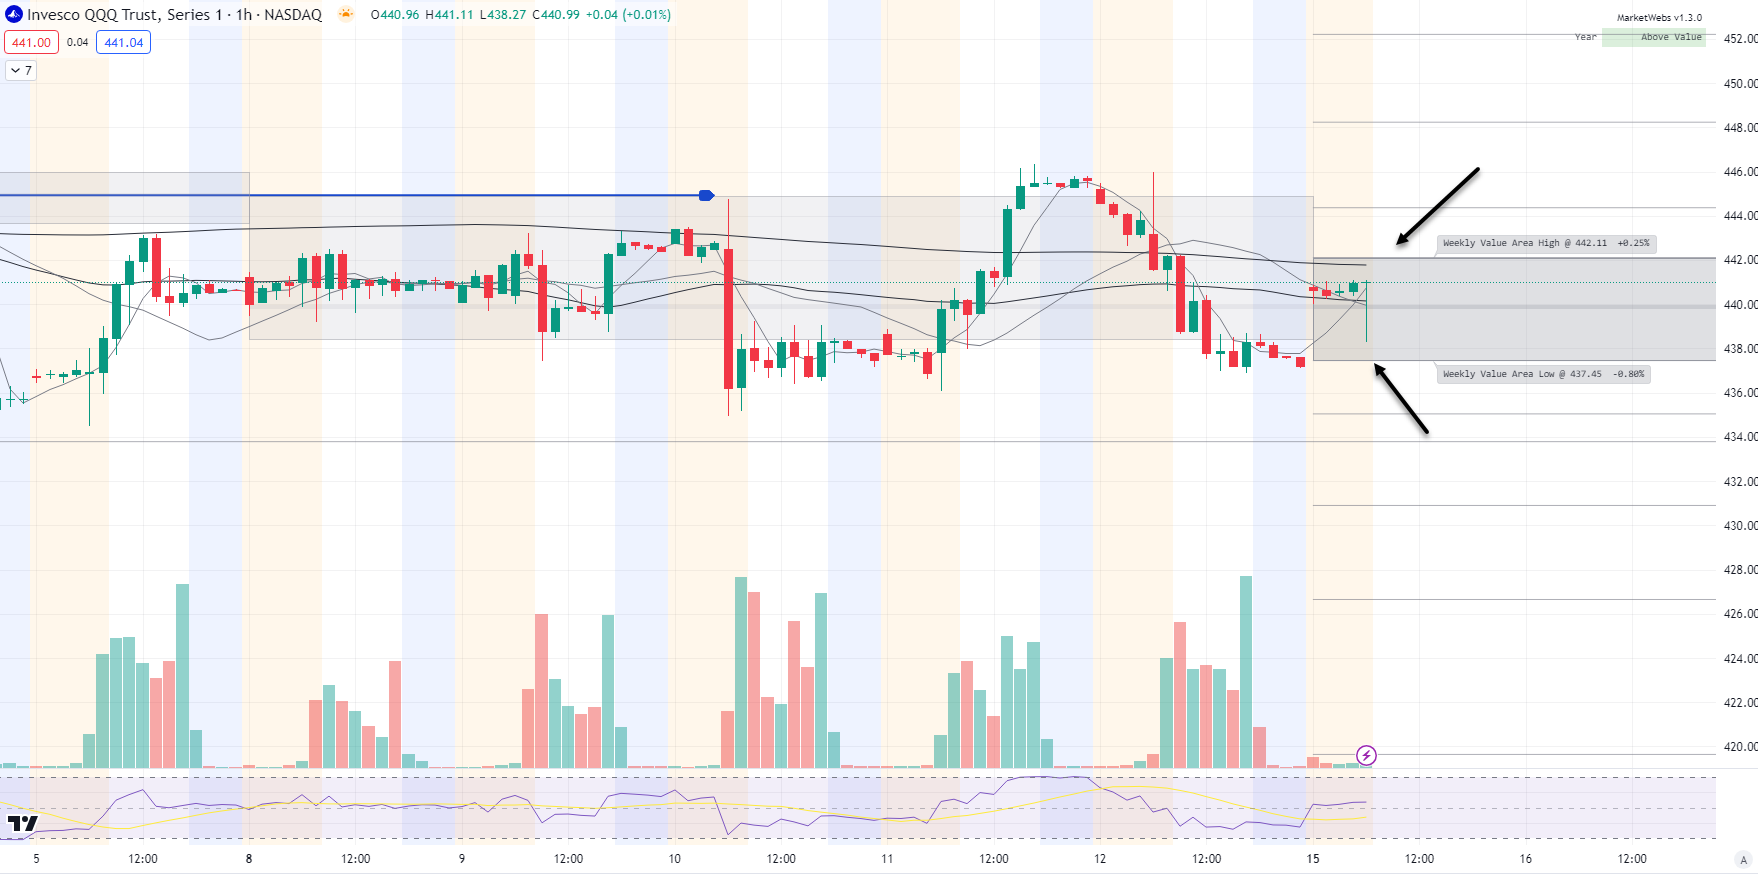
1hr chart: Differently than the S&P, price starts the week inside its new Value Area (so a bit stronger), support to watch $437.35 & / resistance $442.11
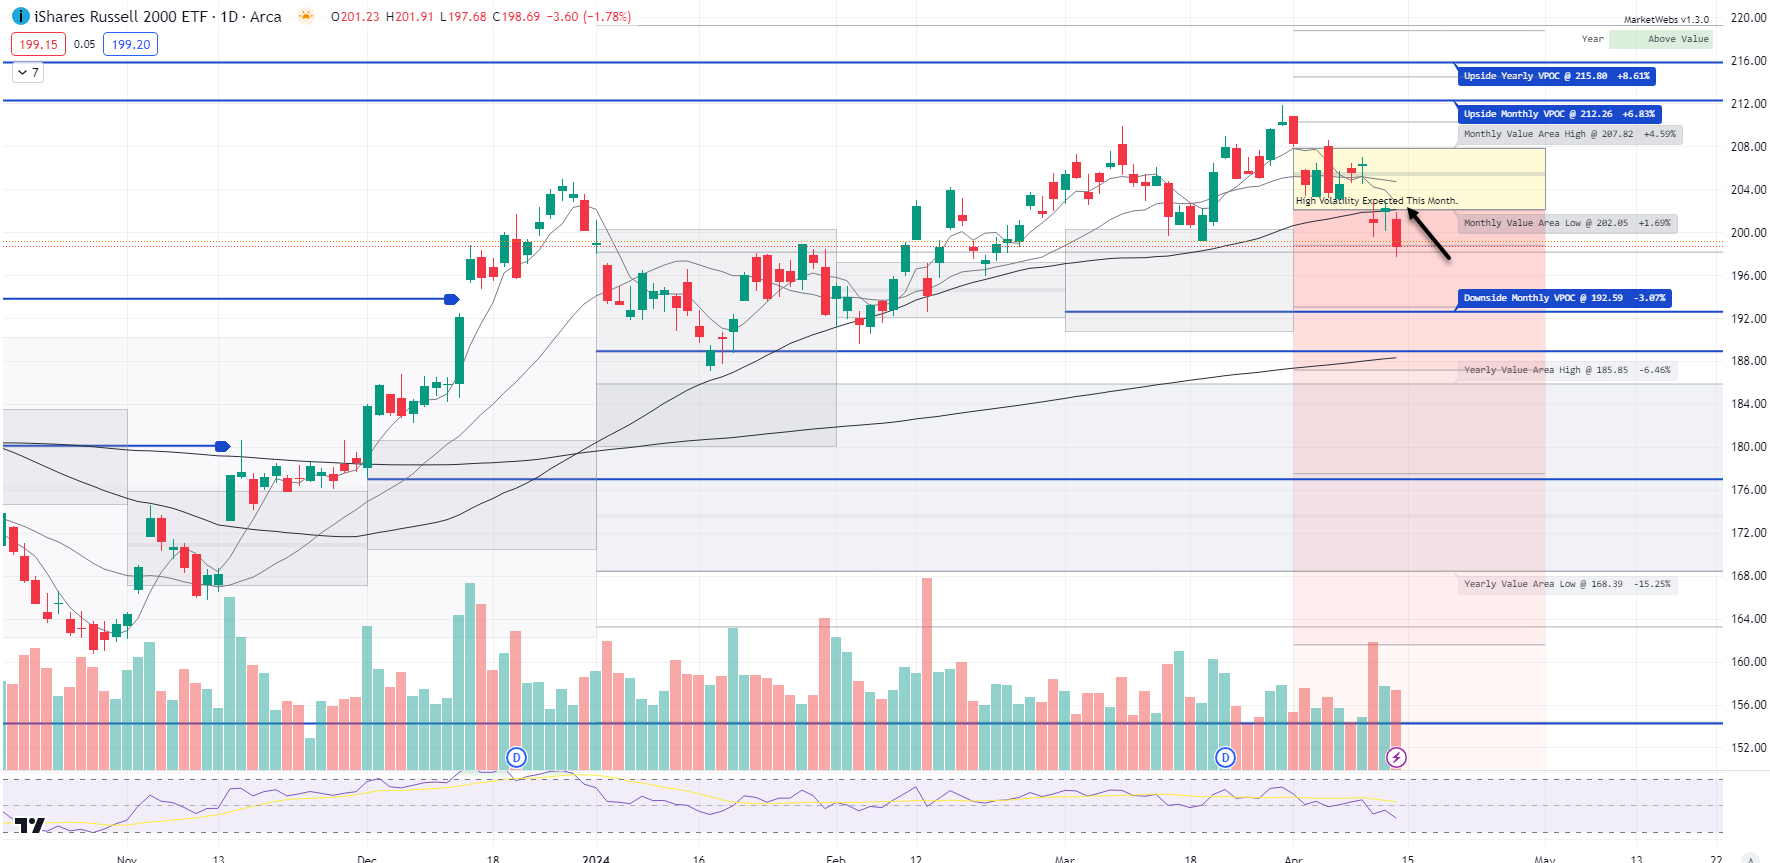
IWM - Russell Small Cap ETF- Price continuing to underperform (+0.2%) the other indices. Price is now decently below its April Value Area and beginning to trend lower , resistance to watch for things to change here is $202.05
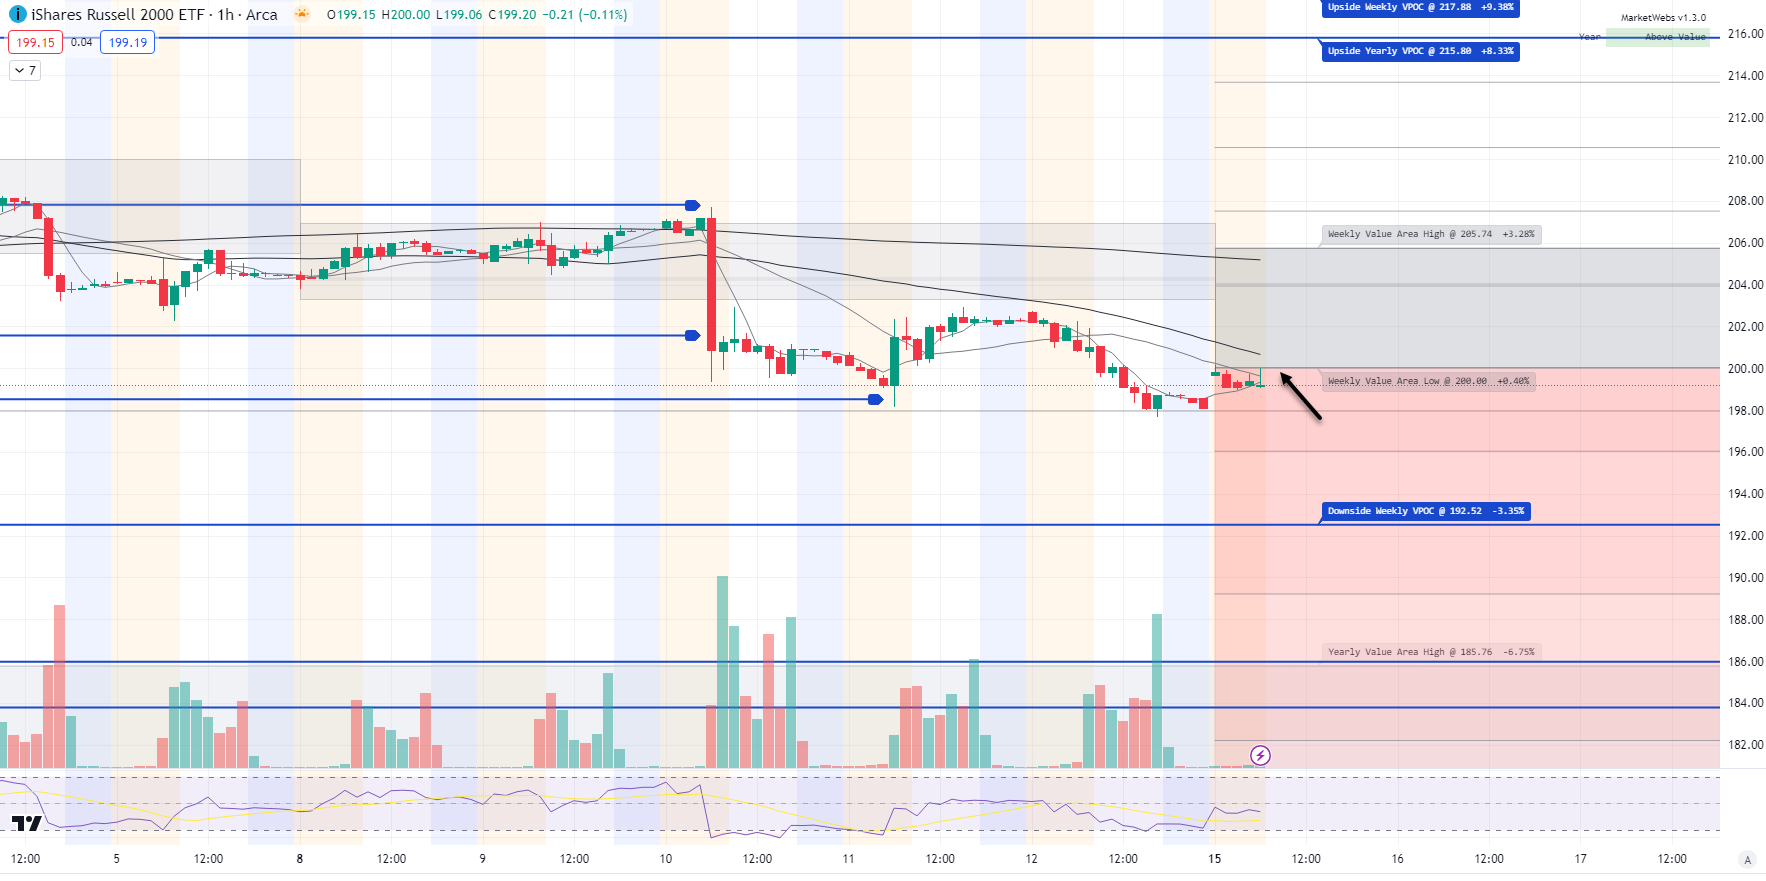
1hr chart: Price starts the week just below this week's Value Area, watch $200 (nice easy to remember level)
Here is today’s TTG Proprietary Stock Screen “Out of the Box” using Volume At Price
names trending above their Value Areas (on 3 multiple timeframes & not super extended)
Keep reading with a 7-day free trial
Subscribe to The Tribeca Trade Group to keep reading this post and get 7 days of free access to the full post archives.