
TTG Index Charts & Out of the Box Stock Screen 3/11/24 $SQ
TTG Index Charts & Out of the Box Stock Screen 3/11/24 $SQ
Out of the Box MarketWebs Screen
US Dollar flat / 30yr Bonds +0.3/ Crude -0.6% & Nat Gas -0.8% / Gold flat / Copper +0.5% / BTC +3.7%
US Upcoming Economics
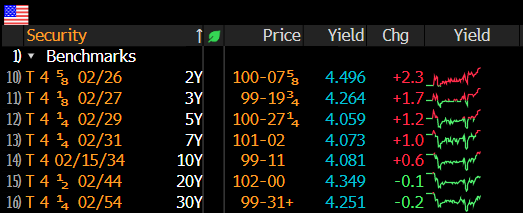
US Bond Yields
Index Updates
At TTG, I use Volume At Price in my chart analysis and I use the MarketWebs Indicator to provide Value Areas & VPOCs which indicate significant support & resistance levels. Learn More Here about Volume At Price and the MarketWebs.
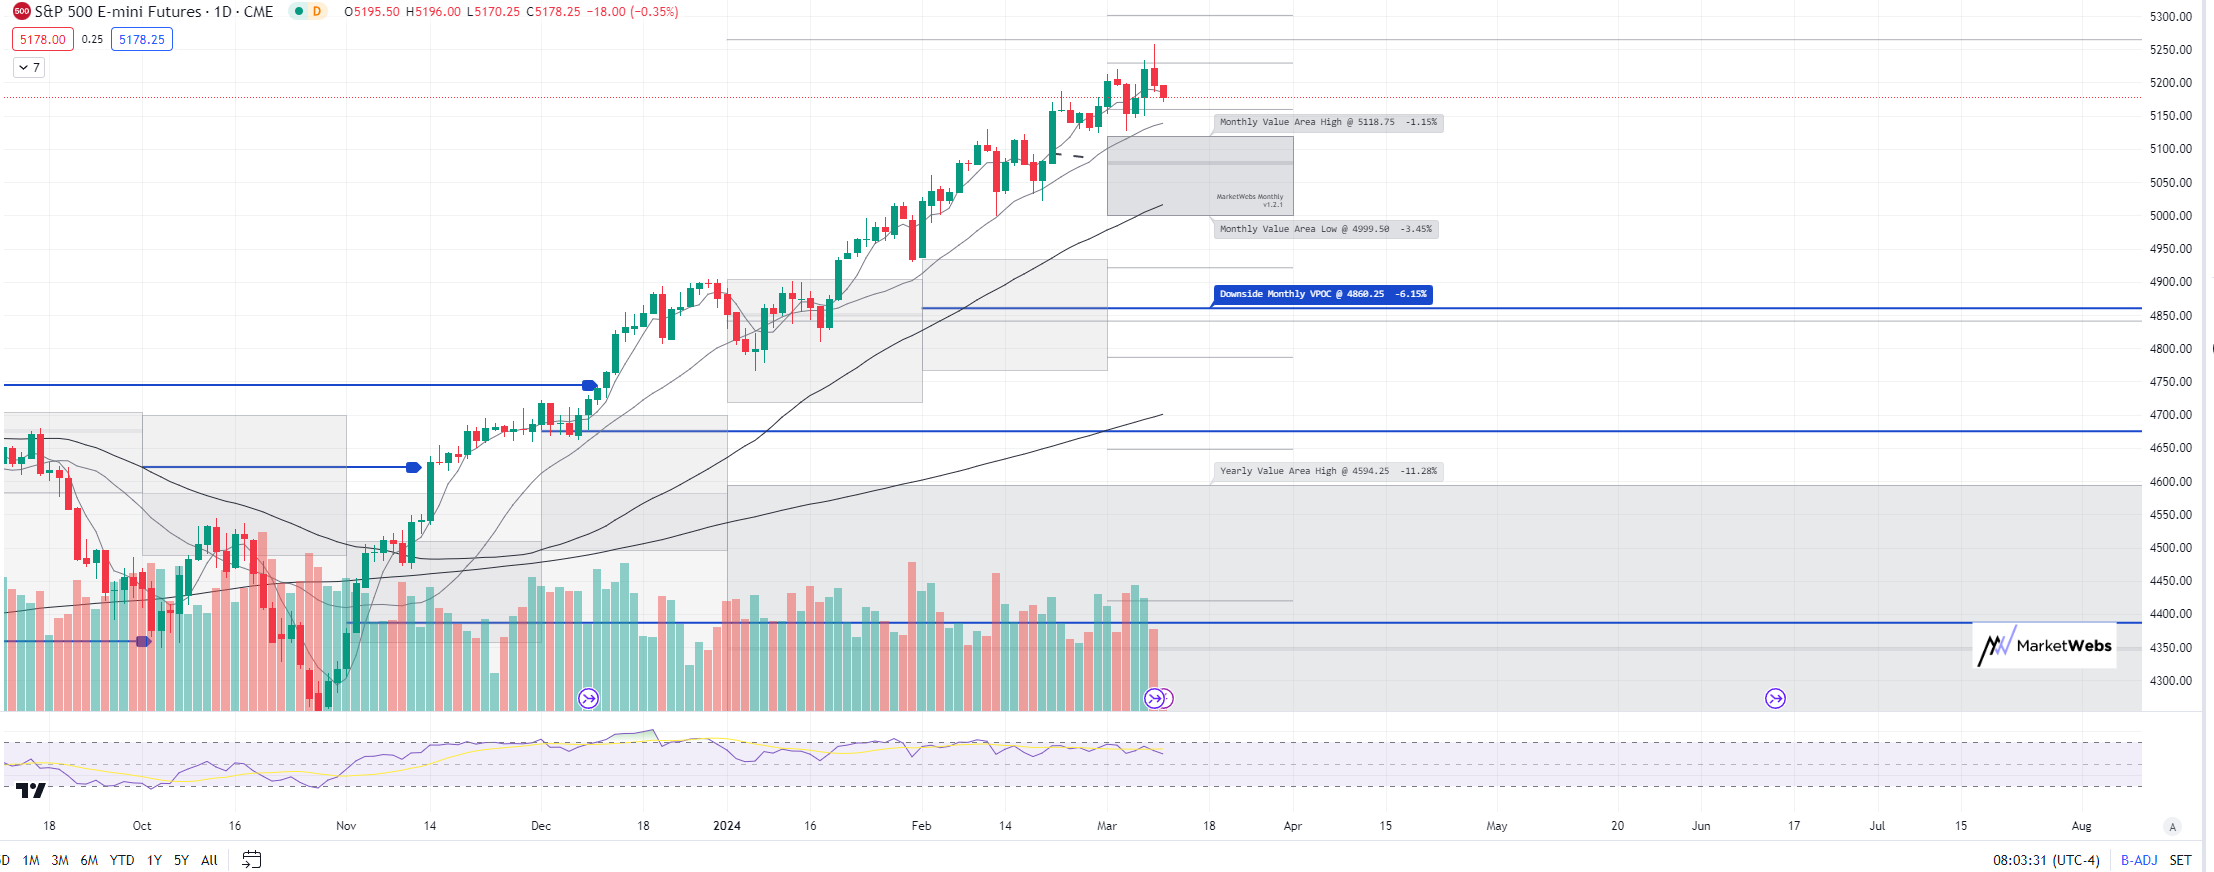
ES_F - SPX Futures - Price ind. -0.4% this morning and showing continued weakness after Friday's reversal lower. Also, note the VIX is +6.7% this morning and up to 15.7. From a technical standpoint, price is below its 5d MA (Moving Average), but still above its 20d MA and Mar Value Area, support to watch is 5118.76 which is -1.1% lower
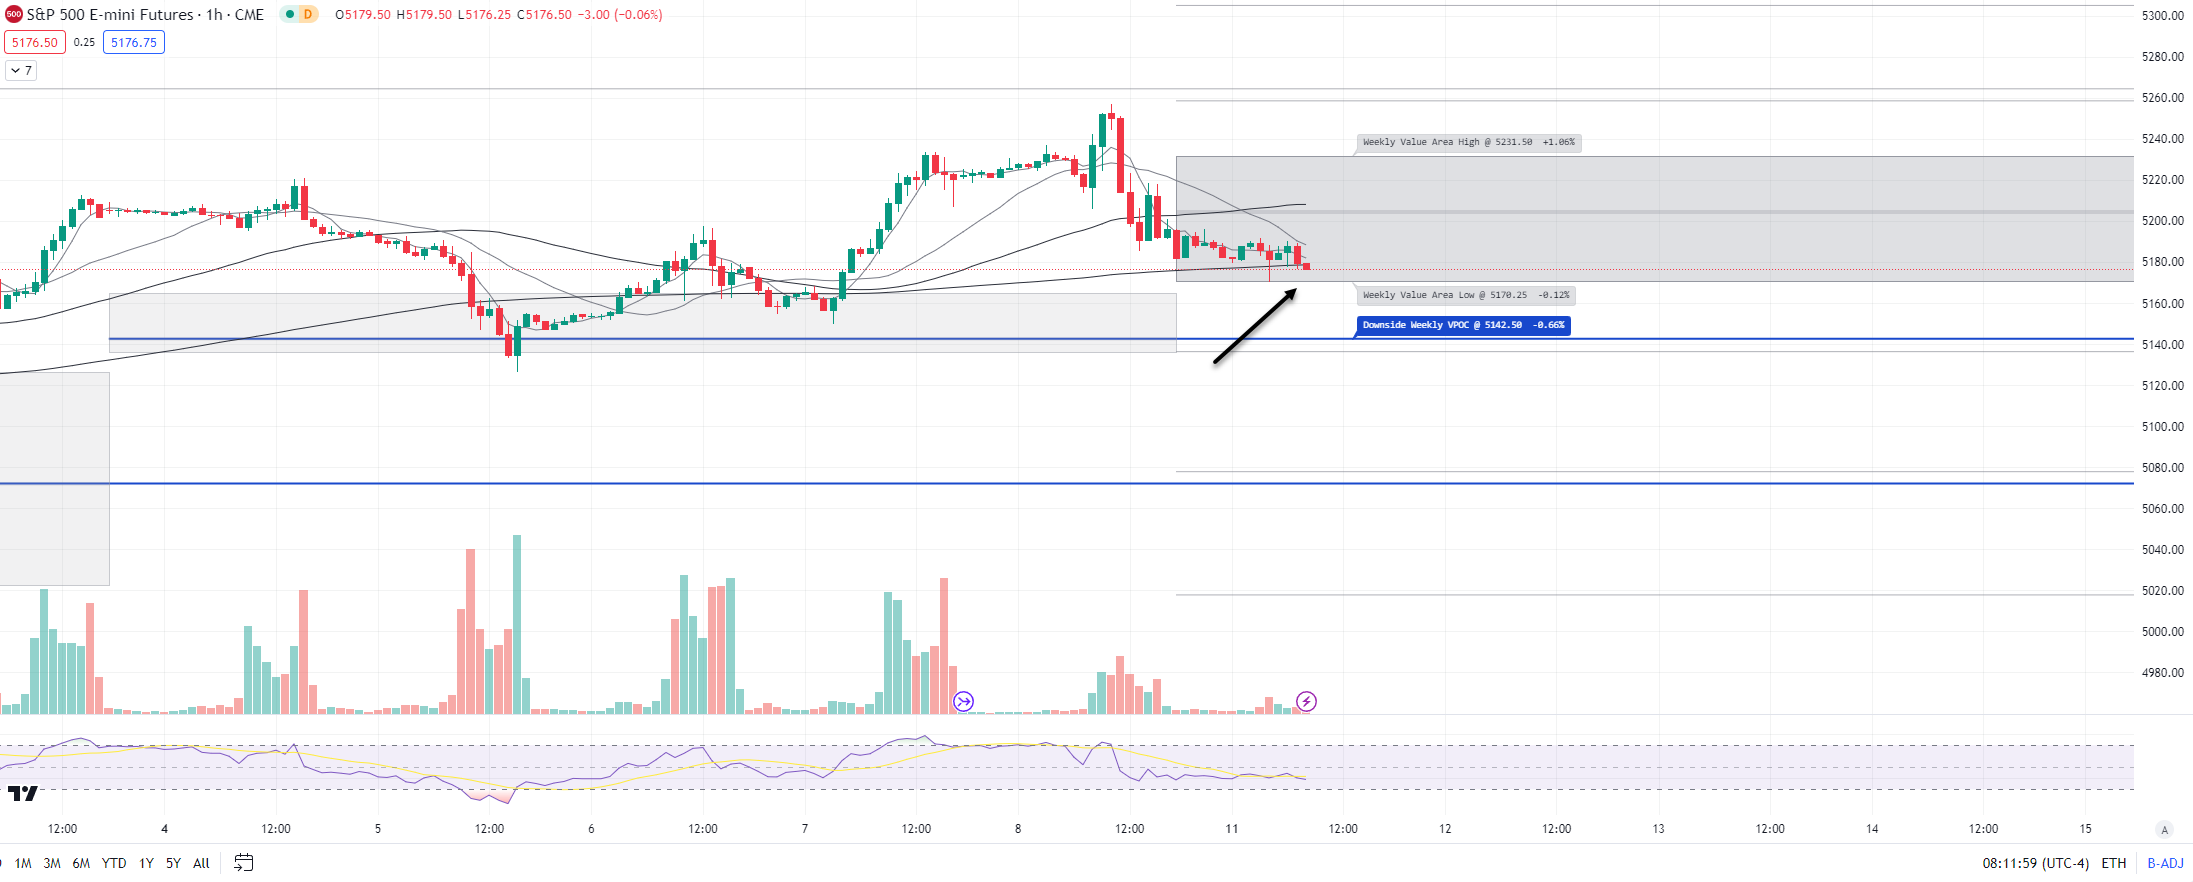
1hr chart: Price starts the week inside its new Value Area for the week, support to watch 5170.25 bottom of value, next 5142.5 VPOC (blue line)
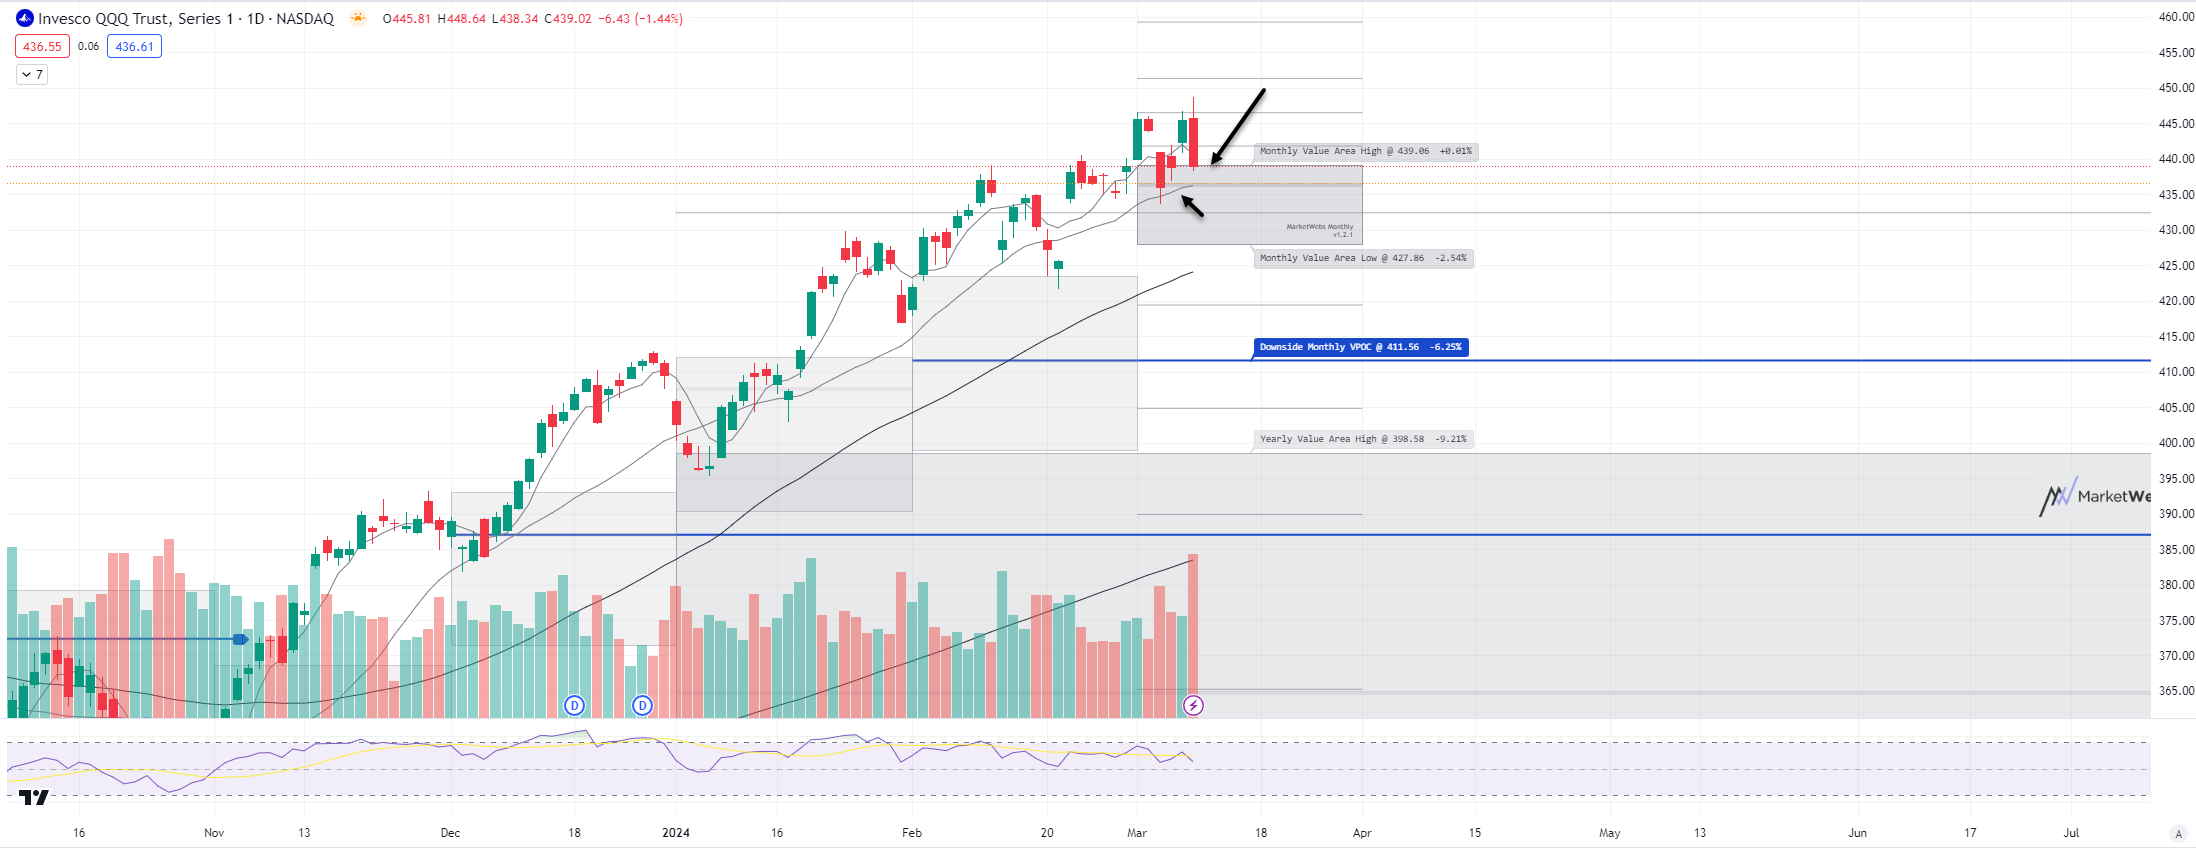
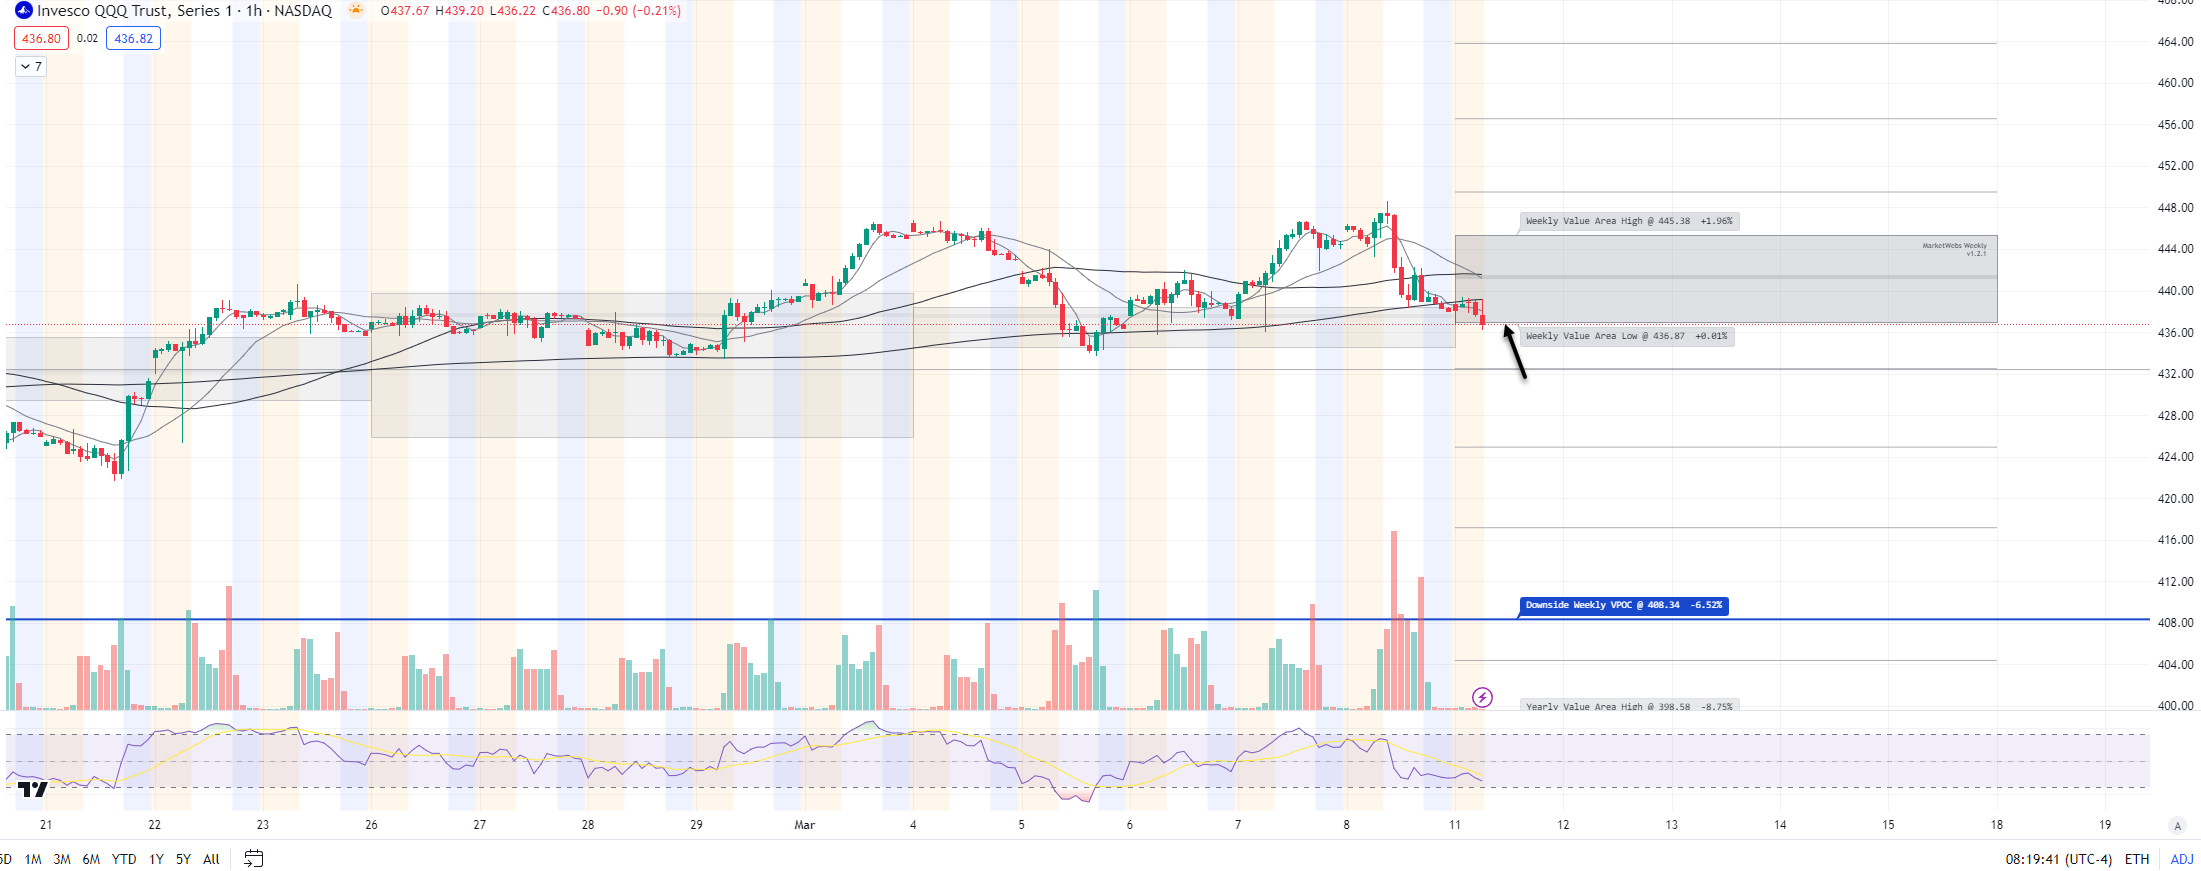
QQQ - NDX 100 ETF - Daily chart: Price ind. -0.6% and breaking into its Mar Value Area (note pre market activity is not updated on 1st chart below) , $439.06 will be level to watch for today (resistance) and 20d MA support
1hr chart: Price right at its bottom of Value Area , watch $436.87 this will be interesting to watch today whether will price will hold short term support and trend
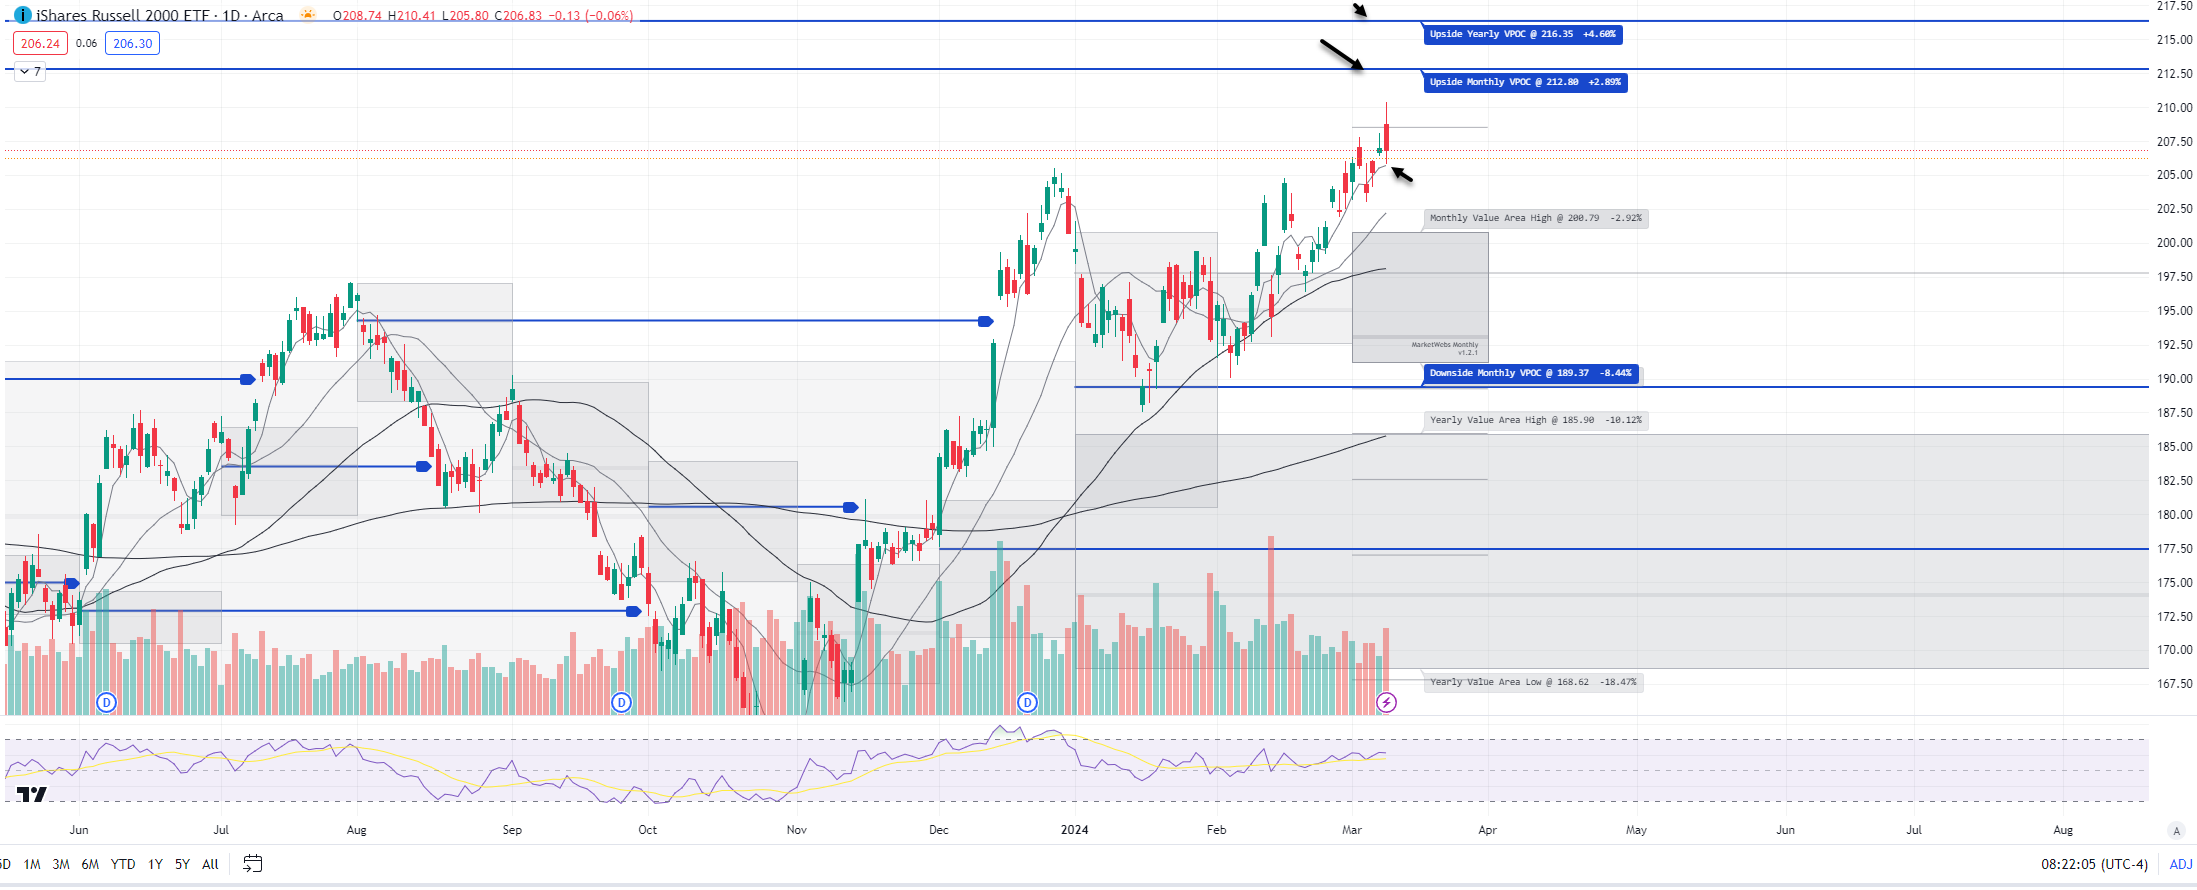
IWM - Russell Small Cap ETF- Small Caps outperformed last week, +0.5% and slightly this morning. Price for now is above its short term 5d MA and that is nearby support / trend to watch on Daily chart
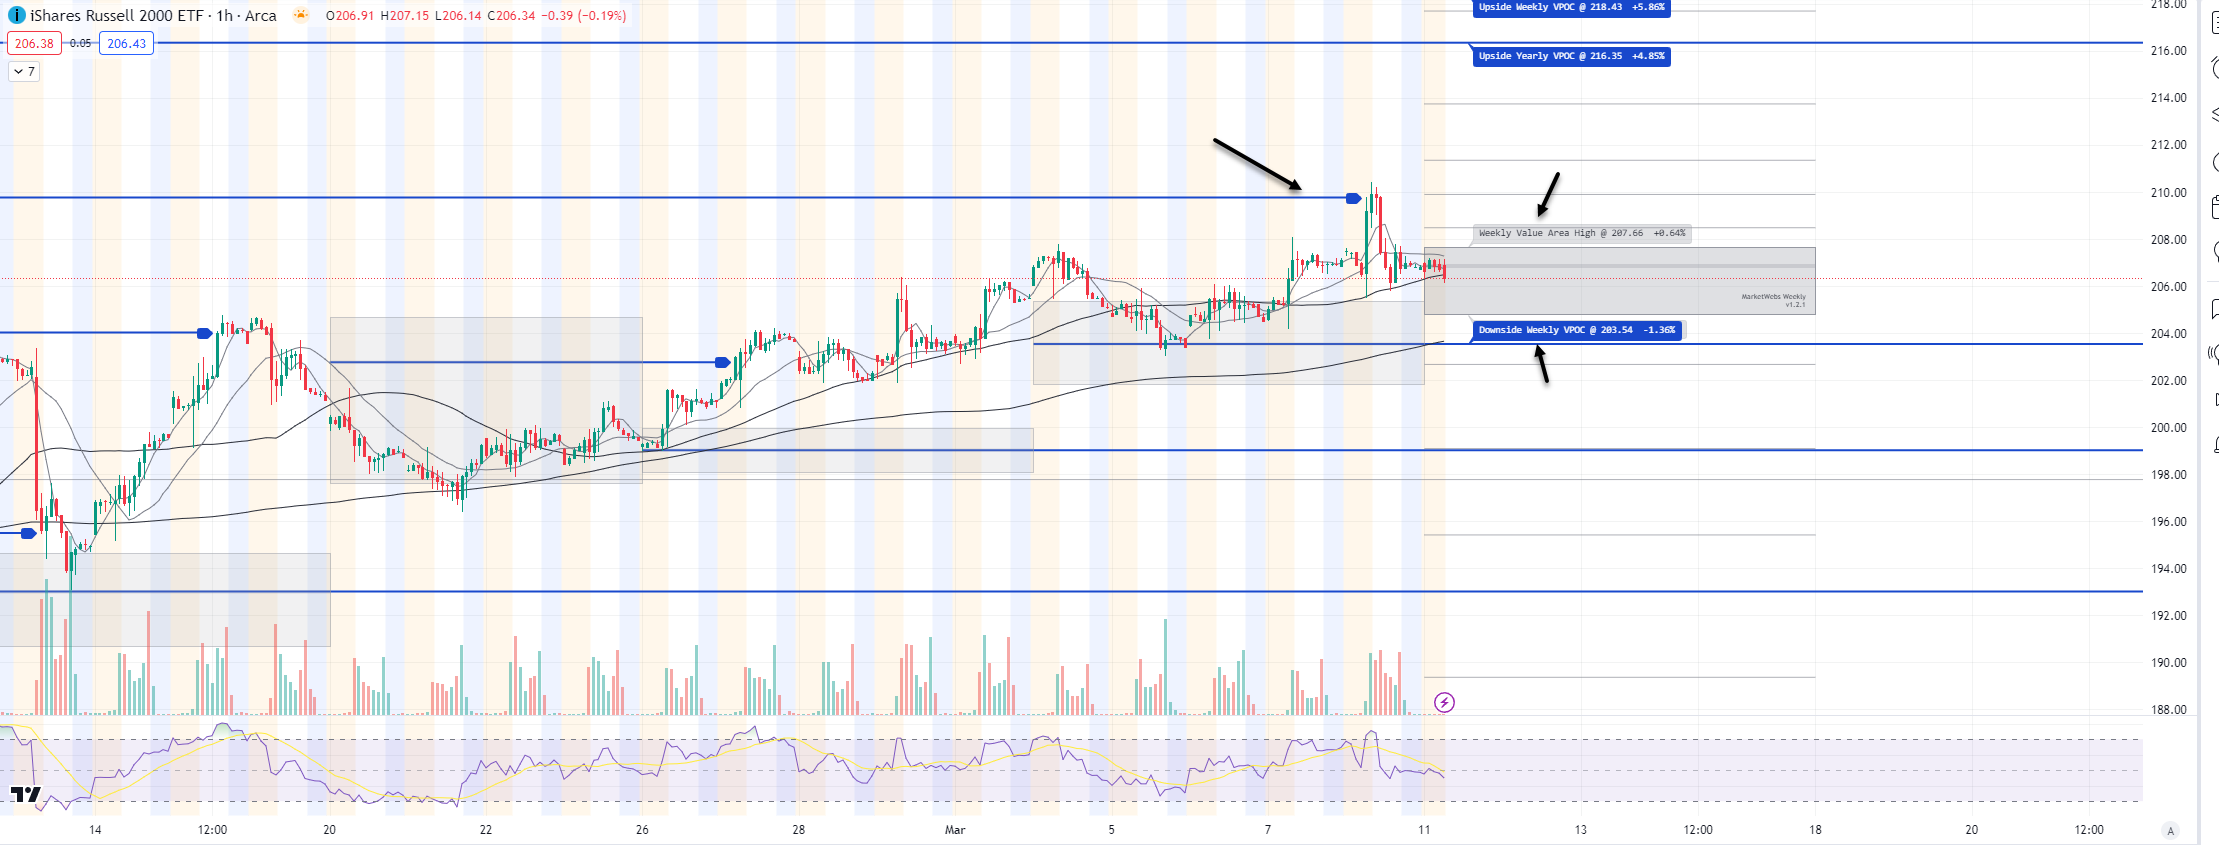
1hr chart: Price got rejected at its 1hr VPOC (blue line) on Friday and starts the week inside its Value Area, levels to watch below
Here is today’s TTG Proprietary Stock Screen “Out of the Box” using Volume At Price
names trending above their Value Areas (on 3 multiple timeframes & not super extended)
Keep reading with a 7-day free trial
Subscribe to The Tribeca Trade Group to keep reading this post and get 7 days of free access to the full post archives.