

TTG Index Charts & Out of the Box Stock Screen 3/8/24 $MCHP
TTG Index Charts & Out of the Box Stock Screen 3/8/24 $MCHP
Out of the Box MarketWebs Screen
US Dollar flat / 30yr Bonds +0.3% / Crude -0.8% & Nat Gas -1.8% / Gold +0.4% / Copper -0.1%% / BTC -0.2%
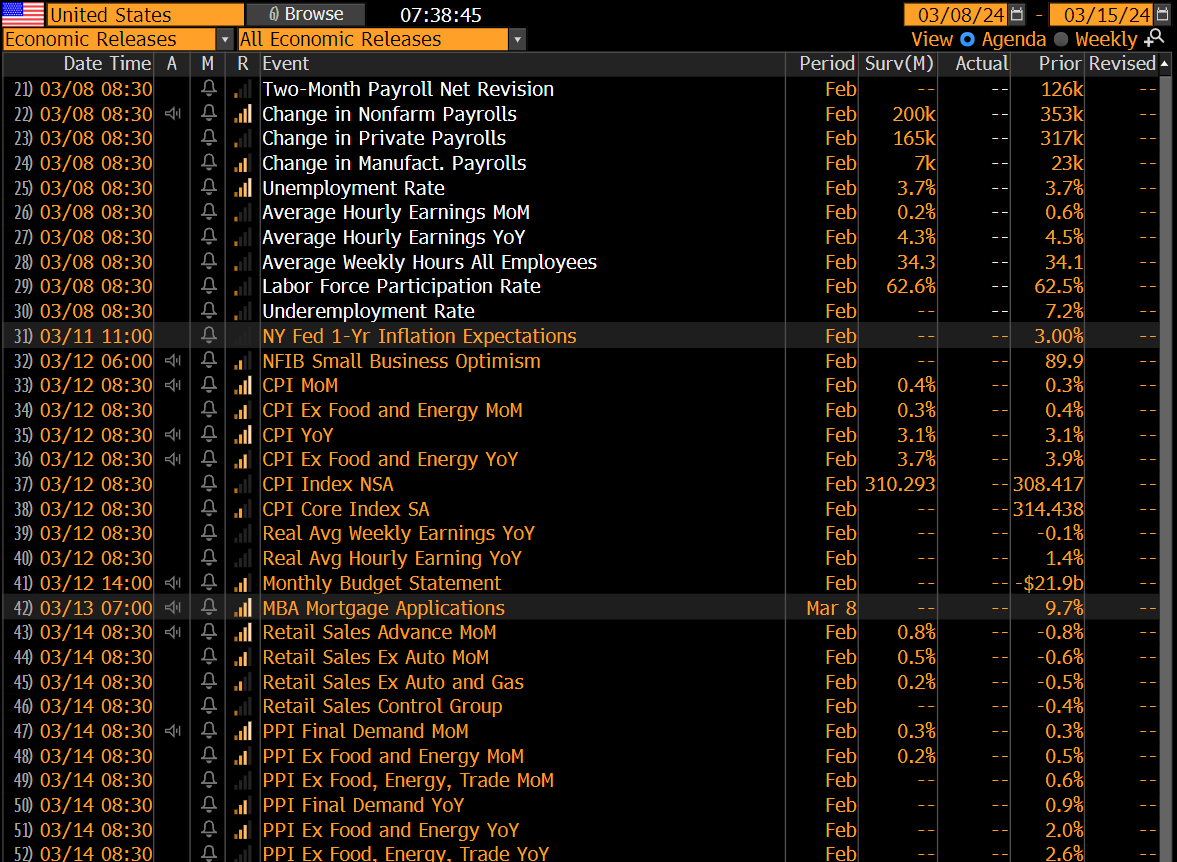
US Upcoming Economics
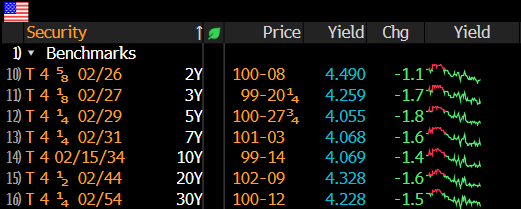
US Bond Yields
Index Updates
At TTG, I use Volume At Price in my chart analysis and I use the MarketWebs Indicator to provide Value Areas & VPOCs which indicate significant support & resistance levels. Learn More Here about Volume At Price and the MarketWebs.
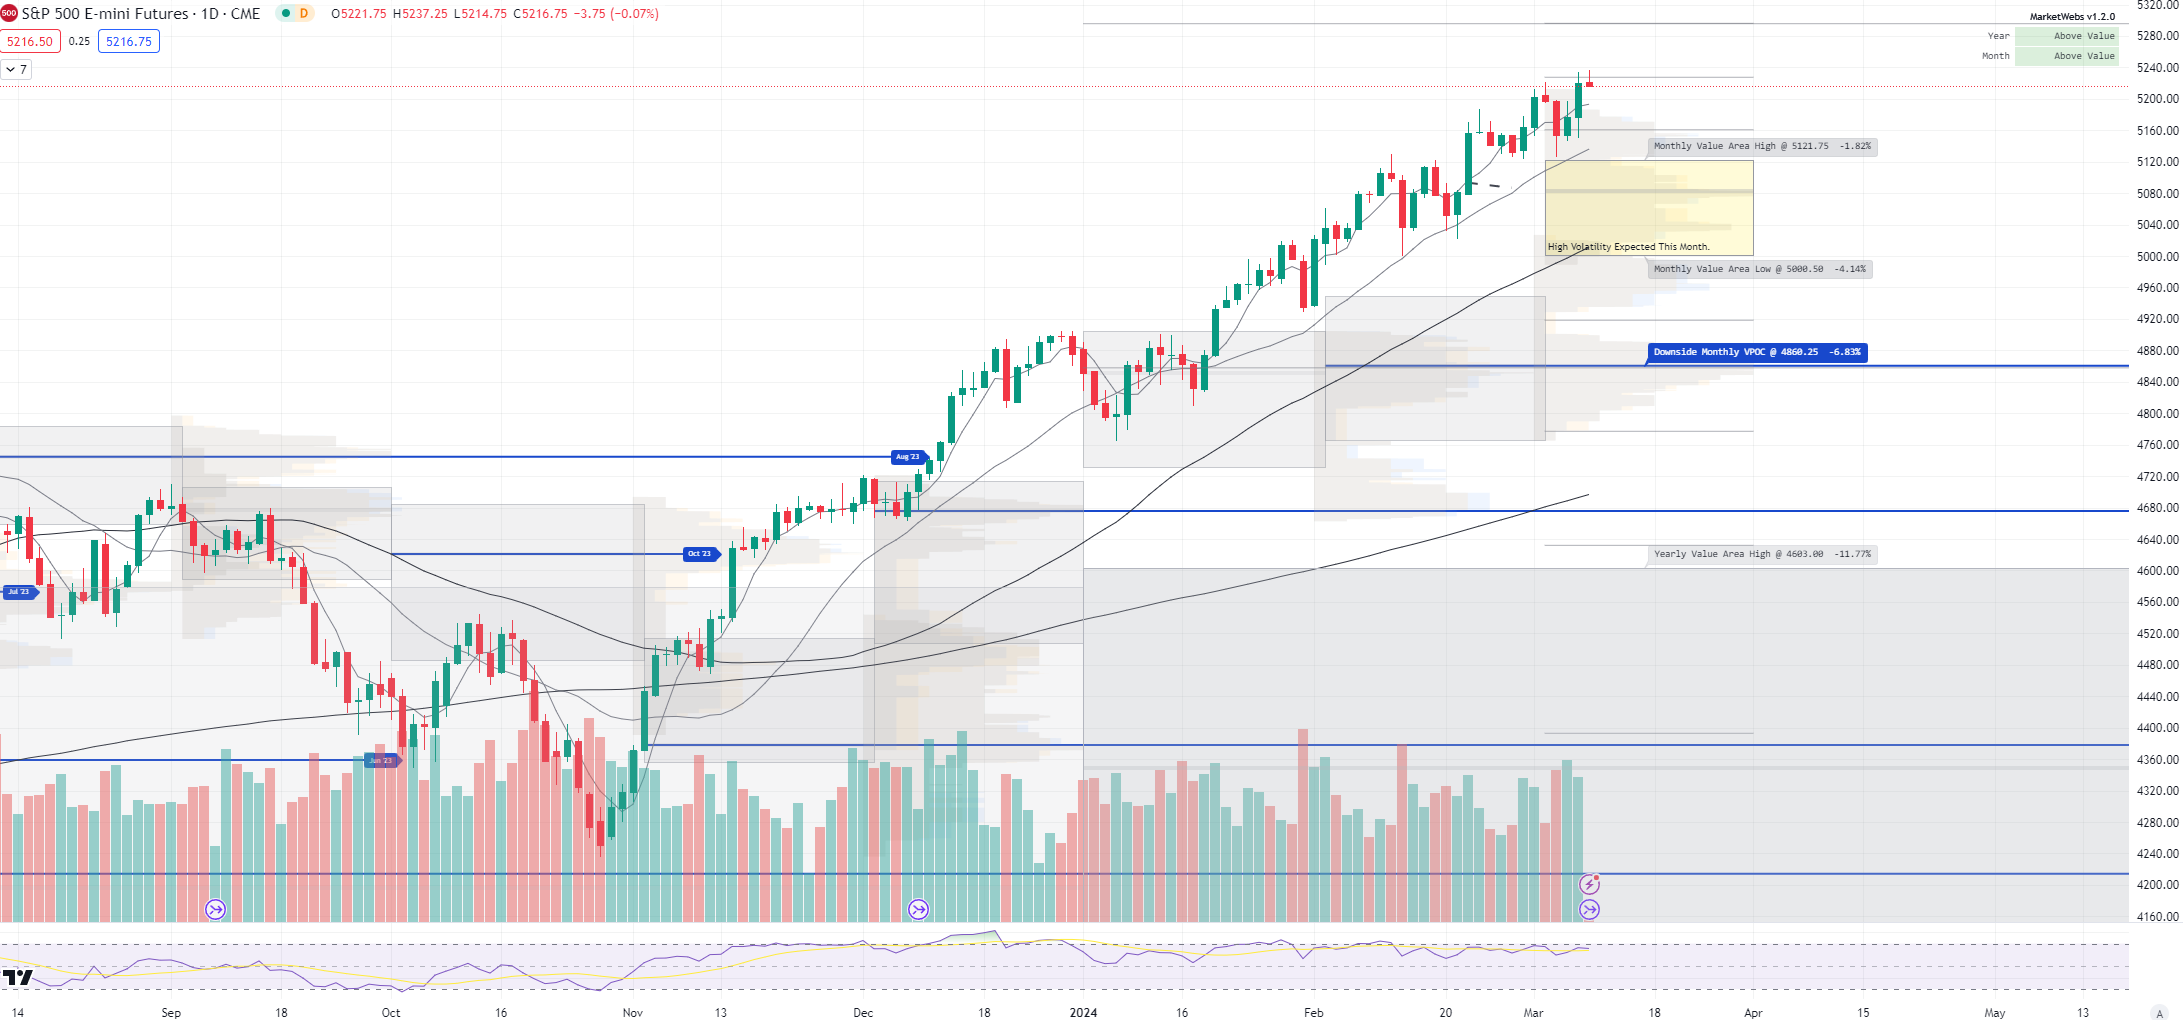
ES_F - SPX Futures - Price ind. -0.2% ahead of the monthly Jobs report (exp +200k Nonfarm Payrolls and Avg Hourly Earnings MoM exp +0.2%). I think the Avg Hourly Earnings will be the most important data point as it will provide another gauge of inflation. Currently, price is above all short term MAs (Moving Averages) and its March Value Area, support remains 5121.75
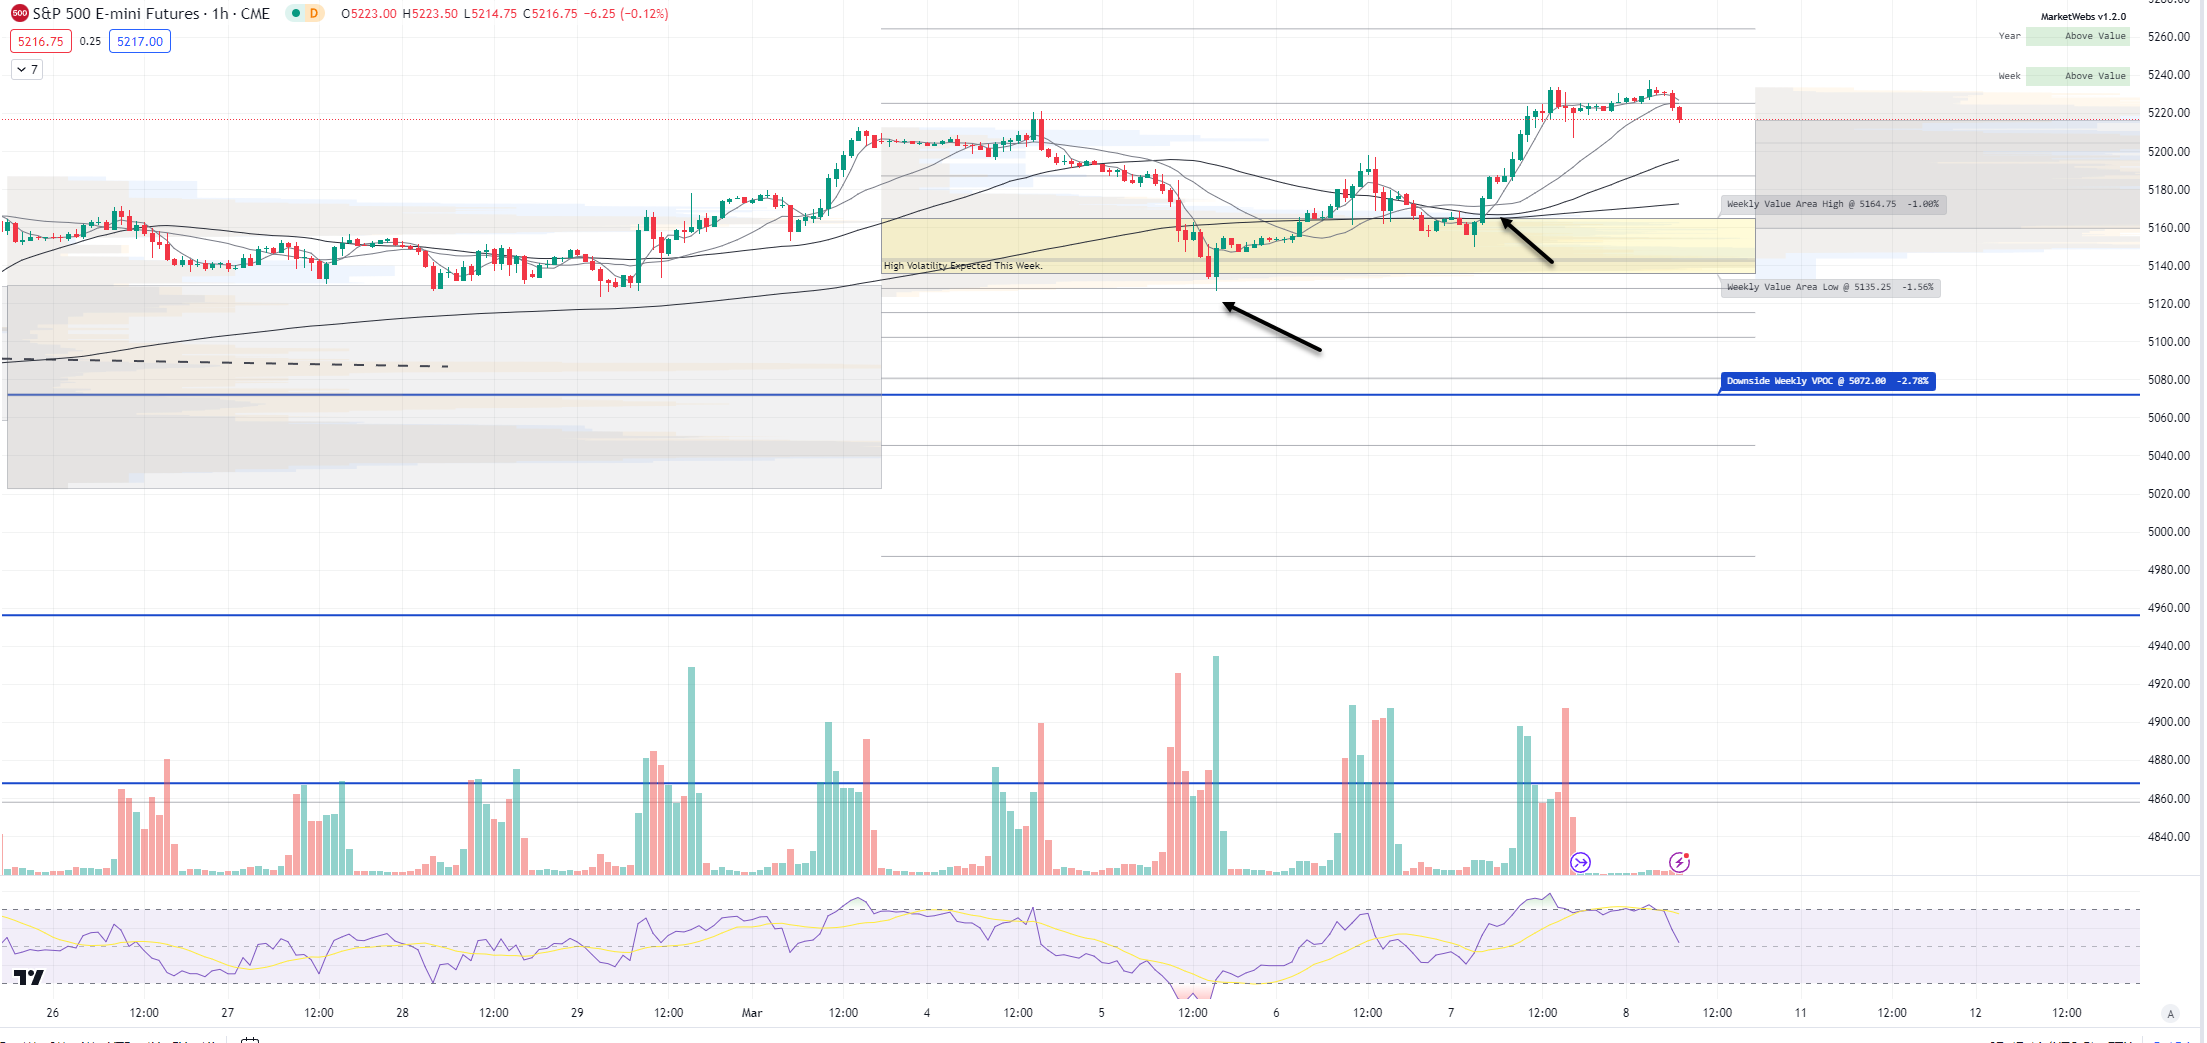
1hr chart: Price remains above its Value Area for the week
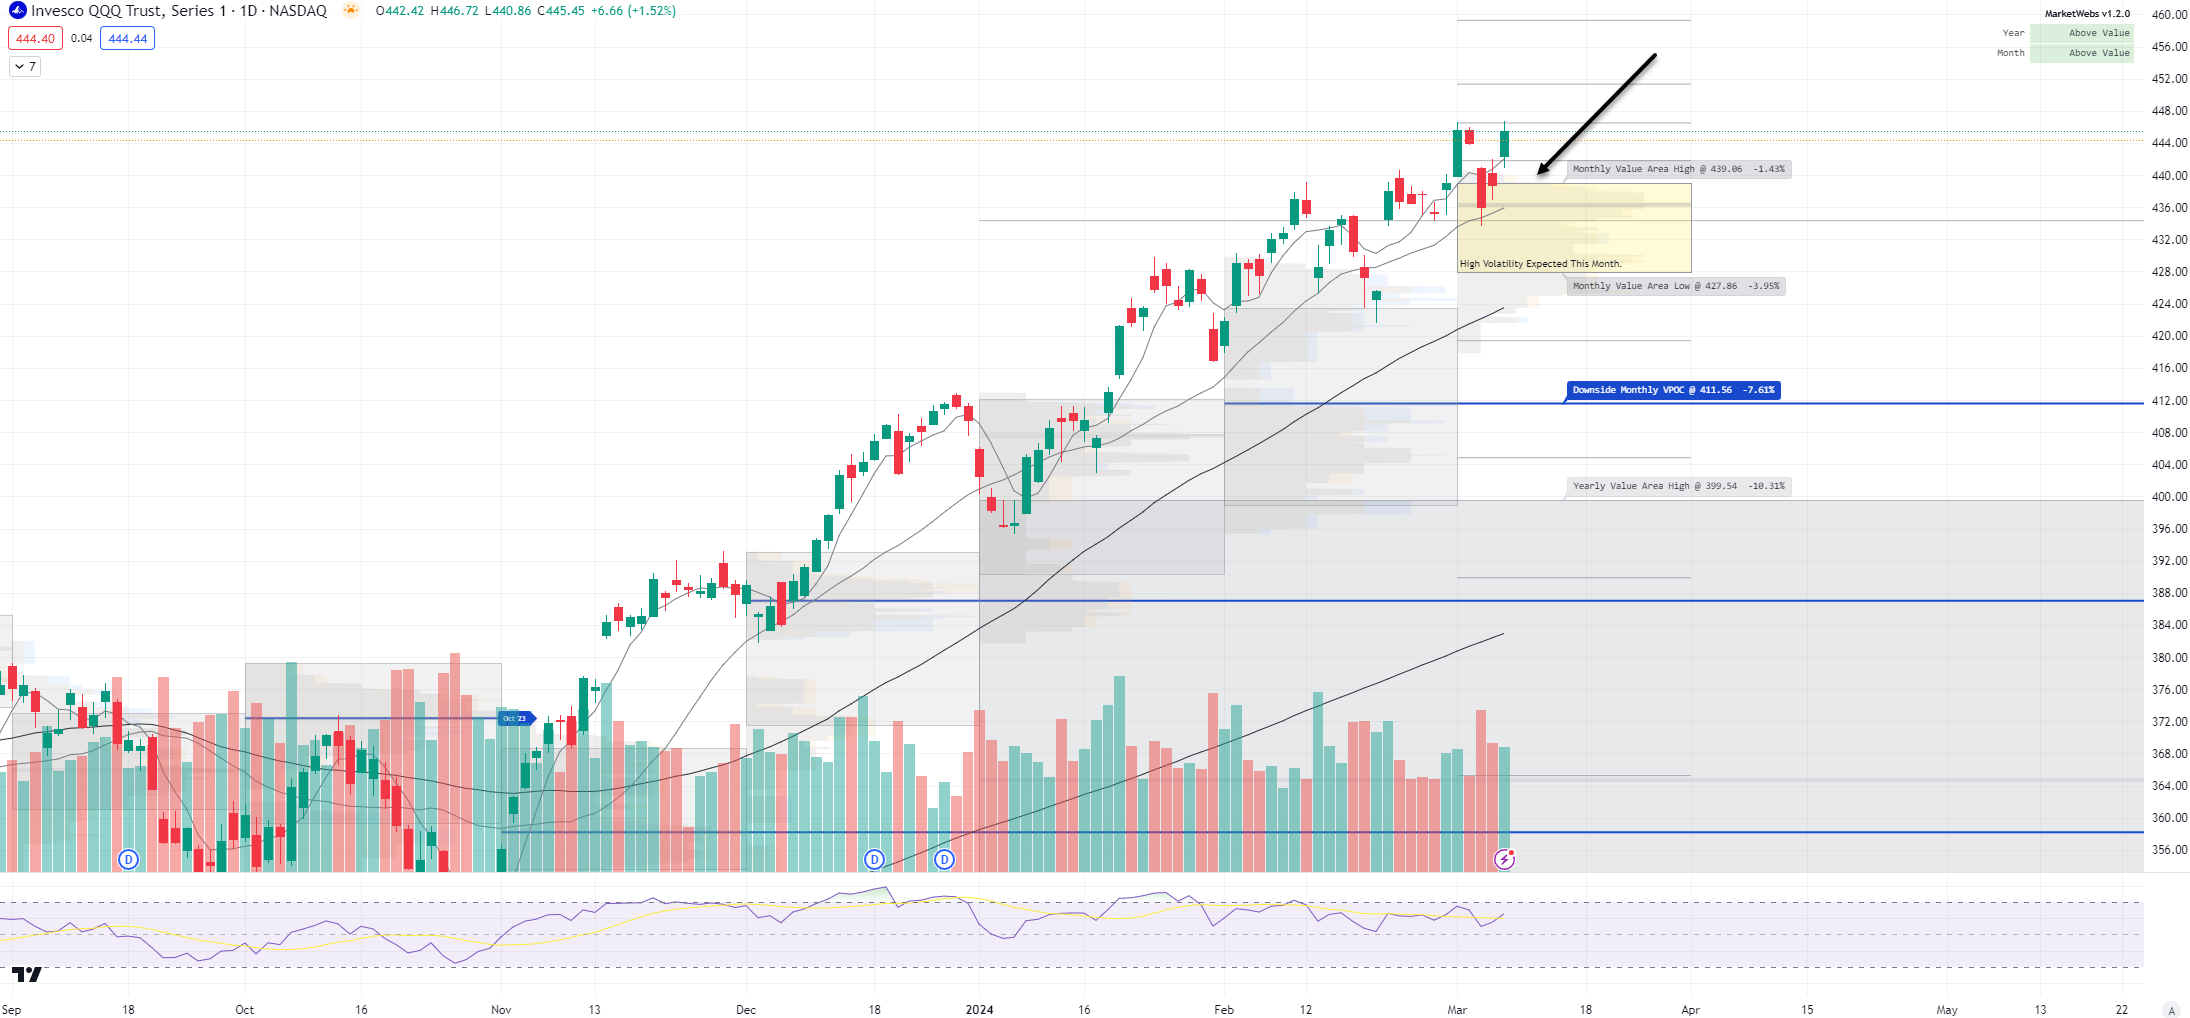
QQQ - NDX 100 ETF - Daily chart: Price ind. -0.3% this morning and yesterday reclaimed its short term MAs and is back above its March Value Area, support is $439.06
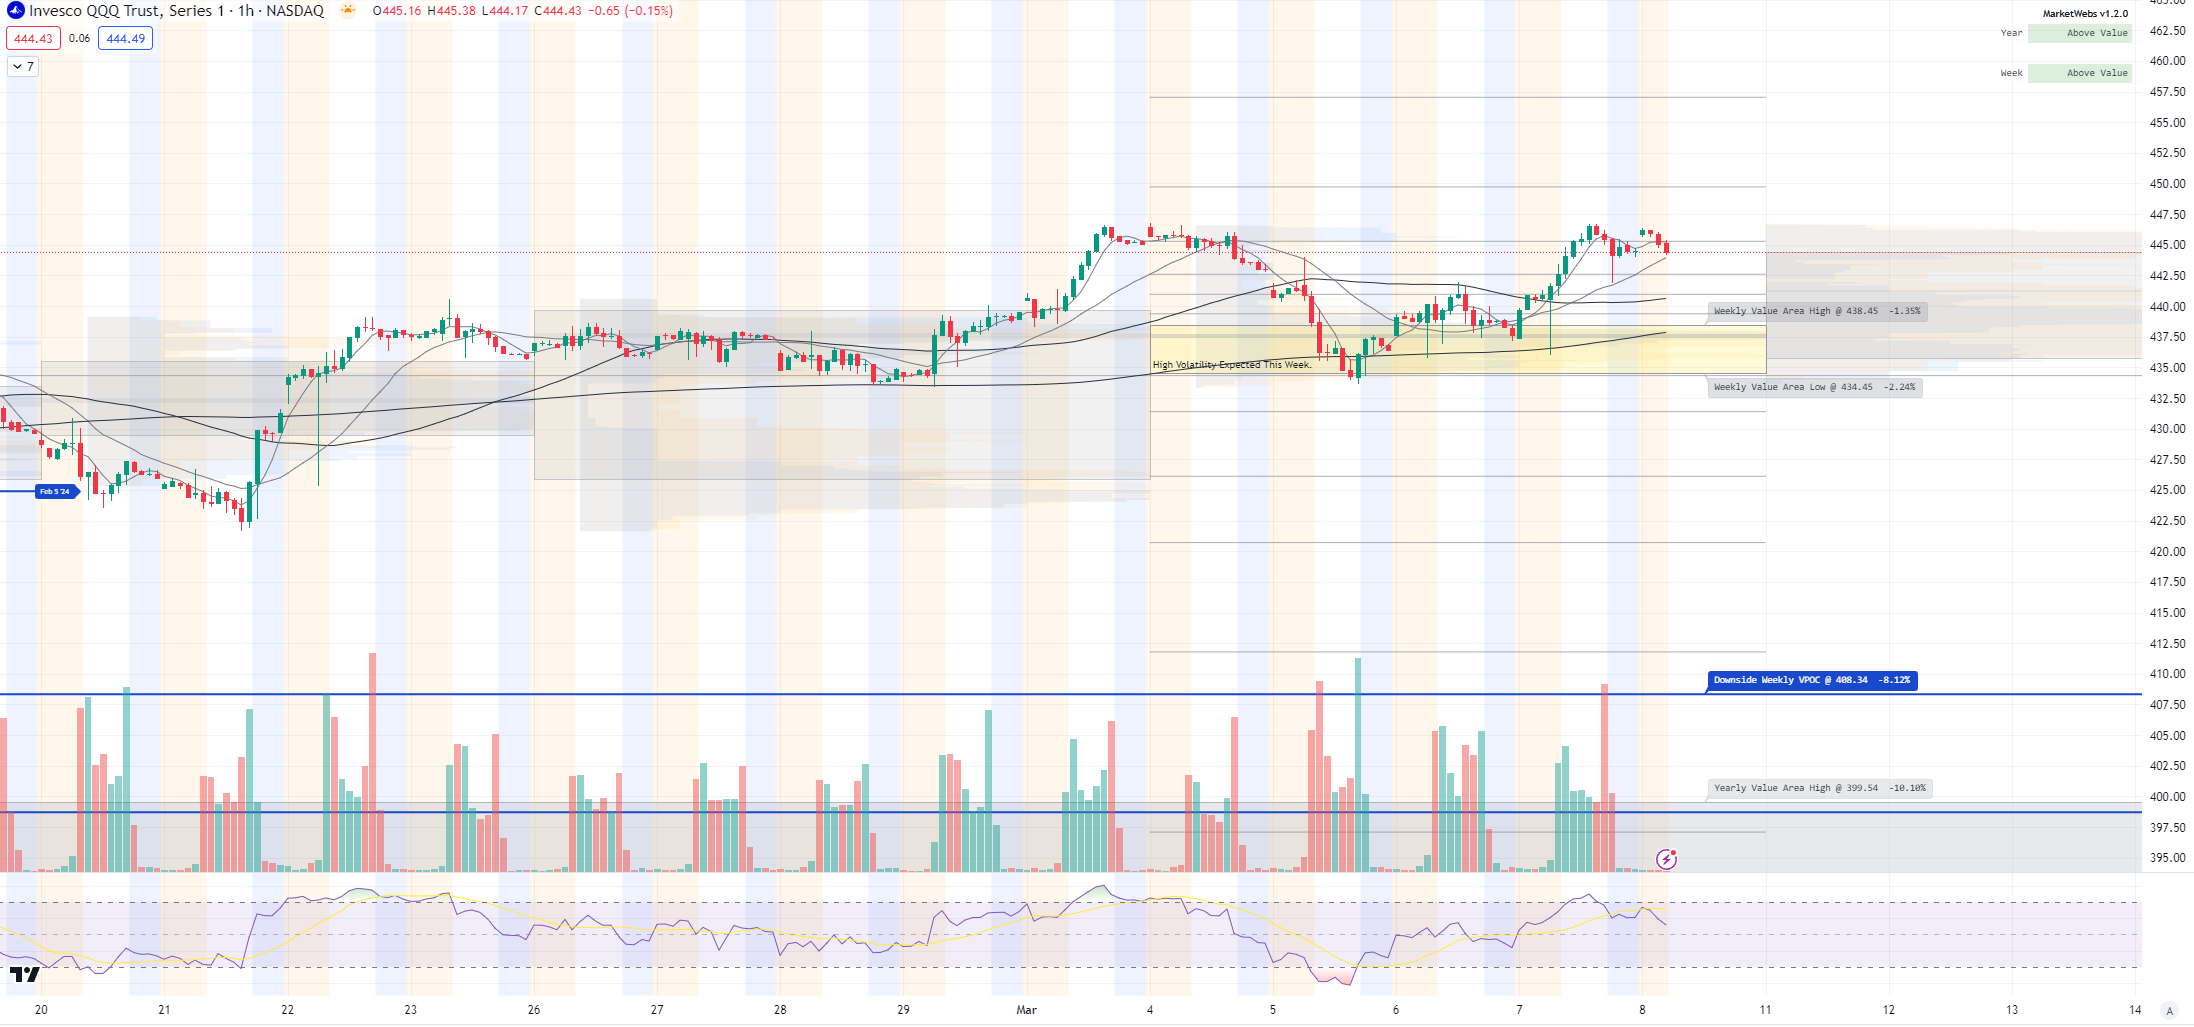
1hr chart: Price also above its Value Area for the week but did not take out the highs from earlier this week, something to watch in coming days
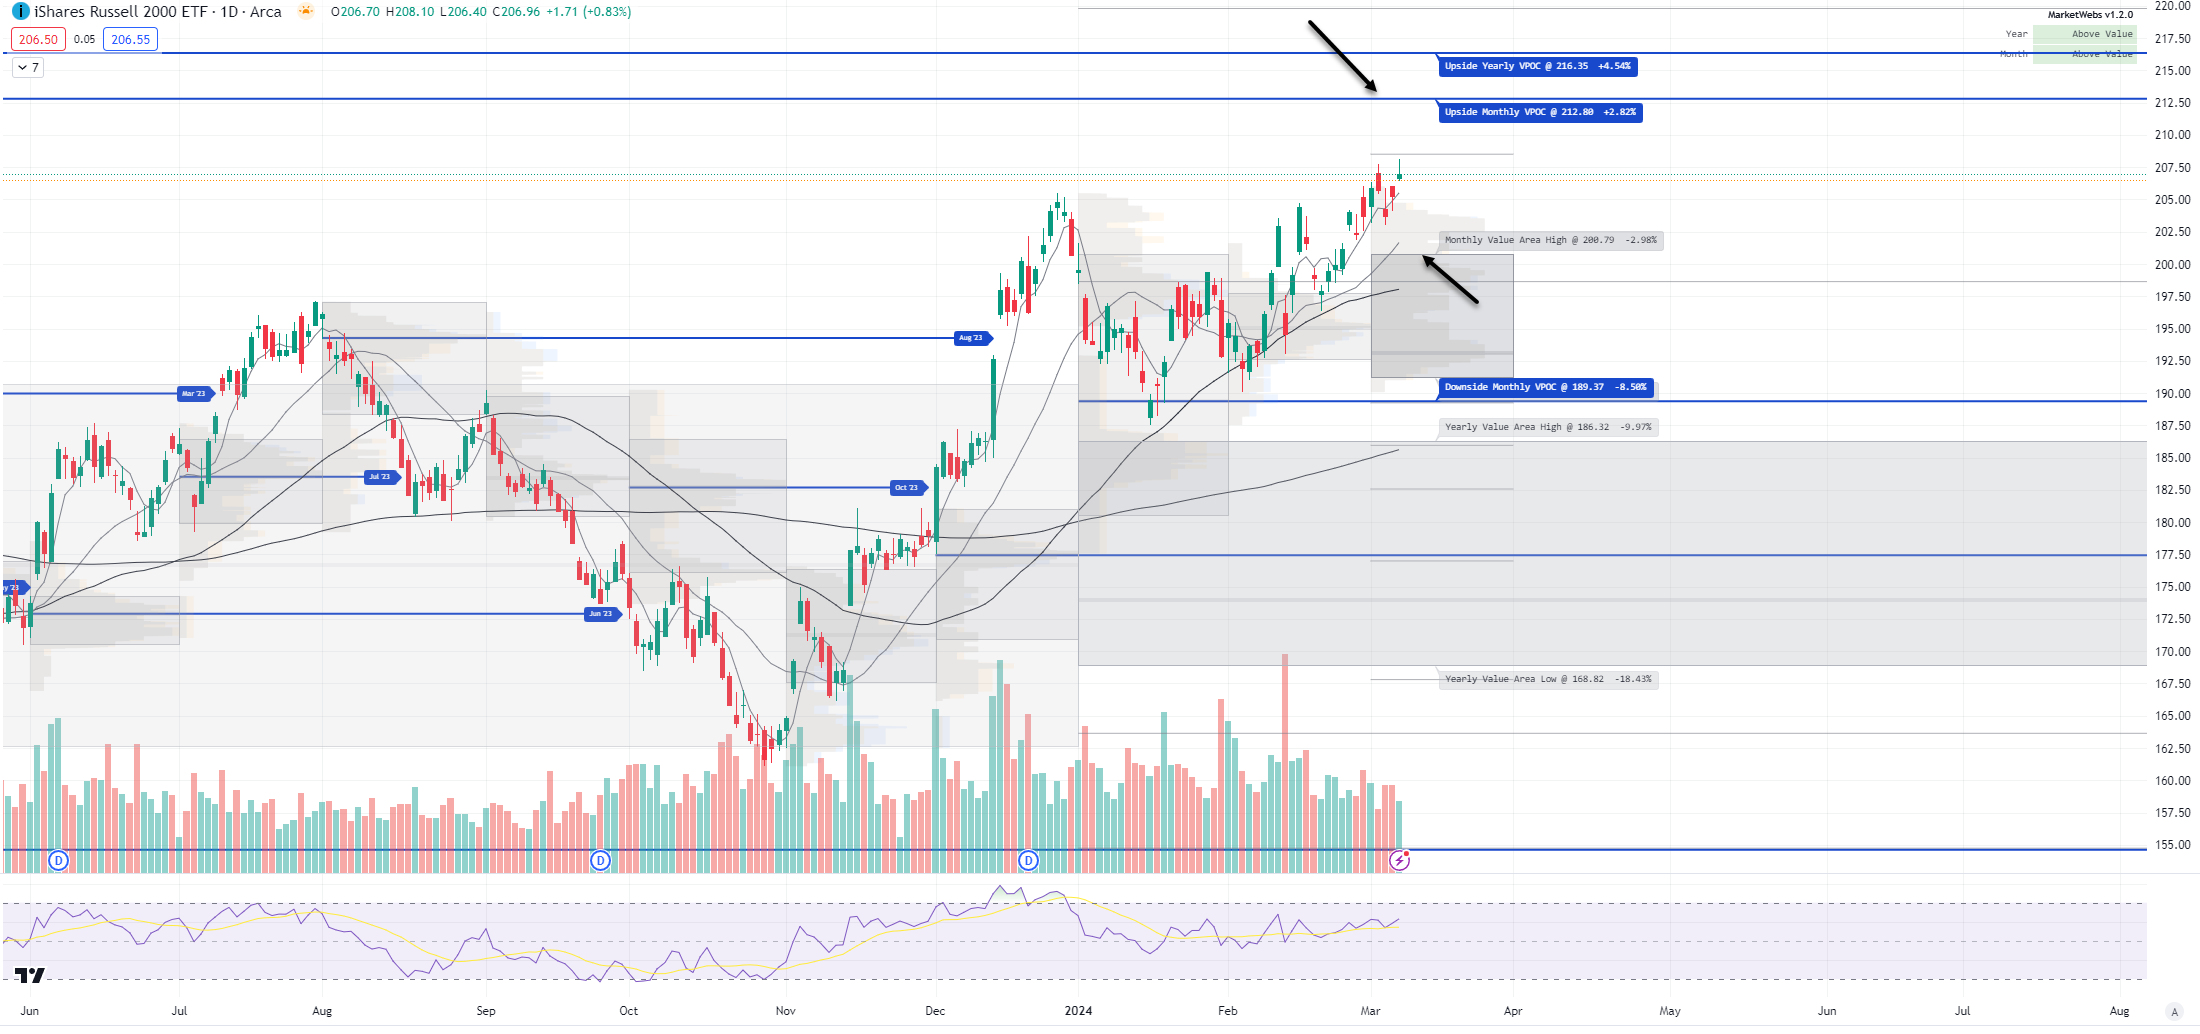
IWM - Russell Small Cap ETF- Price ind. -0.2% and is slightly above its Dec highs and has about +2.8% to go to get next upside VPOC (blue line) which represents some overhead supply
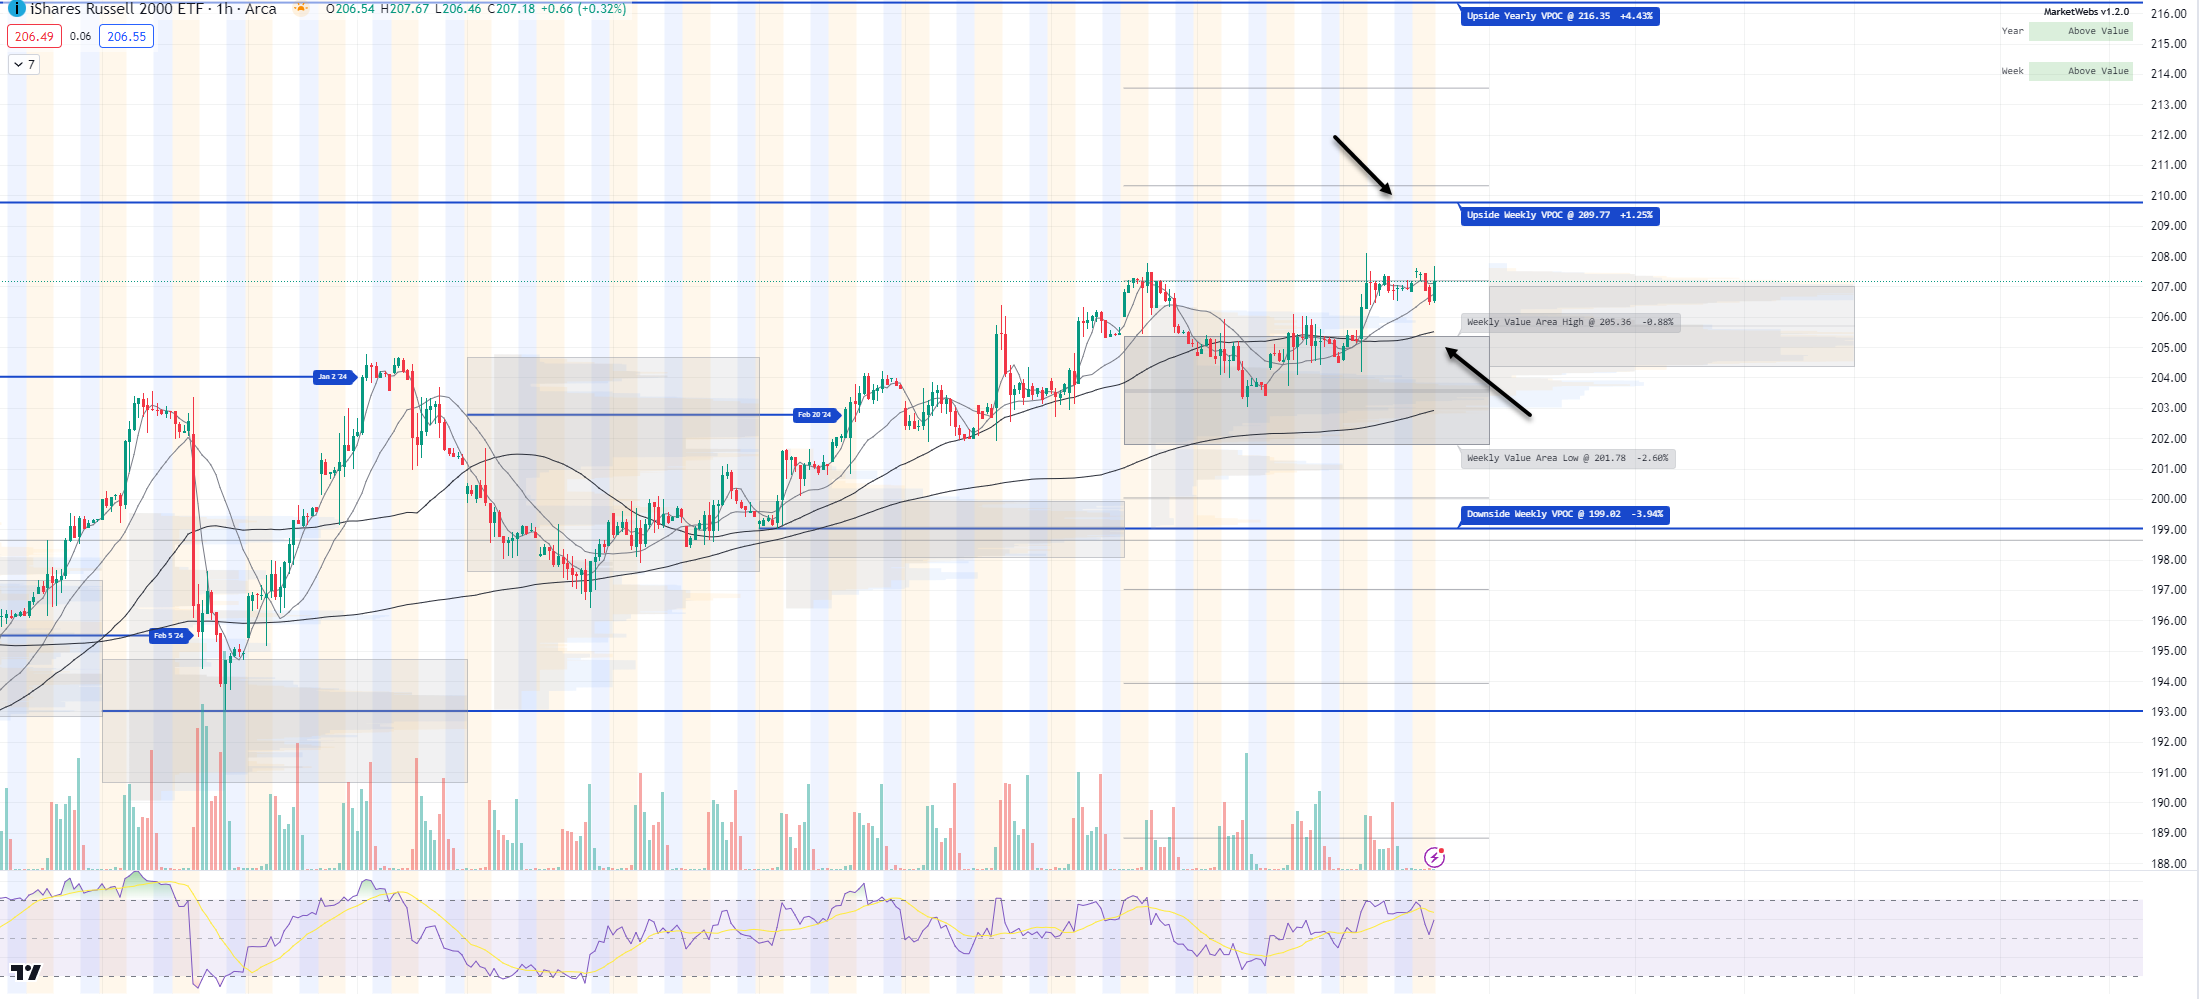
1hr chart: Price back above its Value Area for the week but, similar to the QQQs has not taken out its highs from earlier in the week. If price can get through those highs, upside VPOC (blue line) is ~ +1.6% away
Here is today’s TTG Proprietary Stock Screen “Out of the Box” using Volume At Price
names trending above their Value Areas (on 3 multiple timeframes & not super extended)
Keep reading with a 7-day free trial
Subscribe to The Tribeca Trade Group to keep reading this post and get 7 days of free access to the full post archives.