

TTG Index Charts & Out of the Box Stock Screen 01/25/24 $CSX
TTG Index Charts & Out of the Box Stock Screen 01/25/24 $CSX
Out of the Box MarketWebs Screen
US Dollar -0.3% / 30yr Bonds +0.1% / Crude -1.1% & Nat Gas -0.7% / Gold +0.2% / Copper -0.1% / BTC +3.6%
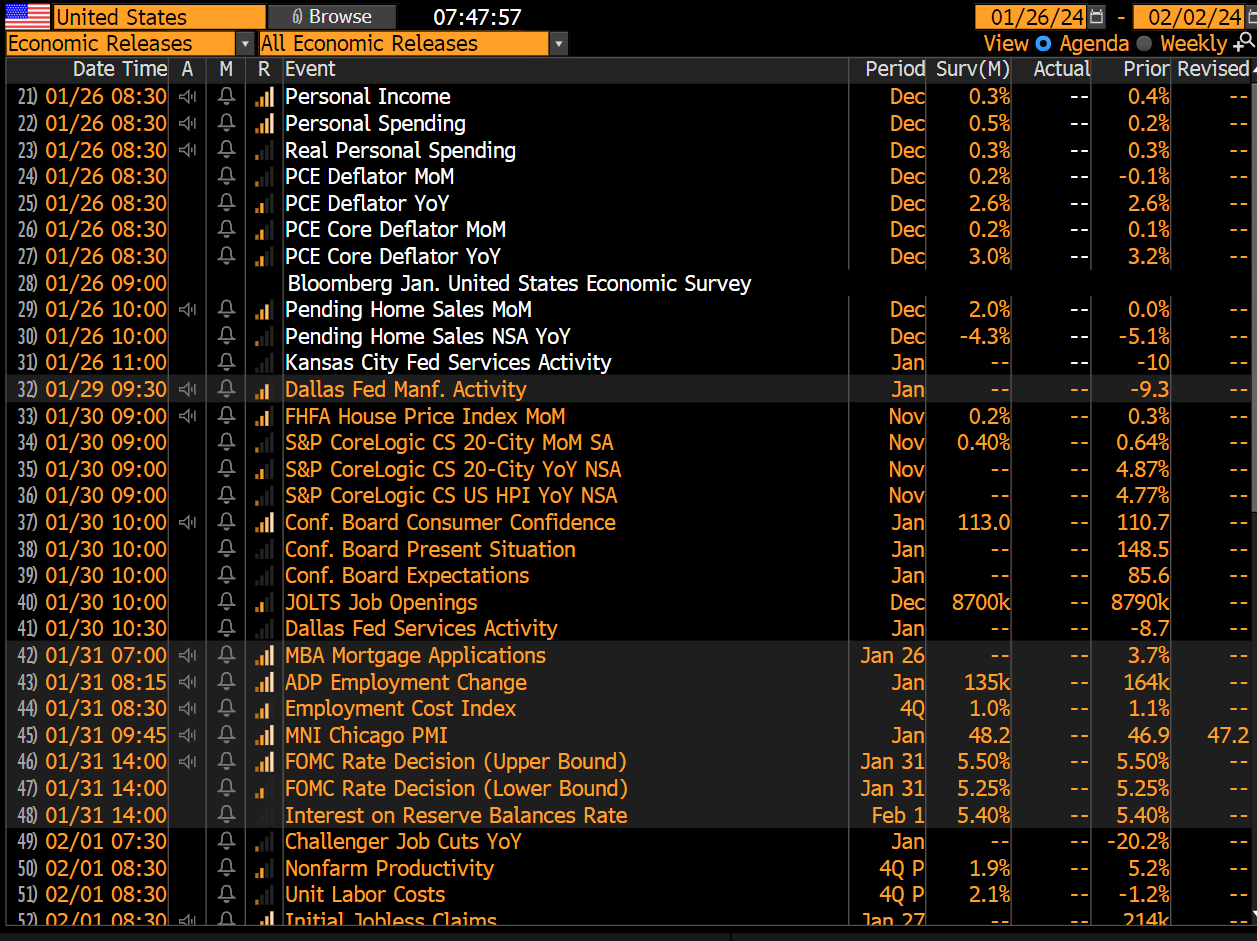
US Upcoming Economics
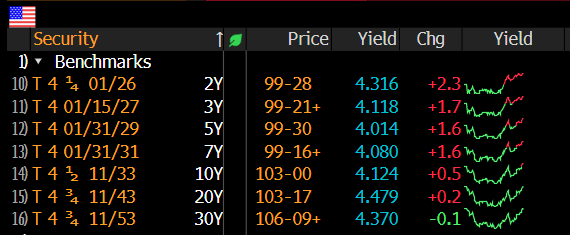
US Bond Yields
Index Updates
At TTG, I use Volume At Price in my chart analysis and I use the MarketWebs Indicator to provide Value Areas & VPOCs which indicate significant support & resistance levels. Learn More Here about Volume At Price and the MarketWebs.
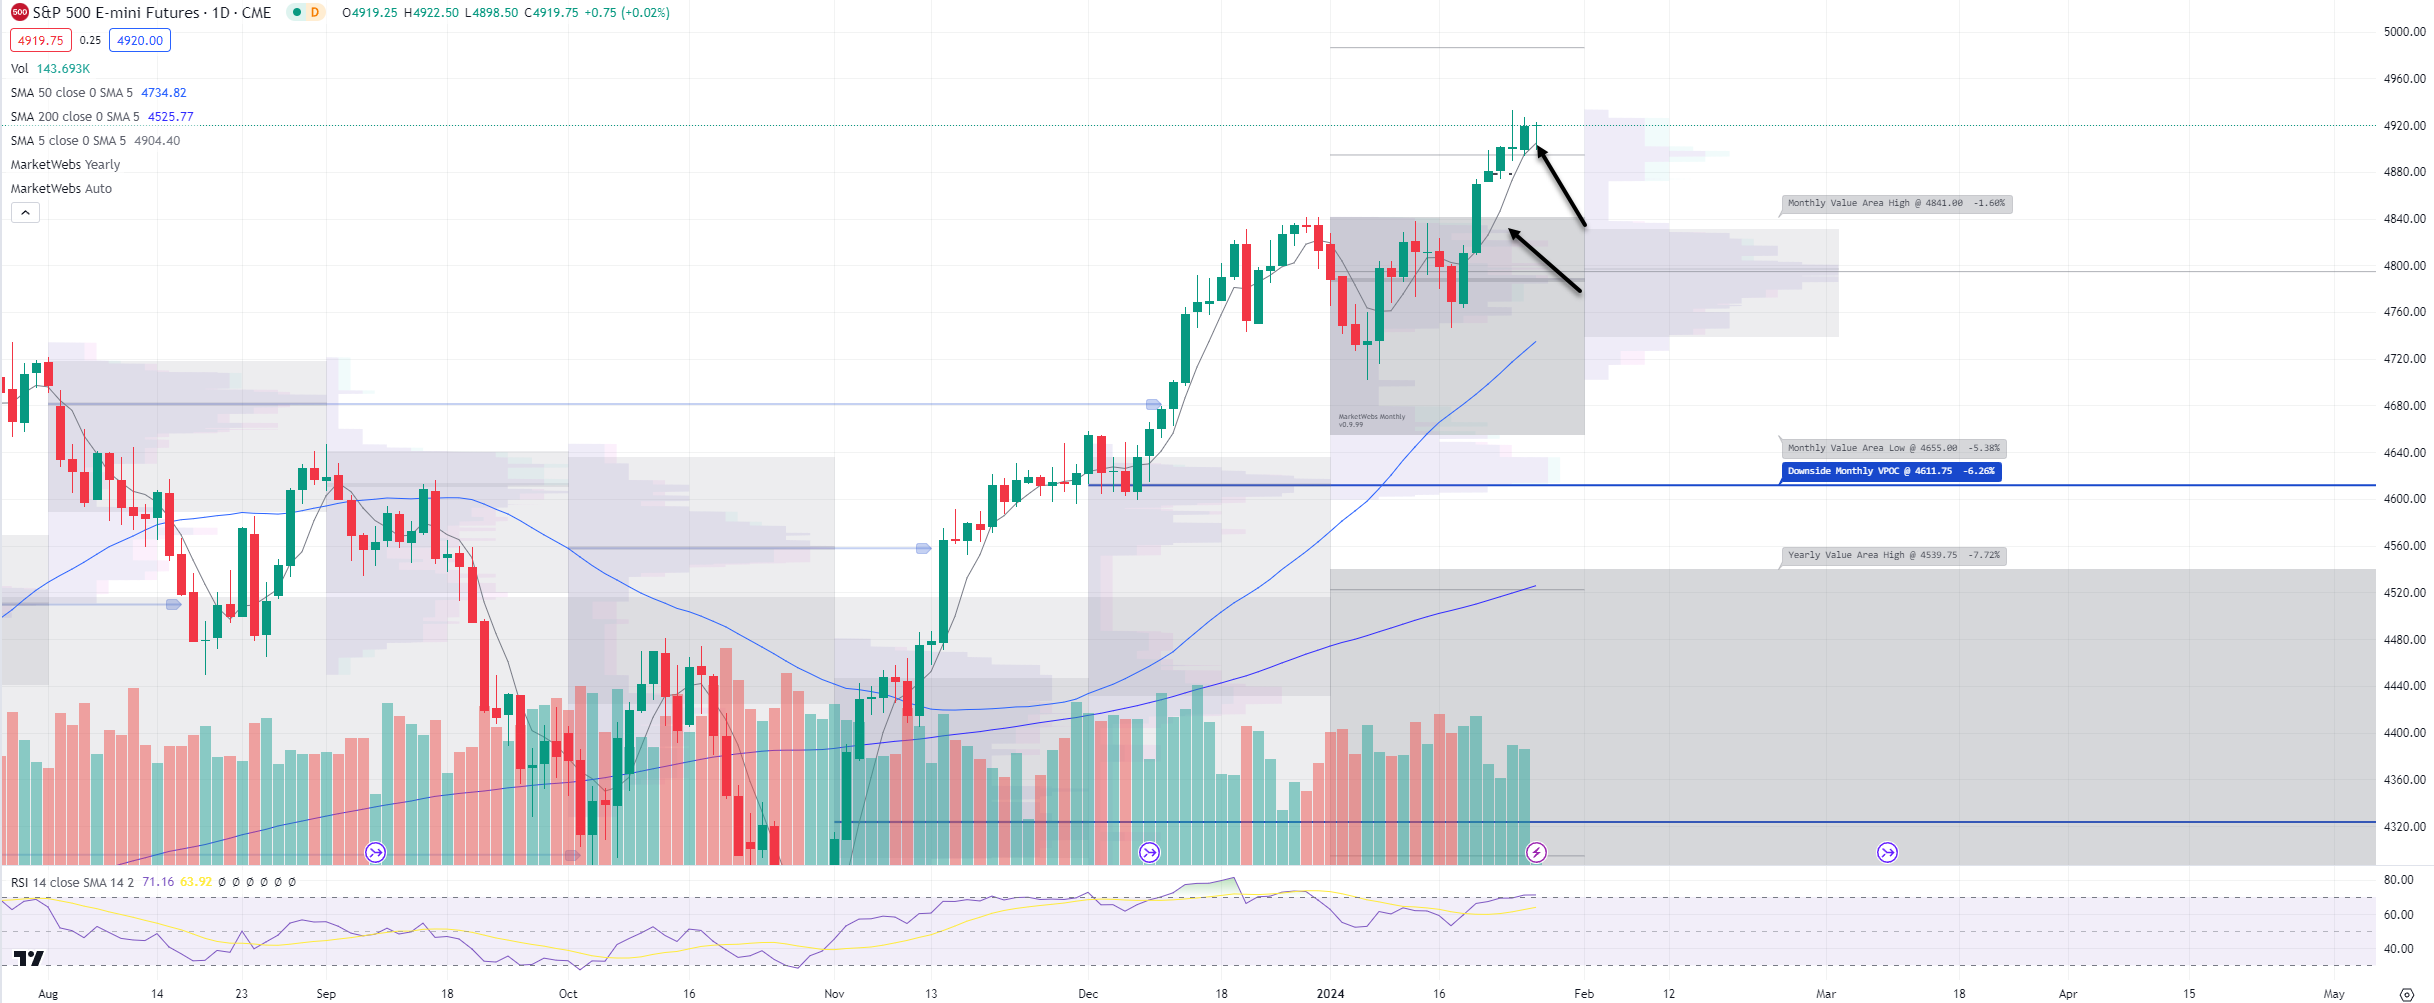
$ES_F- S&P Futures - Price continues to hold above and grind above its 5d MA (Moving Average). Note PCE Deflator this morning at 8:30am, which has chance to shake things up a little. For now, continue to watch price and if can remain above its 5d MA , trending +
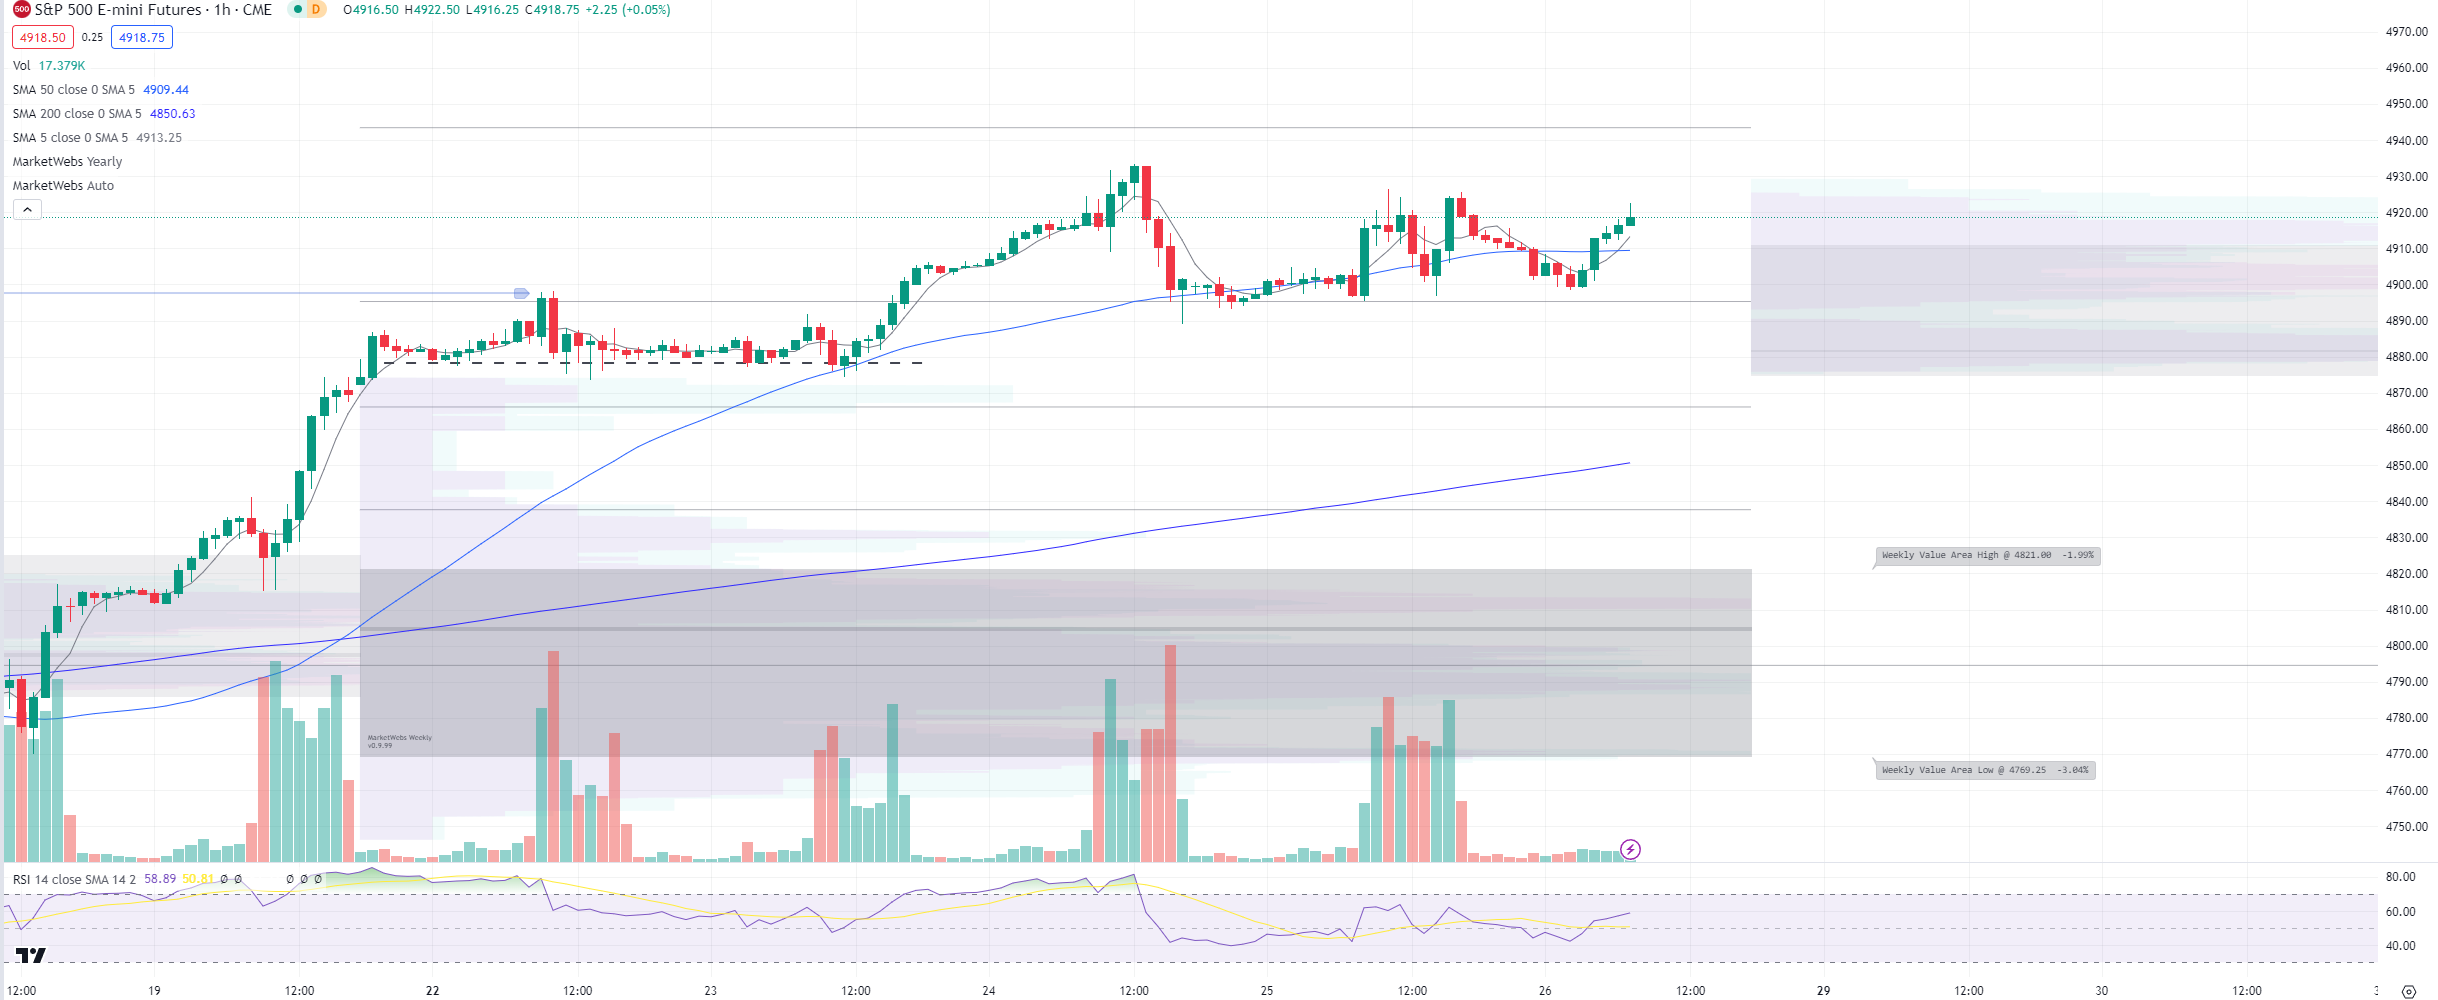
1hr chart: Not much new to report here, just whippy price action day to day but uptrend intact
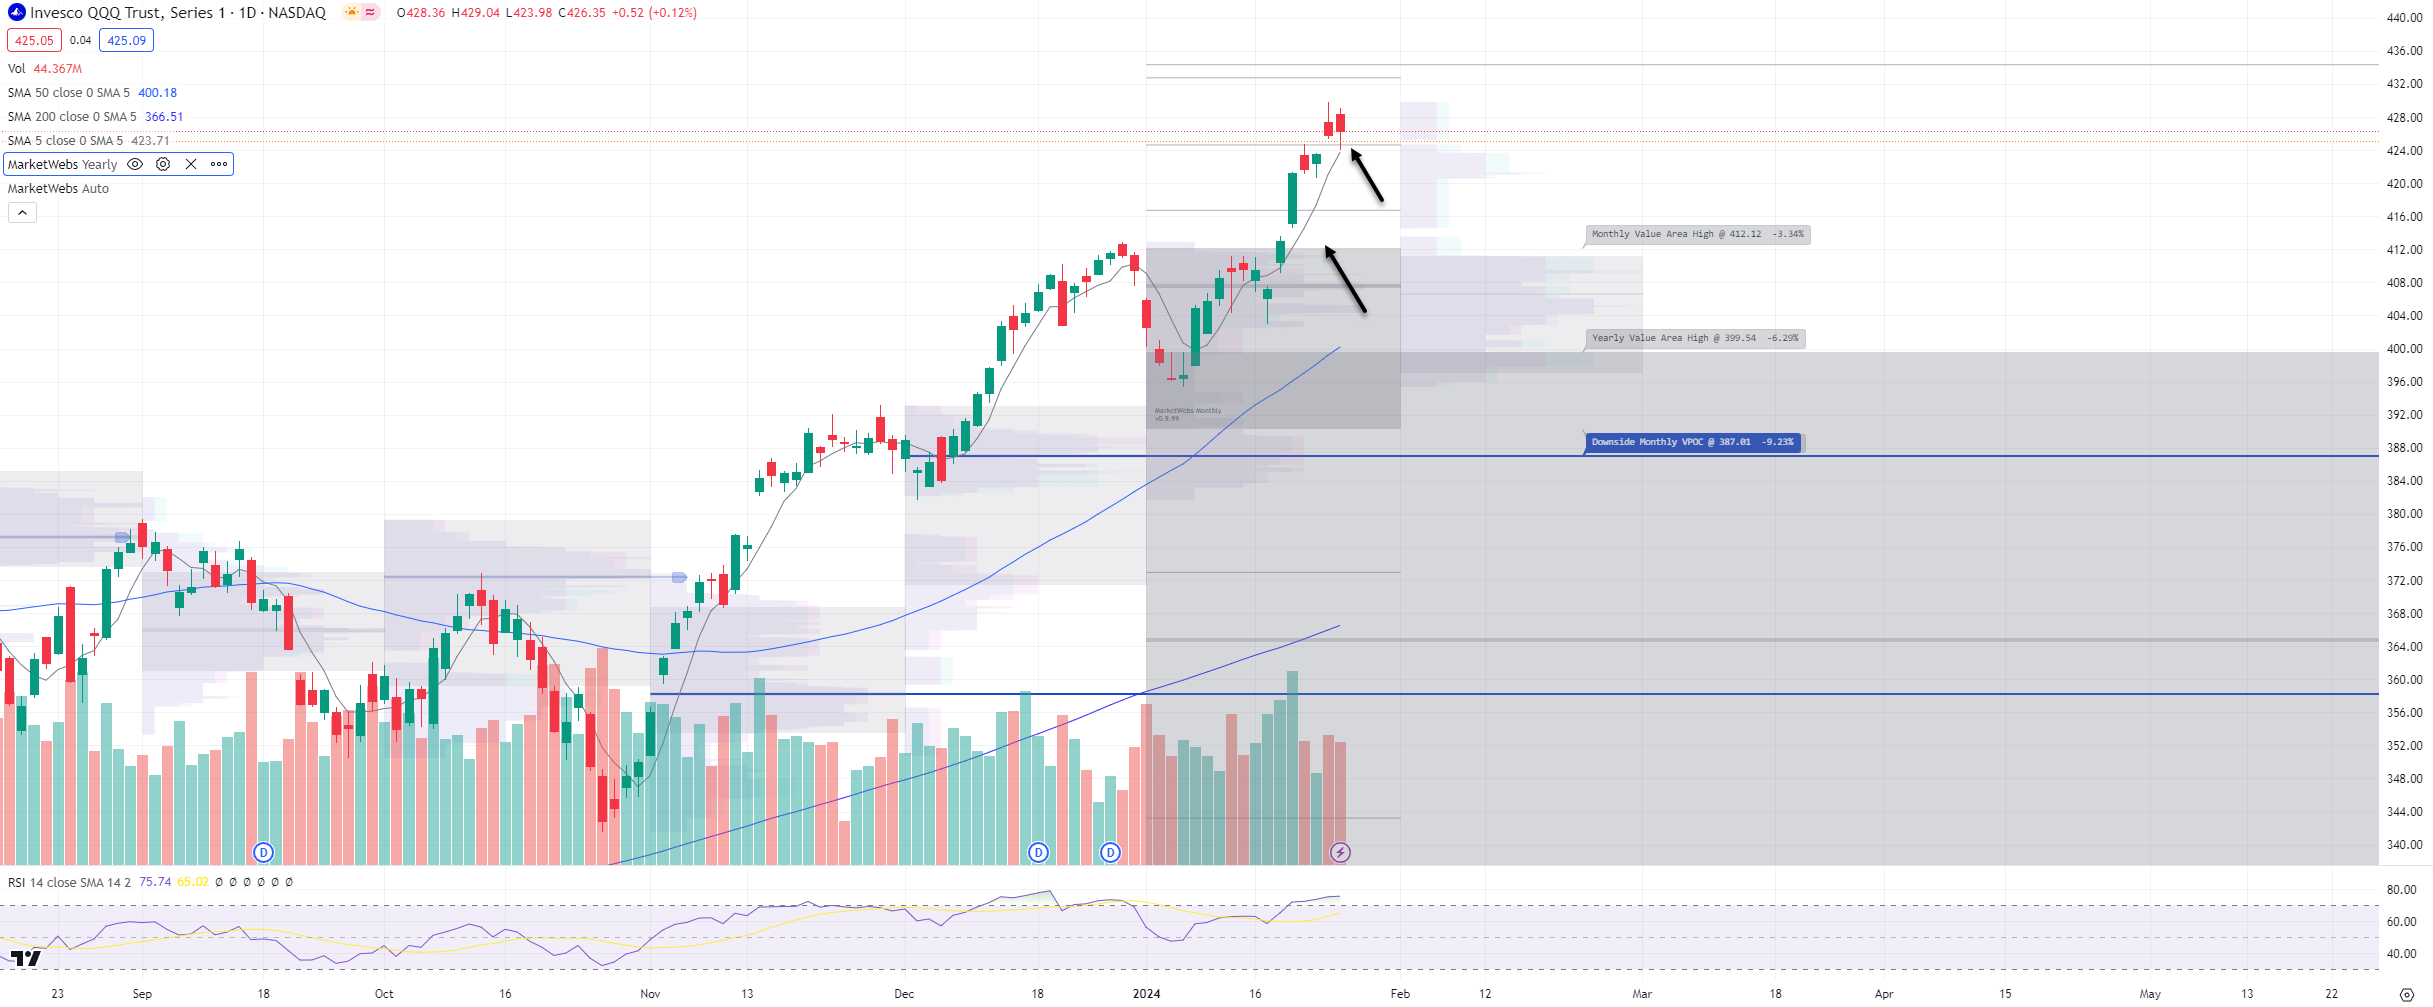
QQQ - NDX 100 ETF - Daily chart: Price ind. -0.3%, let see of price can stay above that 5d MA today as price remains decently above its Jan Value Area
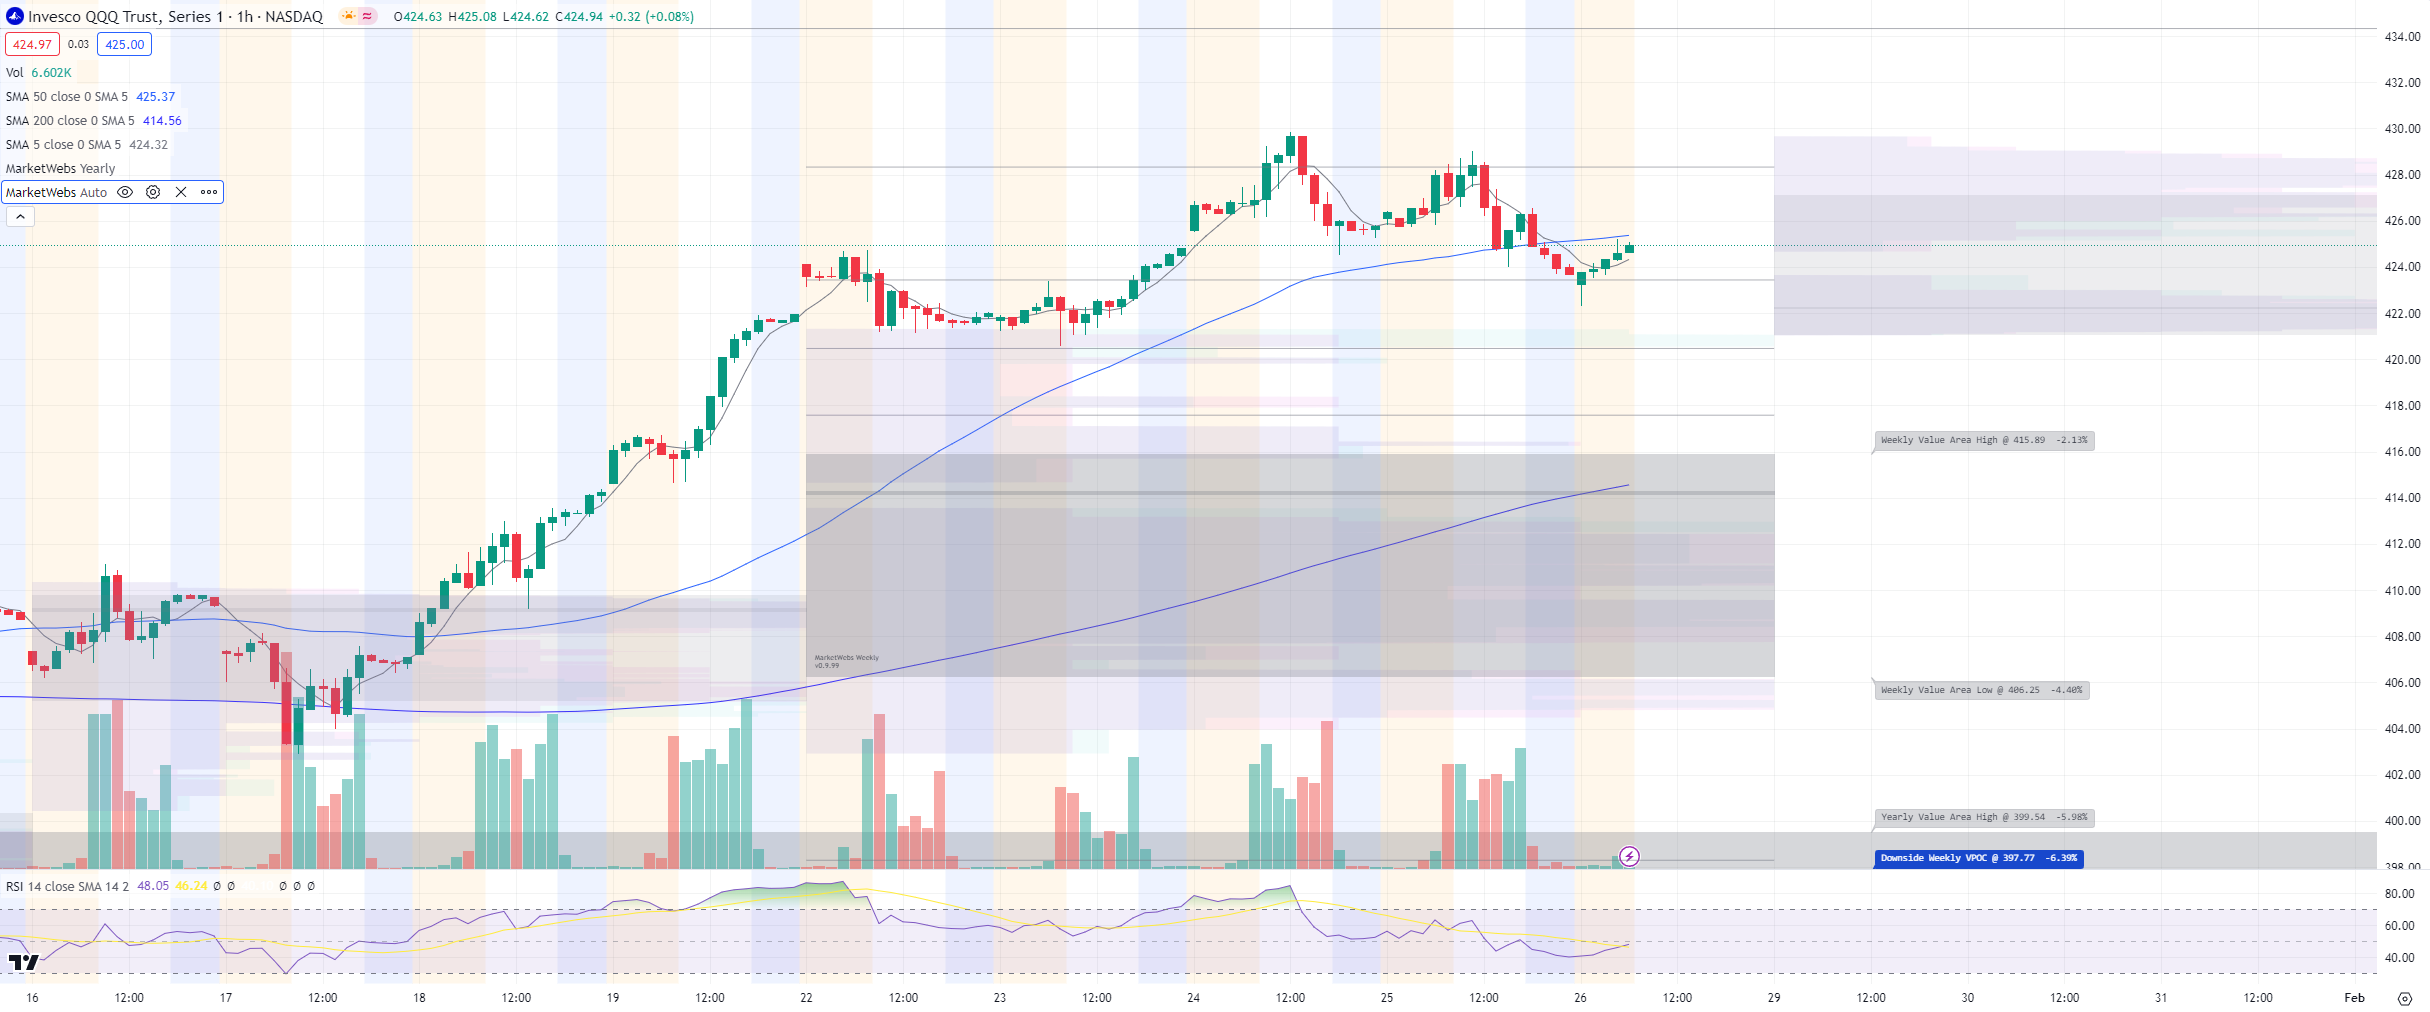
1hr chart: Price a little weak this morning on the back of INTC & KLAC earnings weakness , but still decently above its Value Area for the week
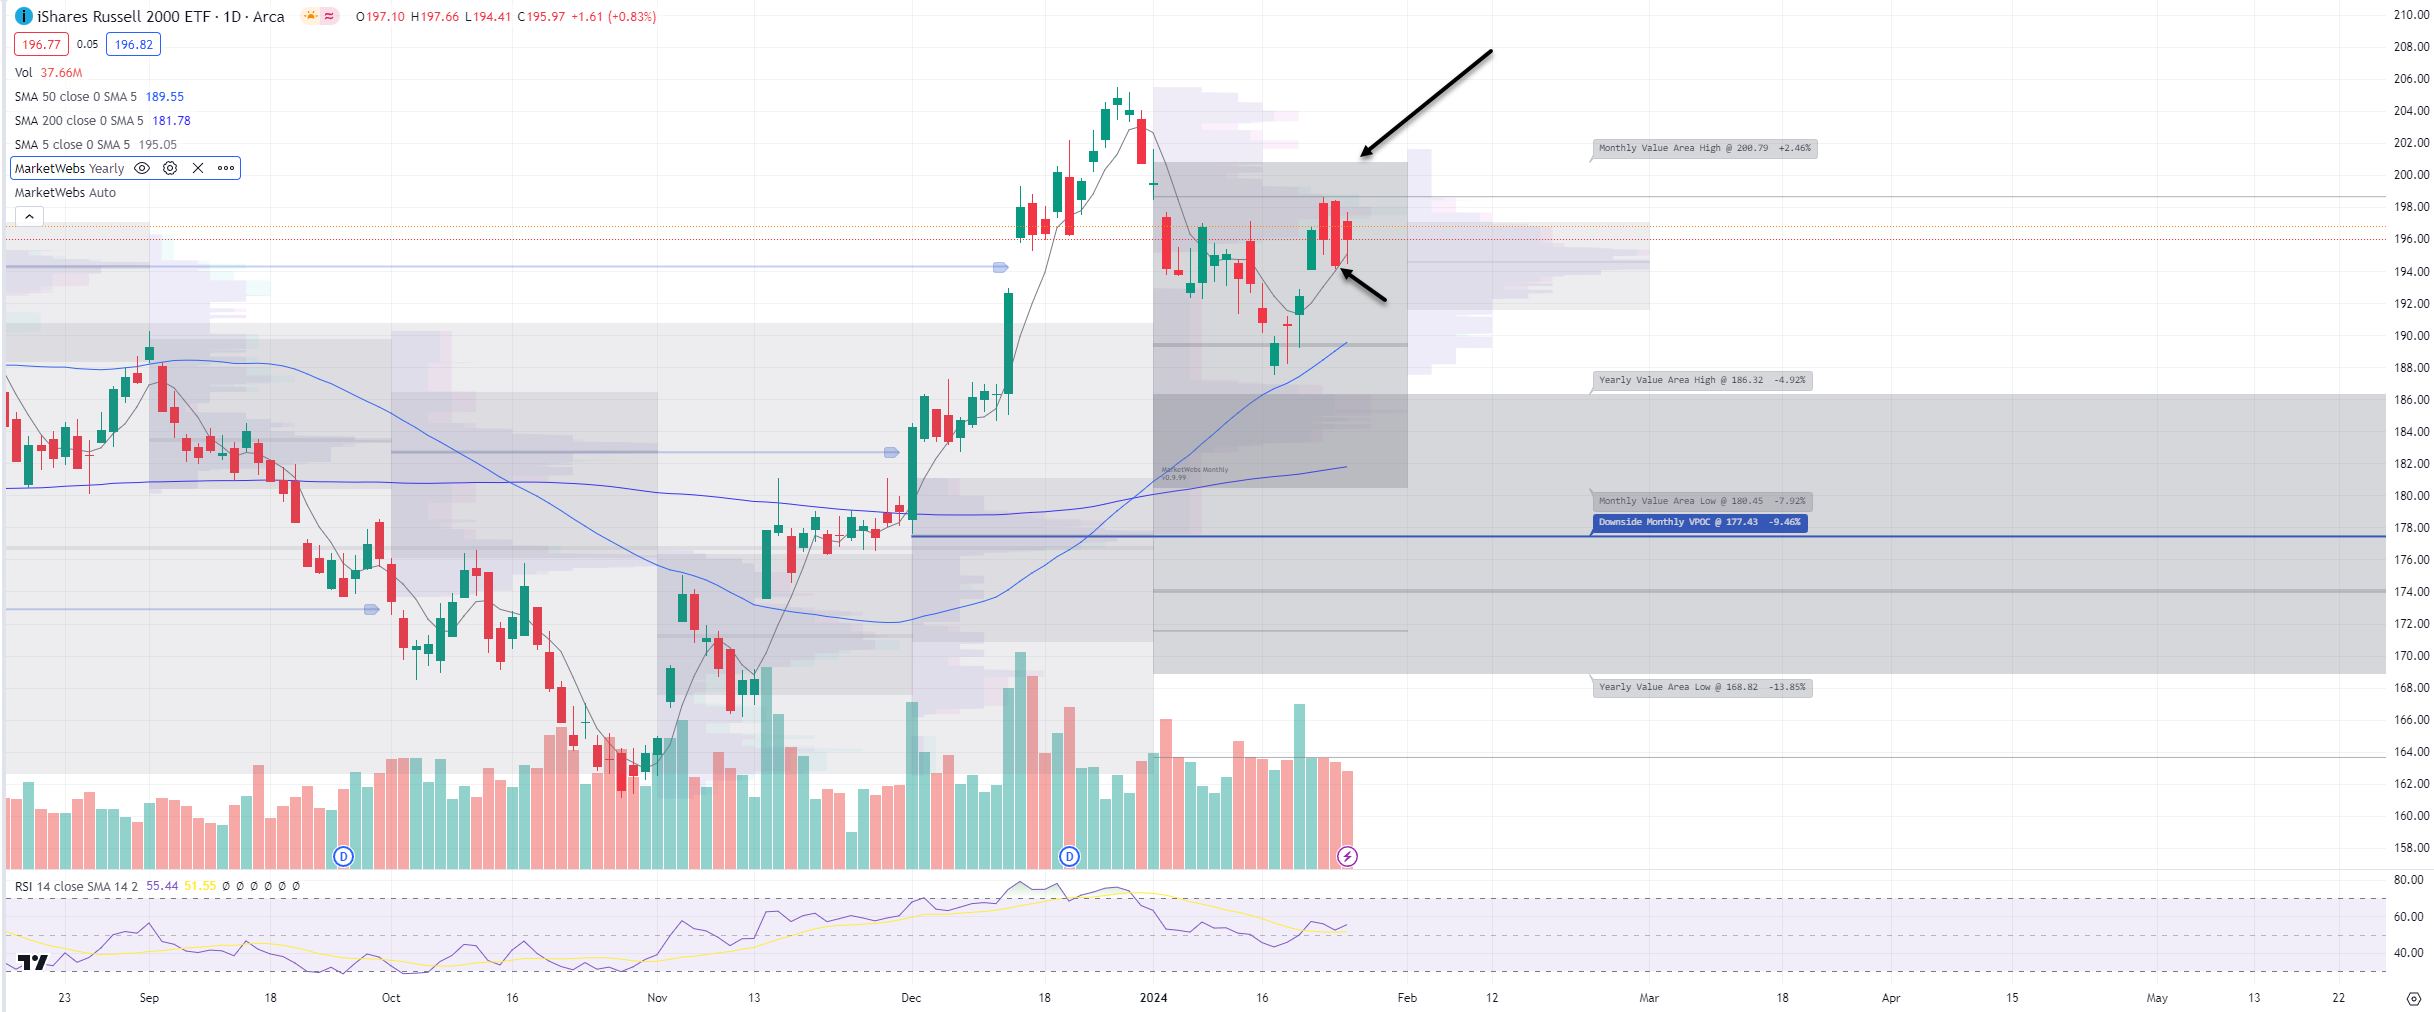
IWM - Russell Small Cap ETF- Price outperforming this morning, ind. +0.5% and after whippy price action this week , still managing to stay above its 5d MA and remains inside its Jan Value Area
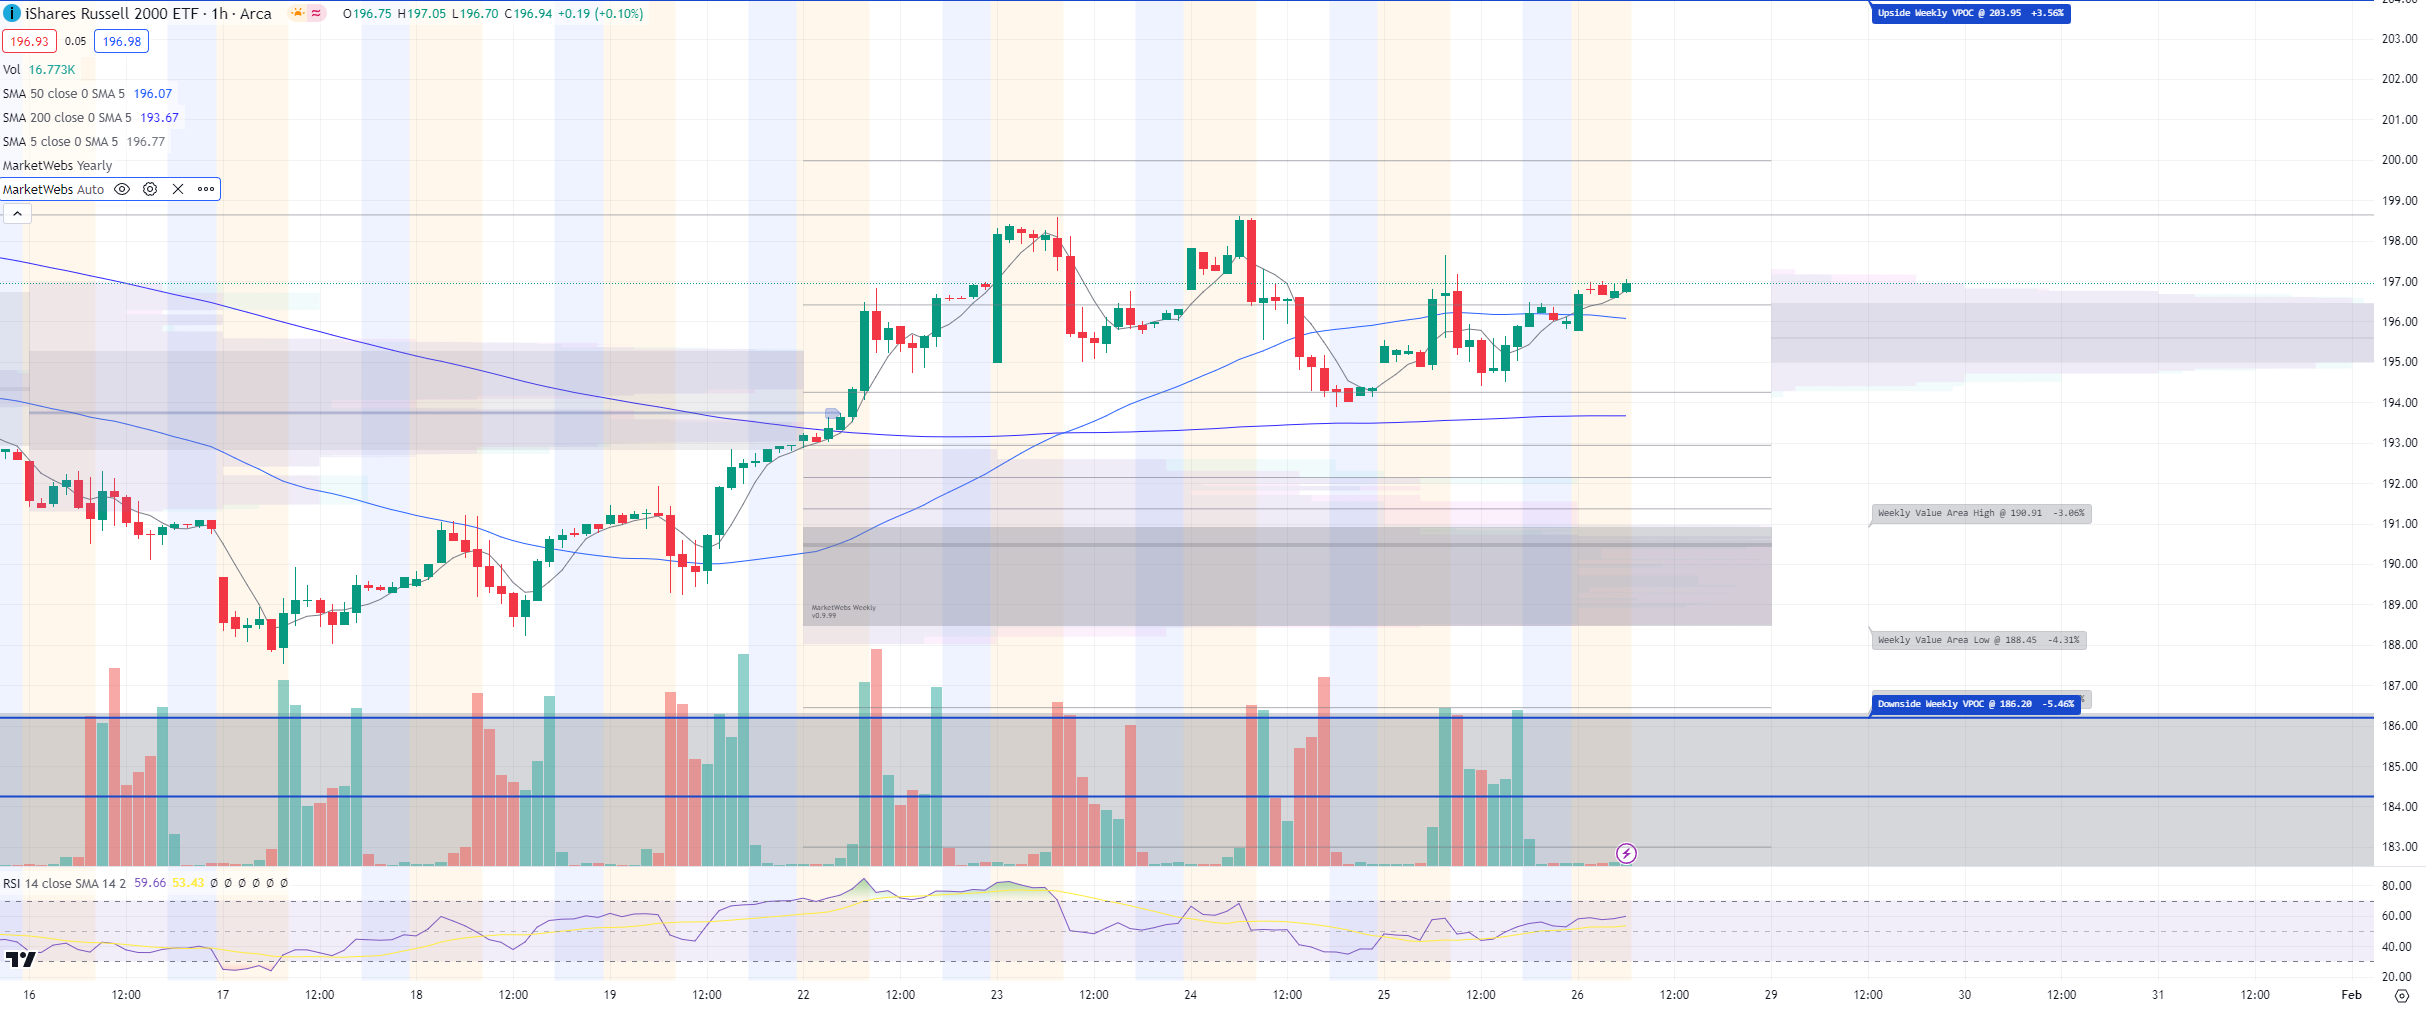
1hr chart: Price sideways for the week after exploring the bottom & top of the range this week , still watching for a break one way or another.
Here is today’s TTG Proprietary Stock Screen “Out of the Box” using Volume At Price
names trending above their Value Areas (on 3 multiple timeframes & not super extended)
Keep reading with a 7-day free trial
Subscribe to The Tribeca Trade Group to keep reading this post and get 7 days of free access to the full post archives.