TTG Index Charts & Out of the Box Stock Screen 8/30/23 $APH $GOOGL
Out of the Box MarketWebs Screen
US Dollar flat / 30yr Bonds -0.3%/ Crude +0.6% & Nat Gas +1.7% / Copper -0.3% / Cryptos are lower BTC -1.8%
Index Updates
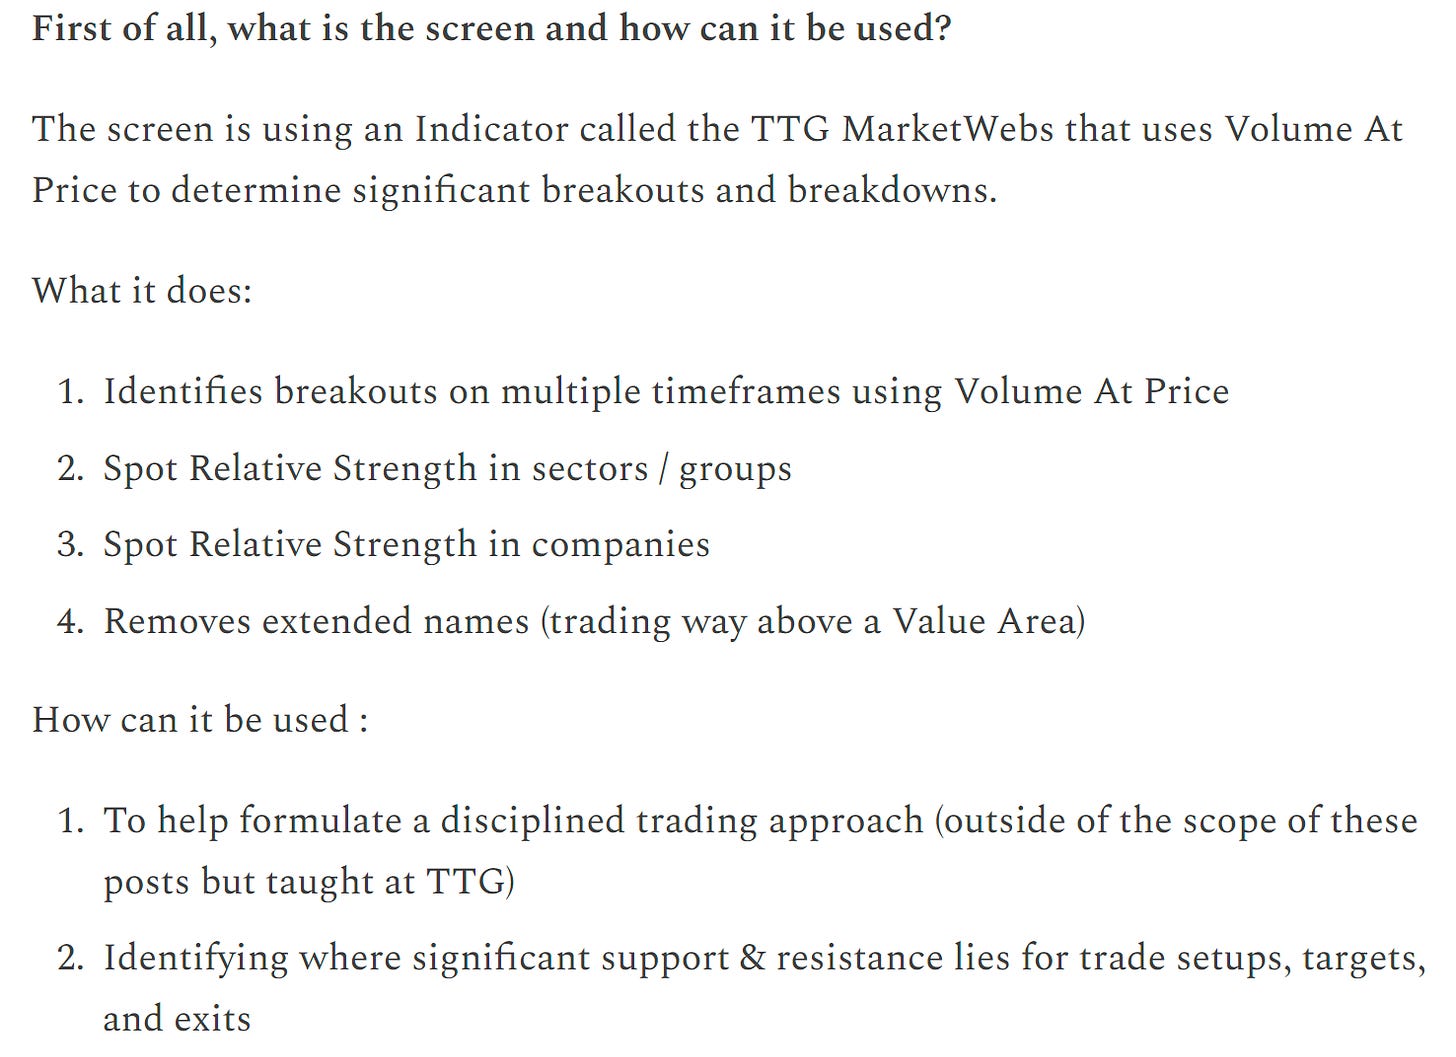
At TTG, I use Volume At Price in my chart analysis and I use the MarketWebs Indicator to provide Value Areas which indicate significant support & resistance levels. Learn More Here about Volume At Price and the MarketWebs.
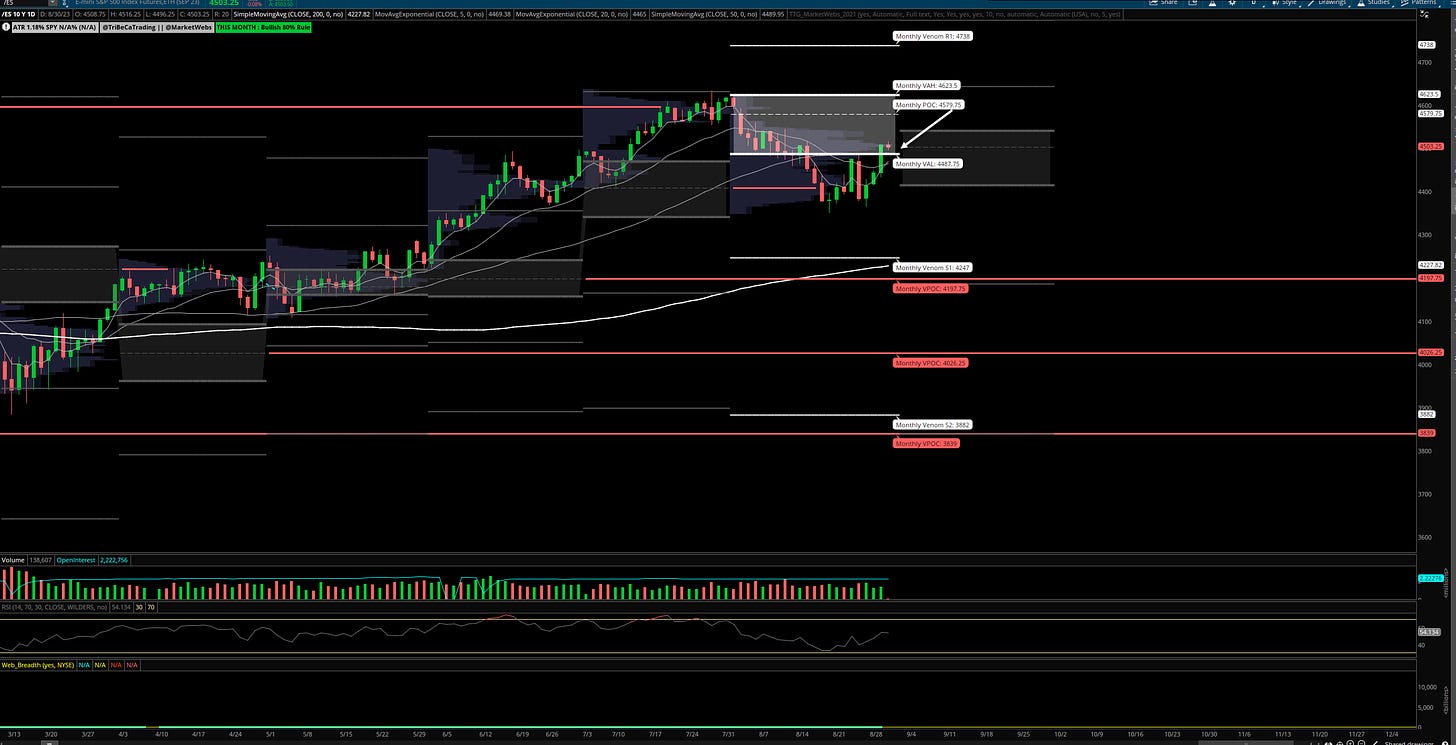
$ES_F - S&P futures - Daily chart: Big moves yesterday and price for the S&P is now back into the August Value Area and above all its MAs (Moving Averages). Support is now 4487.75 bottom of the August Value Area.
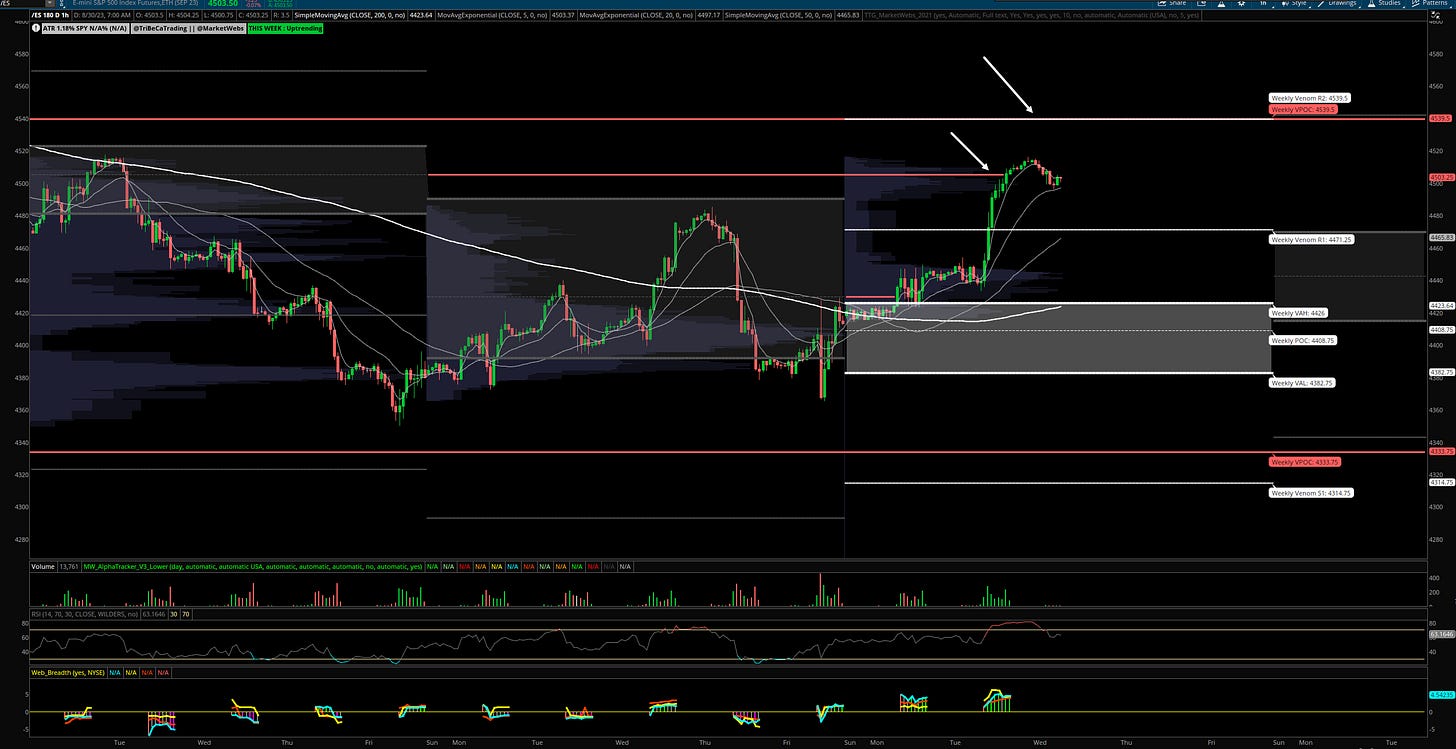
1hr chart: Price is consolidating after taking out a VPOC (red line) @ 4505. Note is price can continue to trend, there is another VPOC @ 4539.5
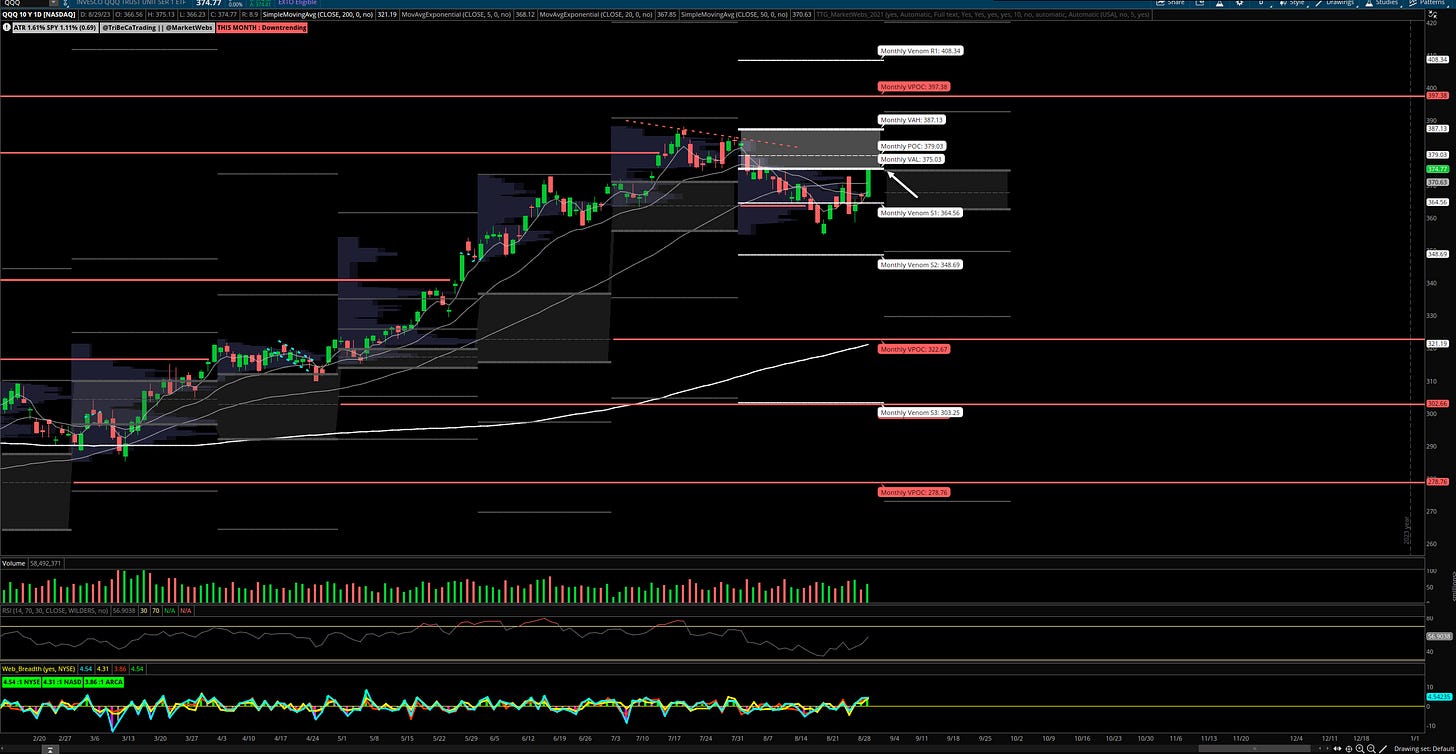
QQQ - NDX 100 ETF - Daily chart: After yesterday's rally, price is right at the bottom of the August Value Area, watch $375.04 resistance. Also notable is price is back above all short term MAs.
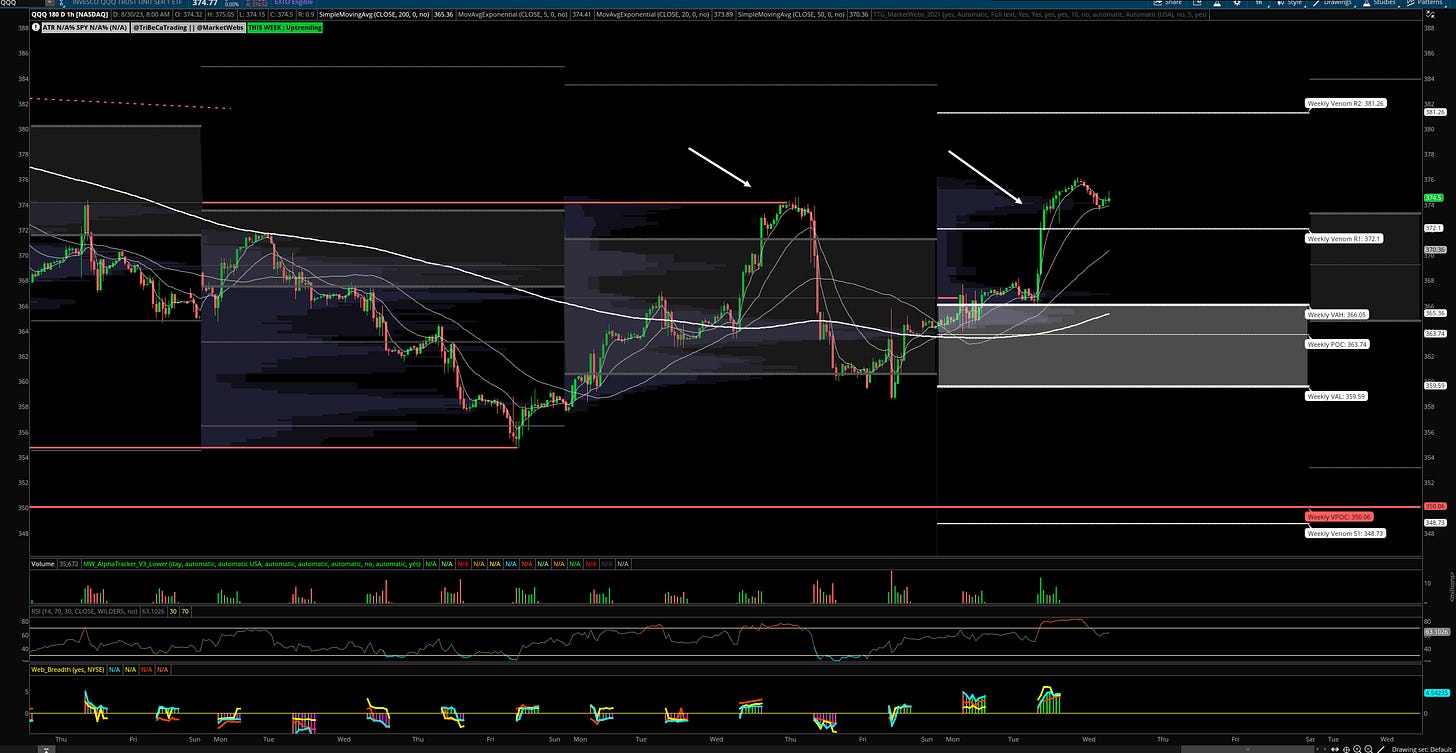
1hr chart: Price is consolidating this morning at last week's highs
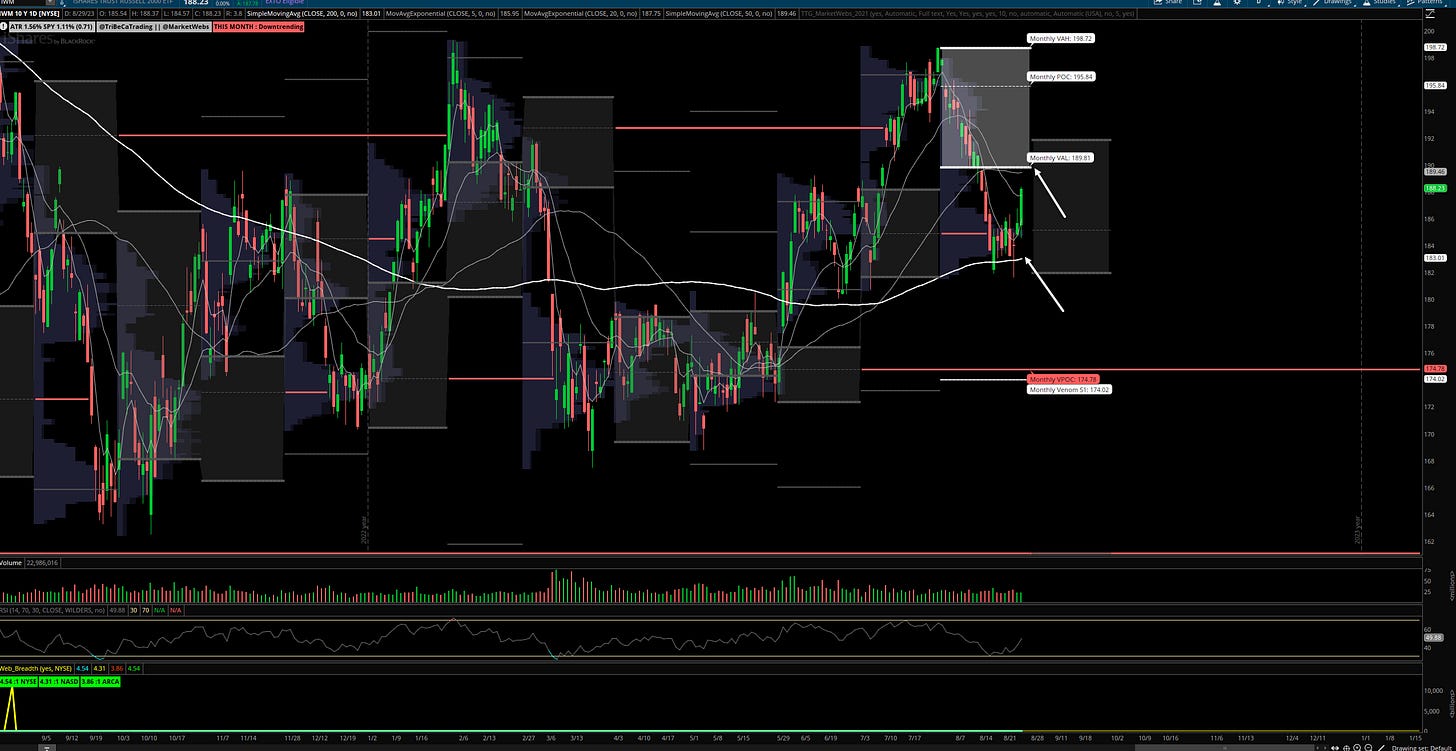
IWM- Russell Small Cap ETF- Daily Chart: Price has rallied nicely off its 200d MA following last Friday's reversal. Now, resistance is starting to come into the picture at $189.81 bottom of its August Value Area
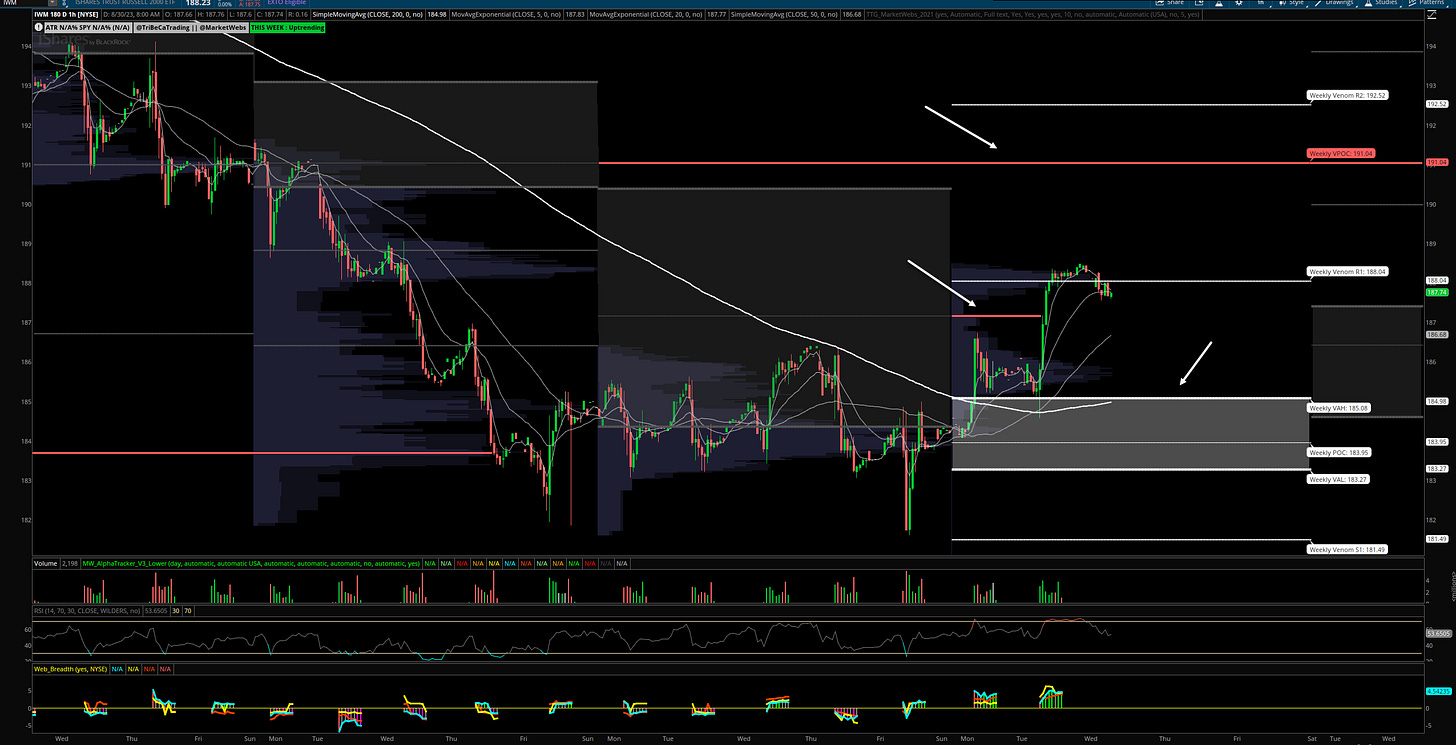
1hr chart: Price is consolidating this morning after taking out at 1hr VPOC
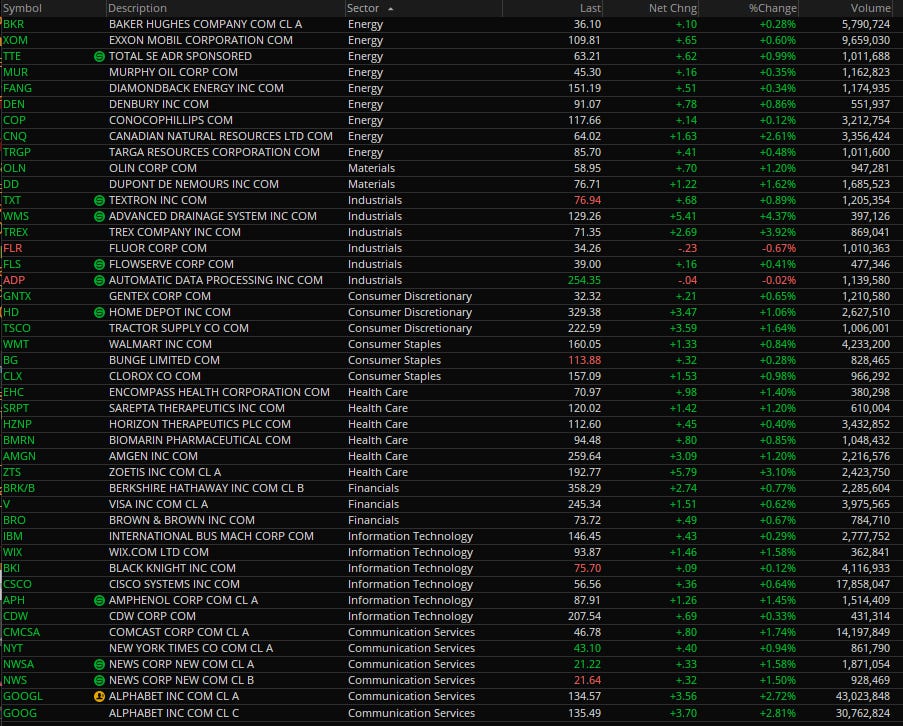
Here is today’s TTG Proprietary Stock Screen “Out of the Box” using Volume At Price
Remember, I am only showing a few setups from the list here and review more in the TTG Trading Room. I provide a more detailed watchlist every weekend to start the week at TTG.
Charts
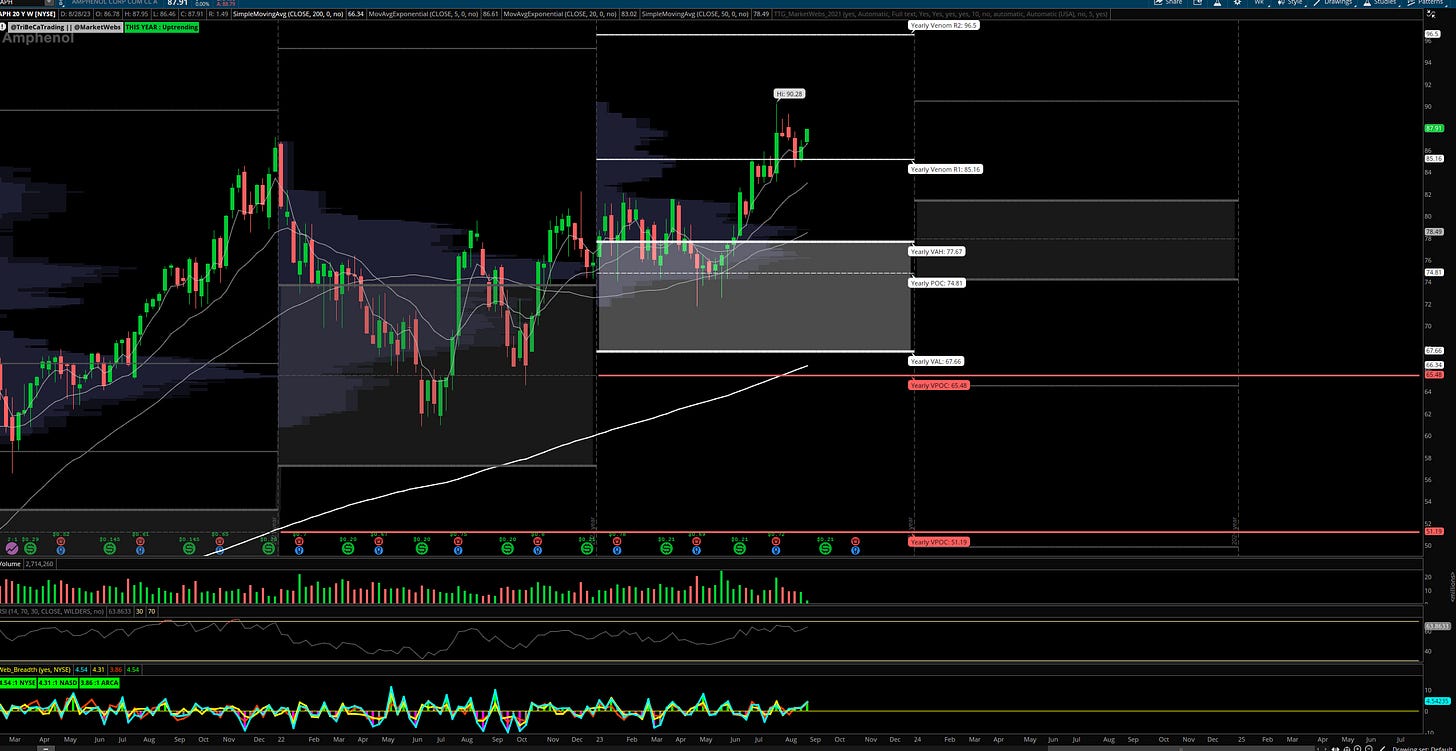
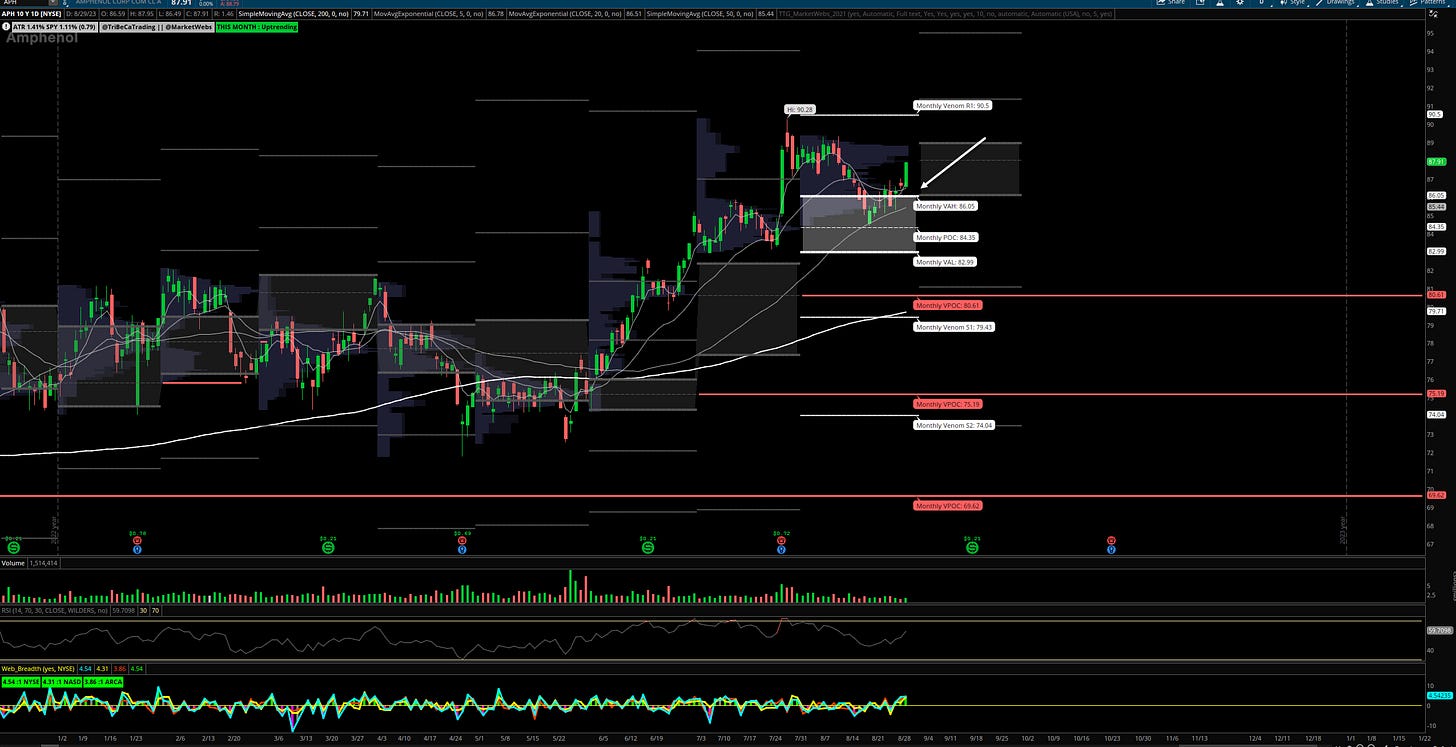
APH Weekly & Daily chart
Amphenol Corporation designs, manufactures, and markets electrical, electronic and fiber optic connectors, interconnect systems, and coaxial and flat-ribbon cable. The Company's products are used in a variety of industries, including telephone, wireless, and data communications systems, cable television systems, and commercial and military aerospace electronics. (Bloomberg)
-suggested stop price $85 using the TTG MarketWebs.
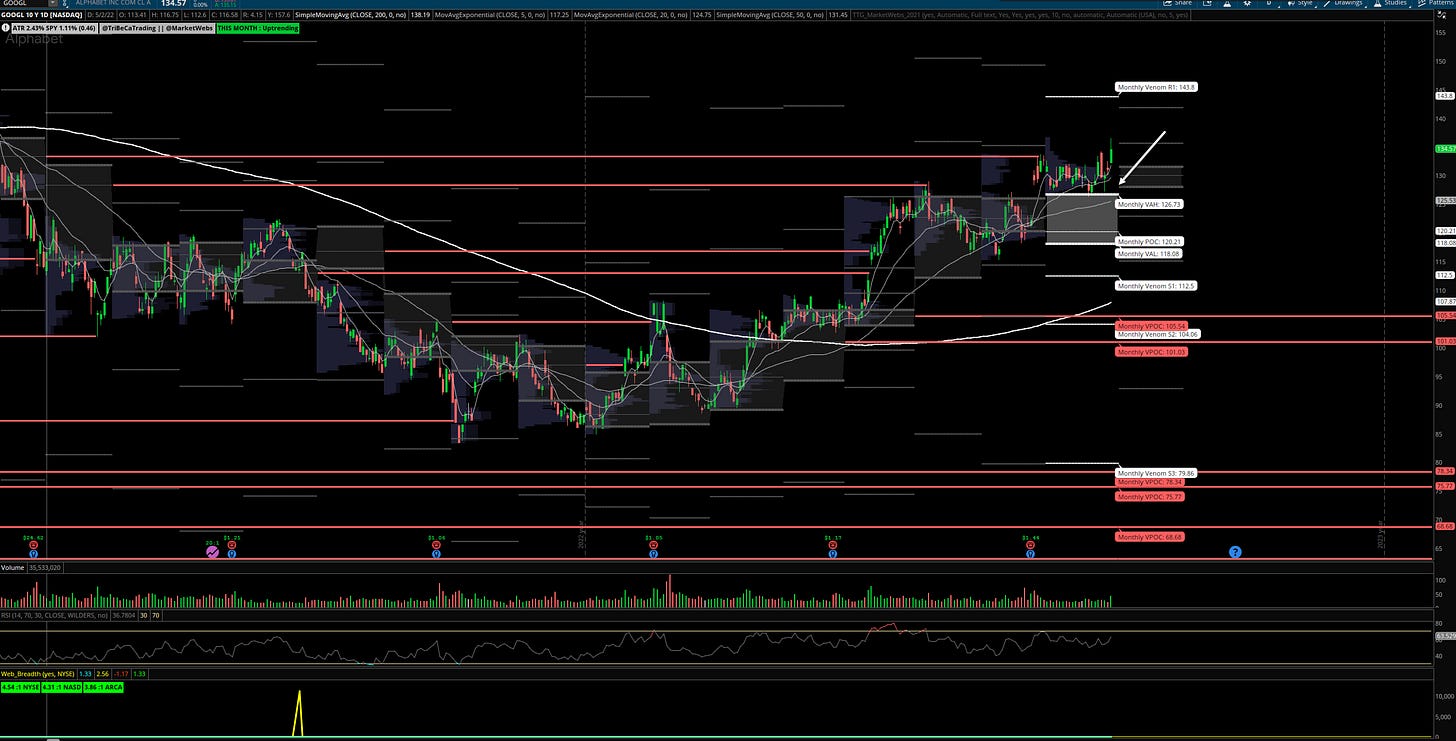
GOOGL Weekly & Daily chart
Alphabet Inc. operates as a holding company. The Company, through its subsidiaries, provides web-based search, advertisements, maps, software applications, mobile operating systems, consumer content, enterprise solutions, commerce, and hardware products.(Bloomberg)
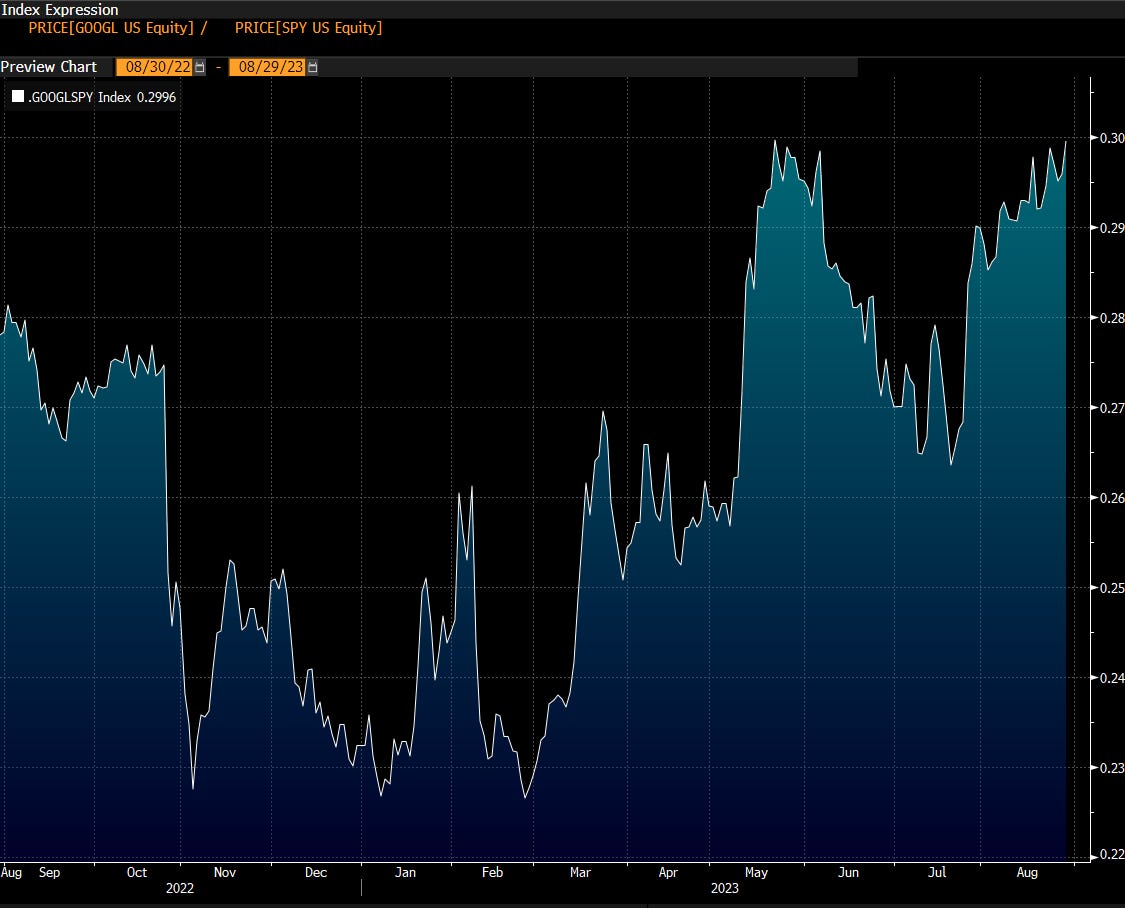
-suggested stop price $126 using the TTG MarketWebs & first upside price target $141.8. GOOGL has held up well during the month of Aug vs the overall market which I view as a good sign (see third chart)
GOOGL vs SPY
Copyright © Tribeca Trade Group. All of the information in this newsletter is for entertainment and educational purposes only and is not to be construed as investment or trading advice. None of the information in this newsletter is guaranteed to be accurate, complete, useful or timely. IMPORTANT NOTICES AND DISCLAIMERS TriBeCa Trade Group is not an investment advisor and is not registered with the U.S. Securities and Exchange Commission or the Financial Industry Regulatory Authority. Further, owners, employees, agents or representatives of TriBeCa Trade Group are not acting as investment advisors and might not be registered with the U.S. Securities Authority


