

TTG Index Charts & Out of the Box Stock Screen 01/18/24 $TMUS $ACN
TTG Index Charts & Out of the Box Stock Screen 01/18/24 $TMUS $ACN
Out of the Box MarketWebs Screen
US Dollar -0.1% / 30yr Bonds +0.1% / Crude +0.1% & Nat Gas -2.0% / Gold +0.6% / Copper -0.1% / BTC -1.0%
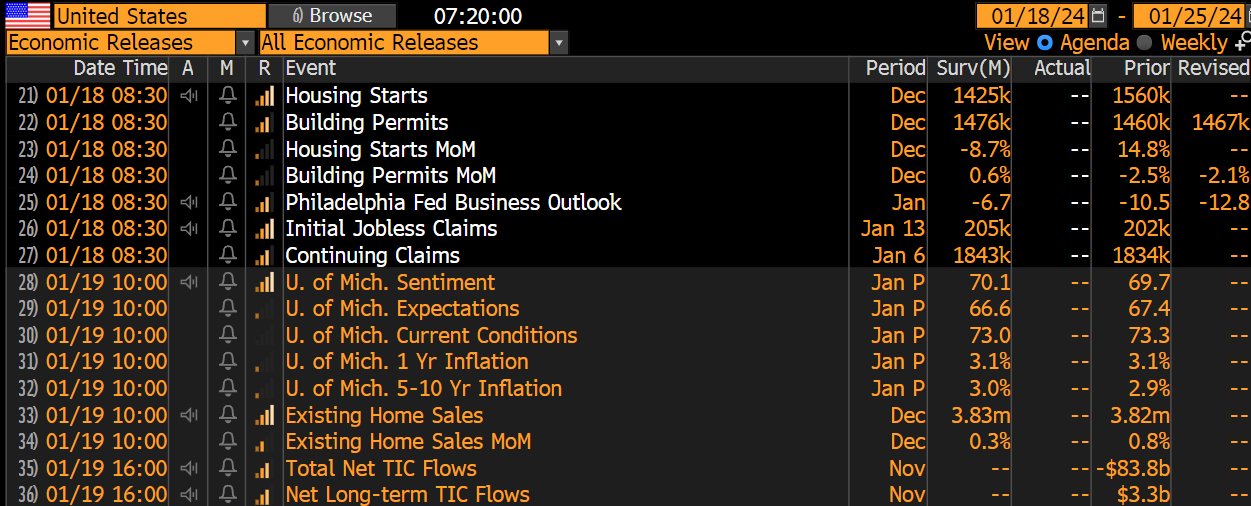
US Upcoming Economics
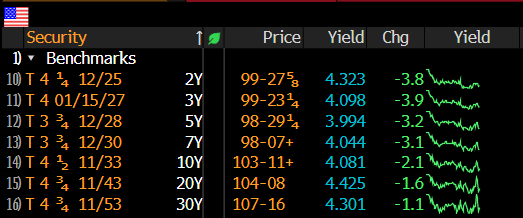
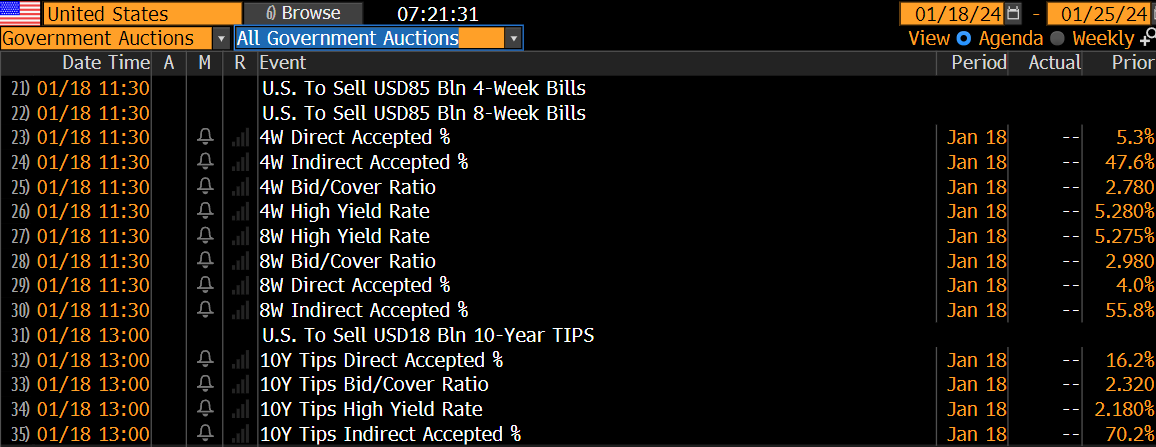
US Bond Yields & Auction Schedule
Index Updates
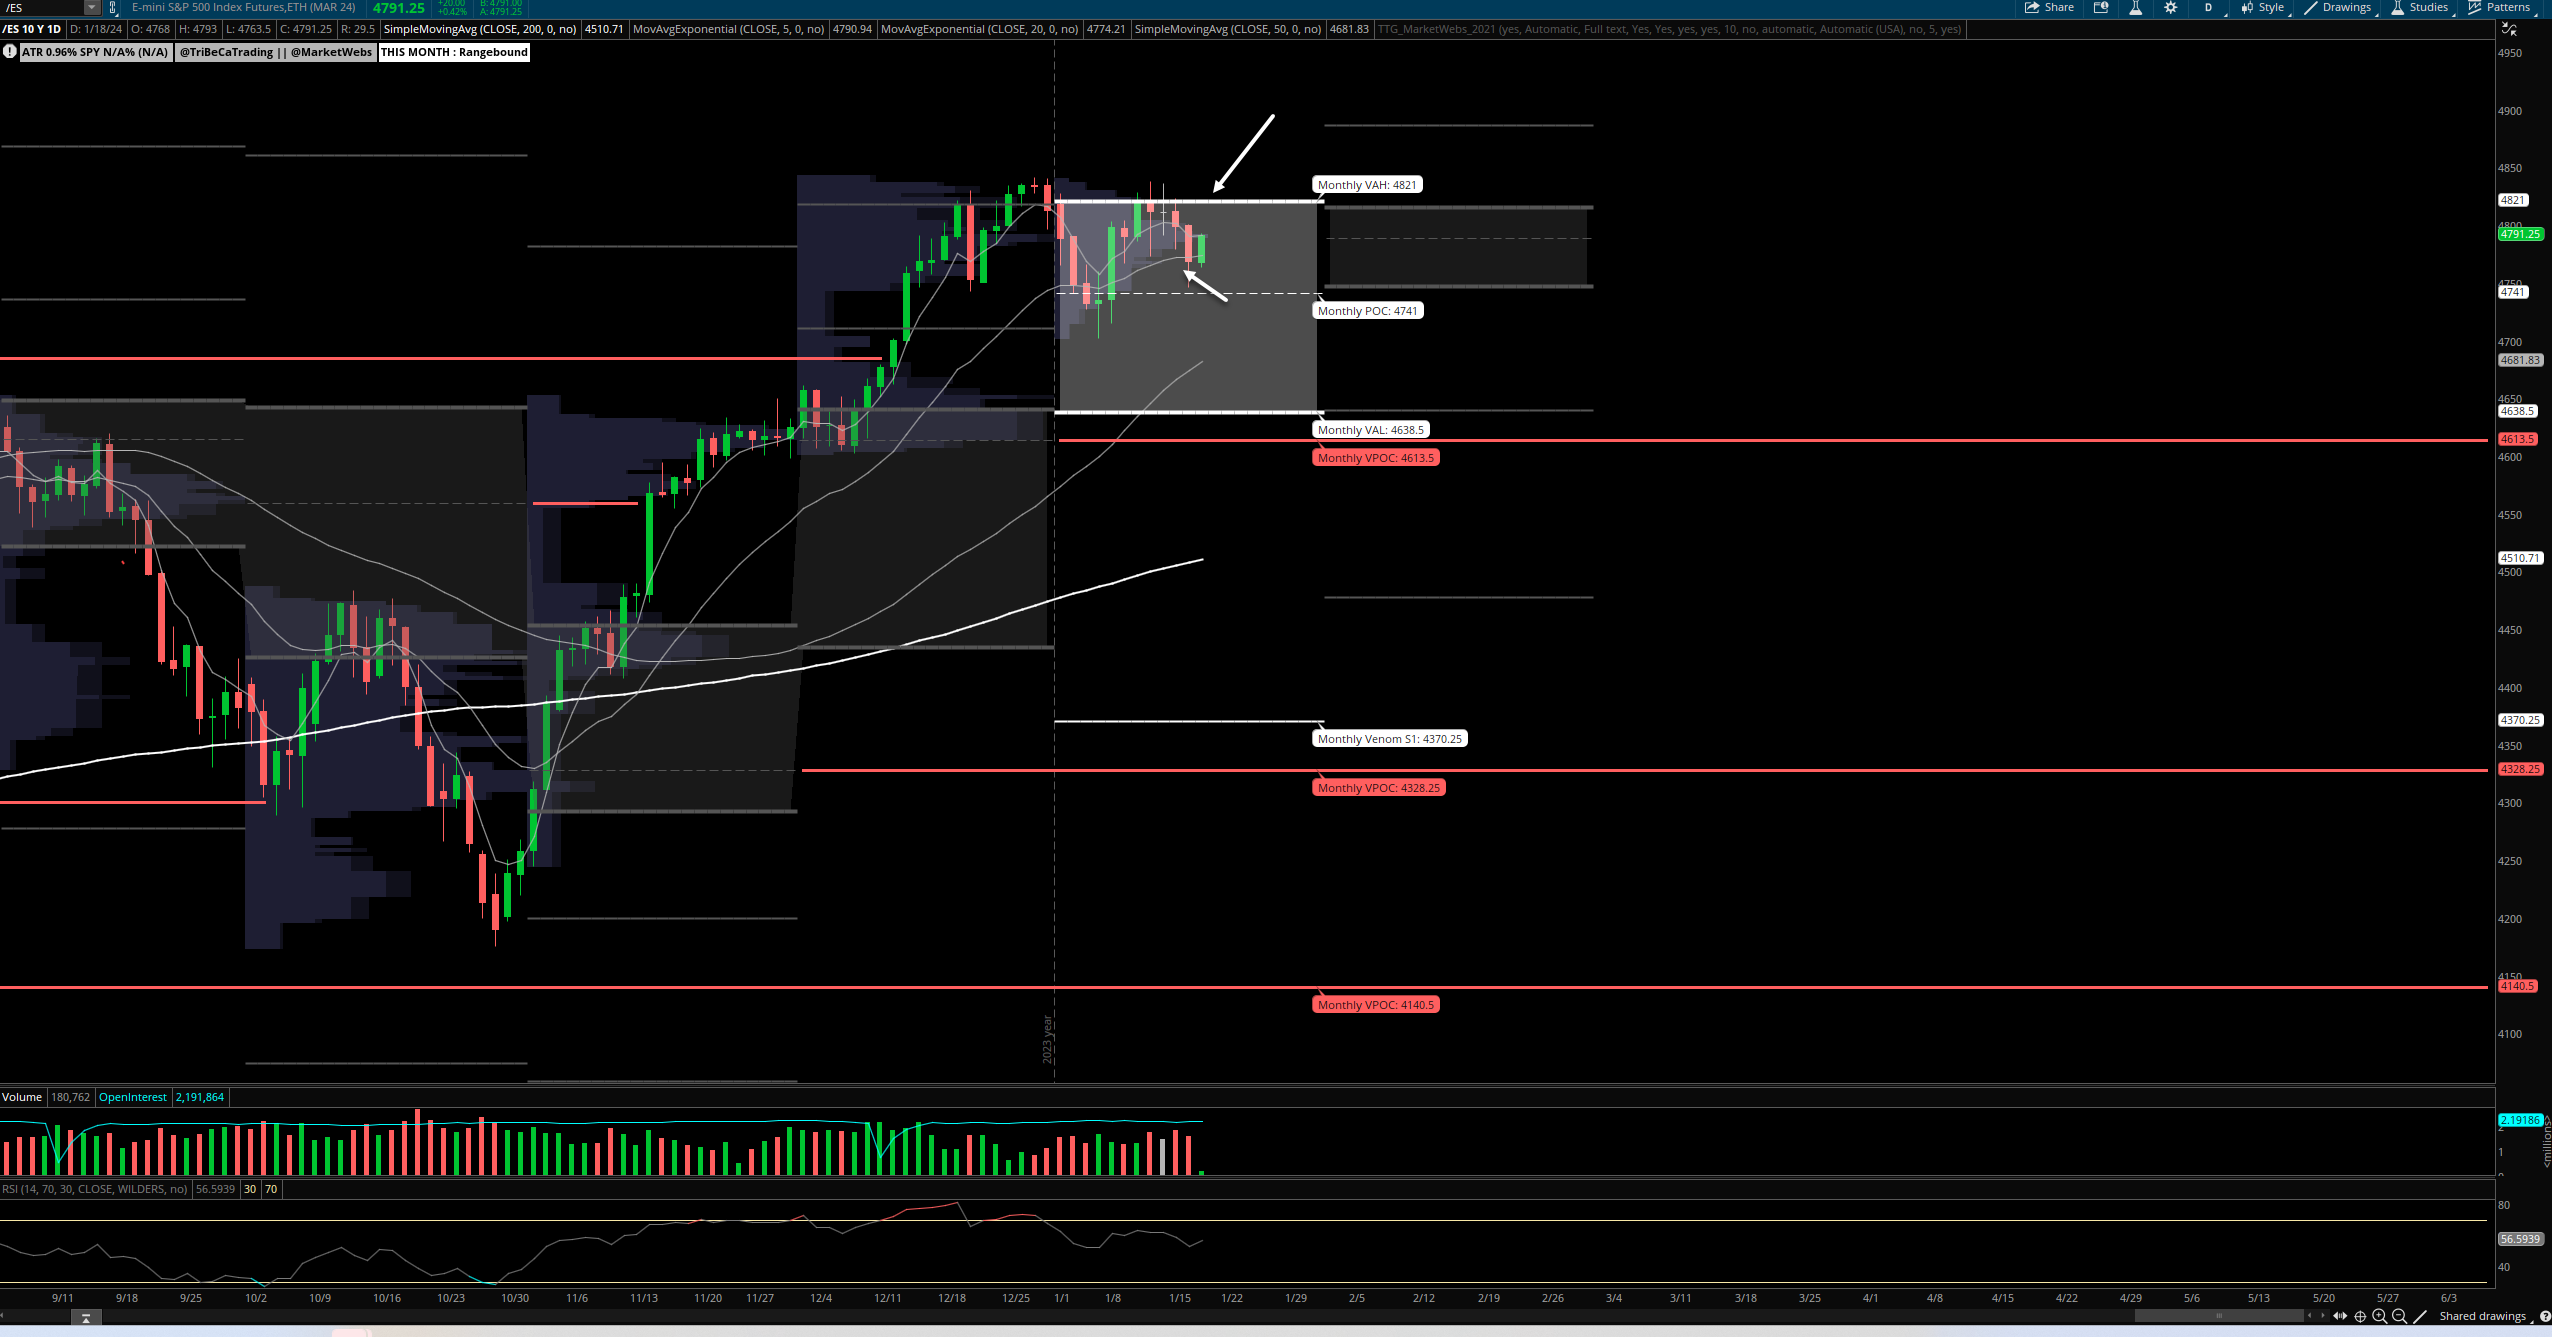
At TTG, I use Volume At Price in my chart analysis and I use the MarketWebs Indicator to provide Value Areas & VPOCs which indicate significant support & resistance levels. Learn More Here about Volume At Price and the MarketWebs.
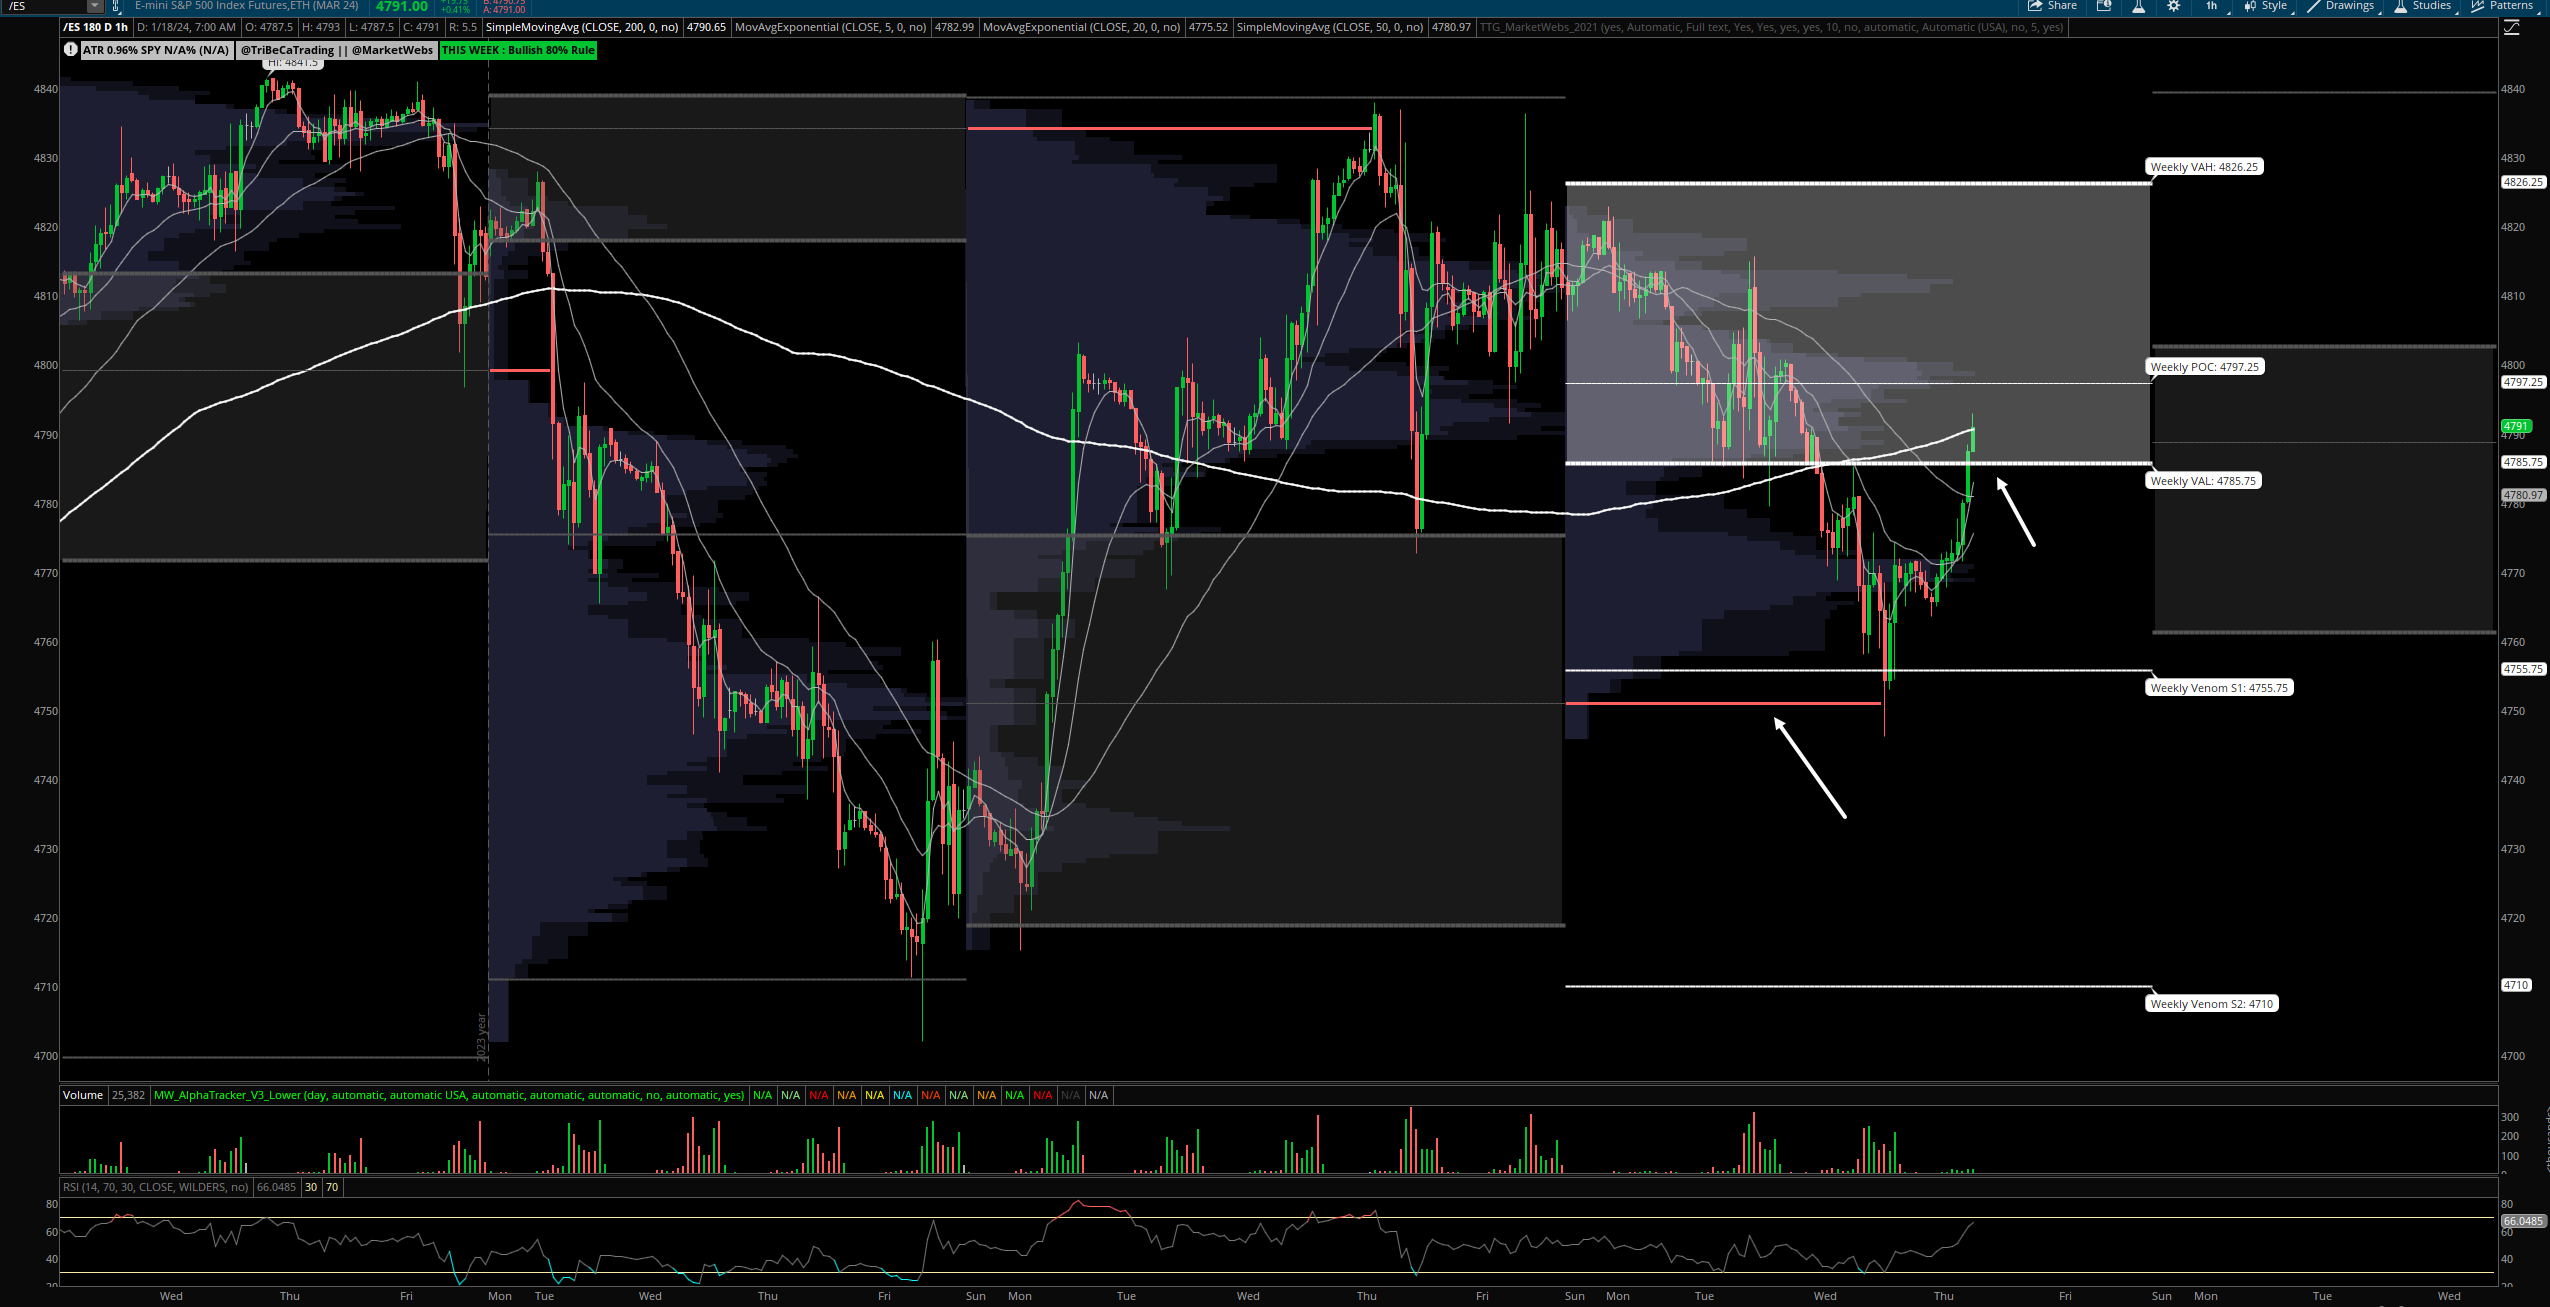
$ES_F- S&P Futures - Price bouncing this morning, ind. +0.4% and I am watching to see if price can stay above both of those short term MAs (Moving Averages) today
1hr chart: Nice reversal off that 1hr VPOC (red line) yesterday and now I am watching to see if price can stay inside its Value Area for the week, watch 4785.75
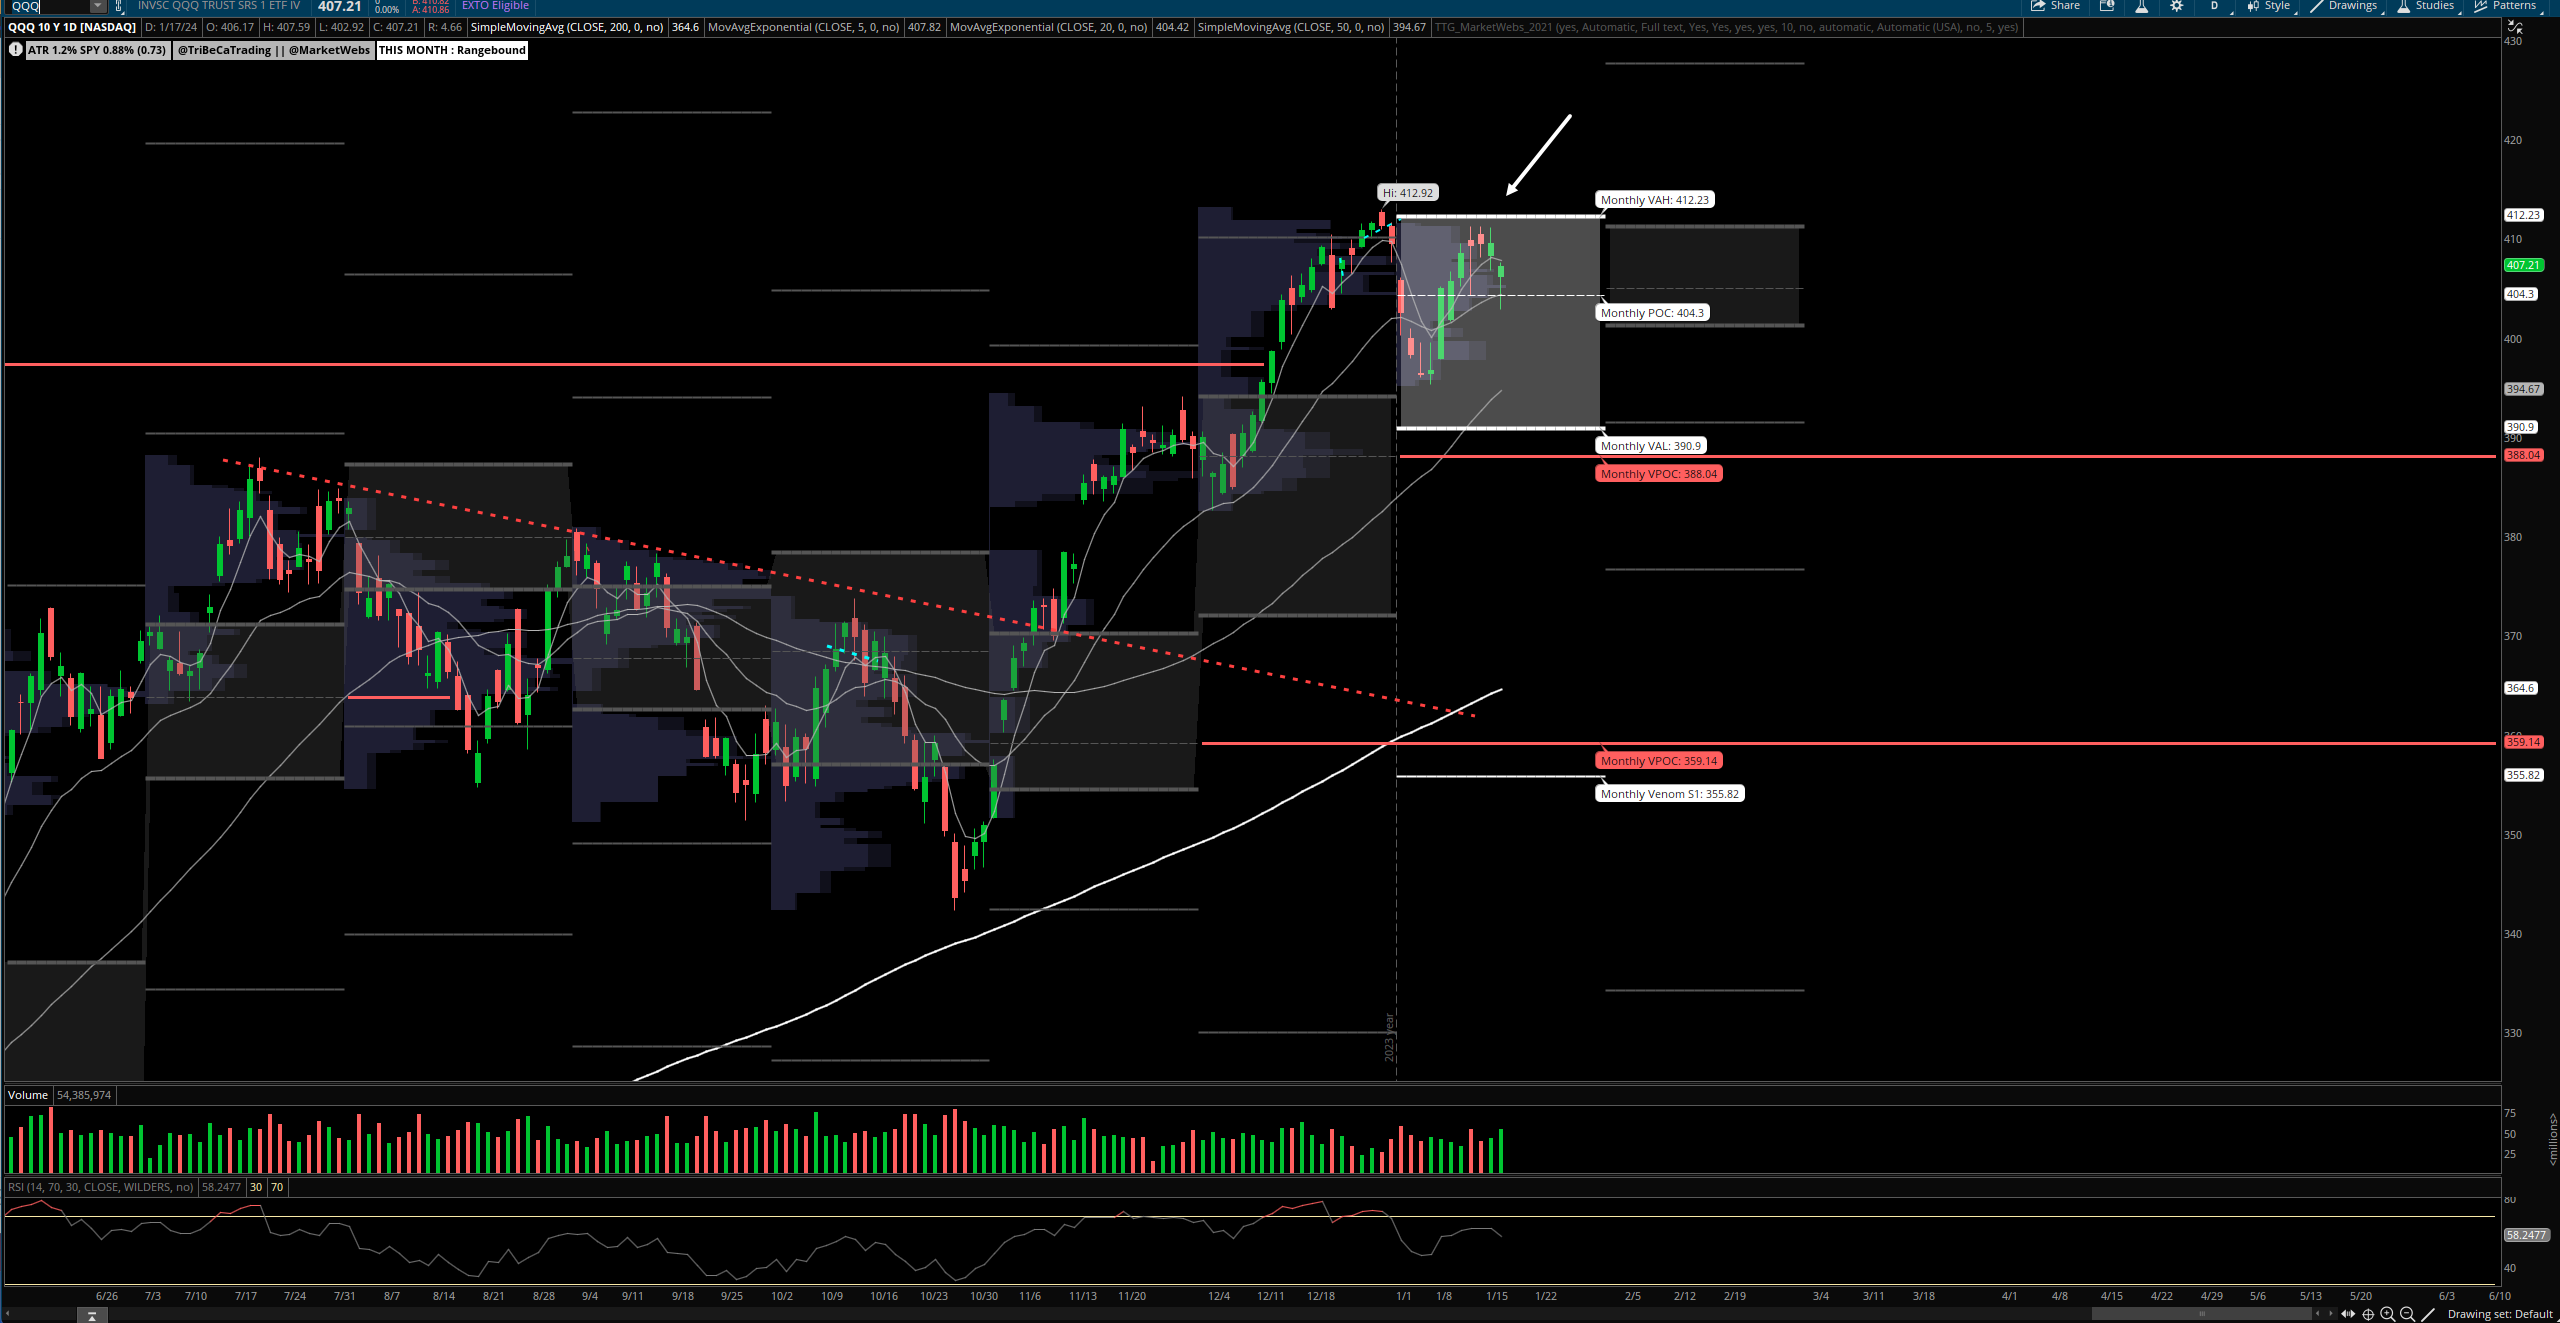
QQQ - NDX 100 ETF - Daily chart: Big move this outperforming, ind. +0.7% & returning to this week's highs, upside level to watch remains $412.23 top of Jan Value Area
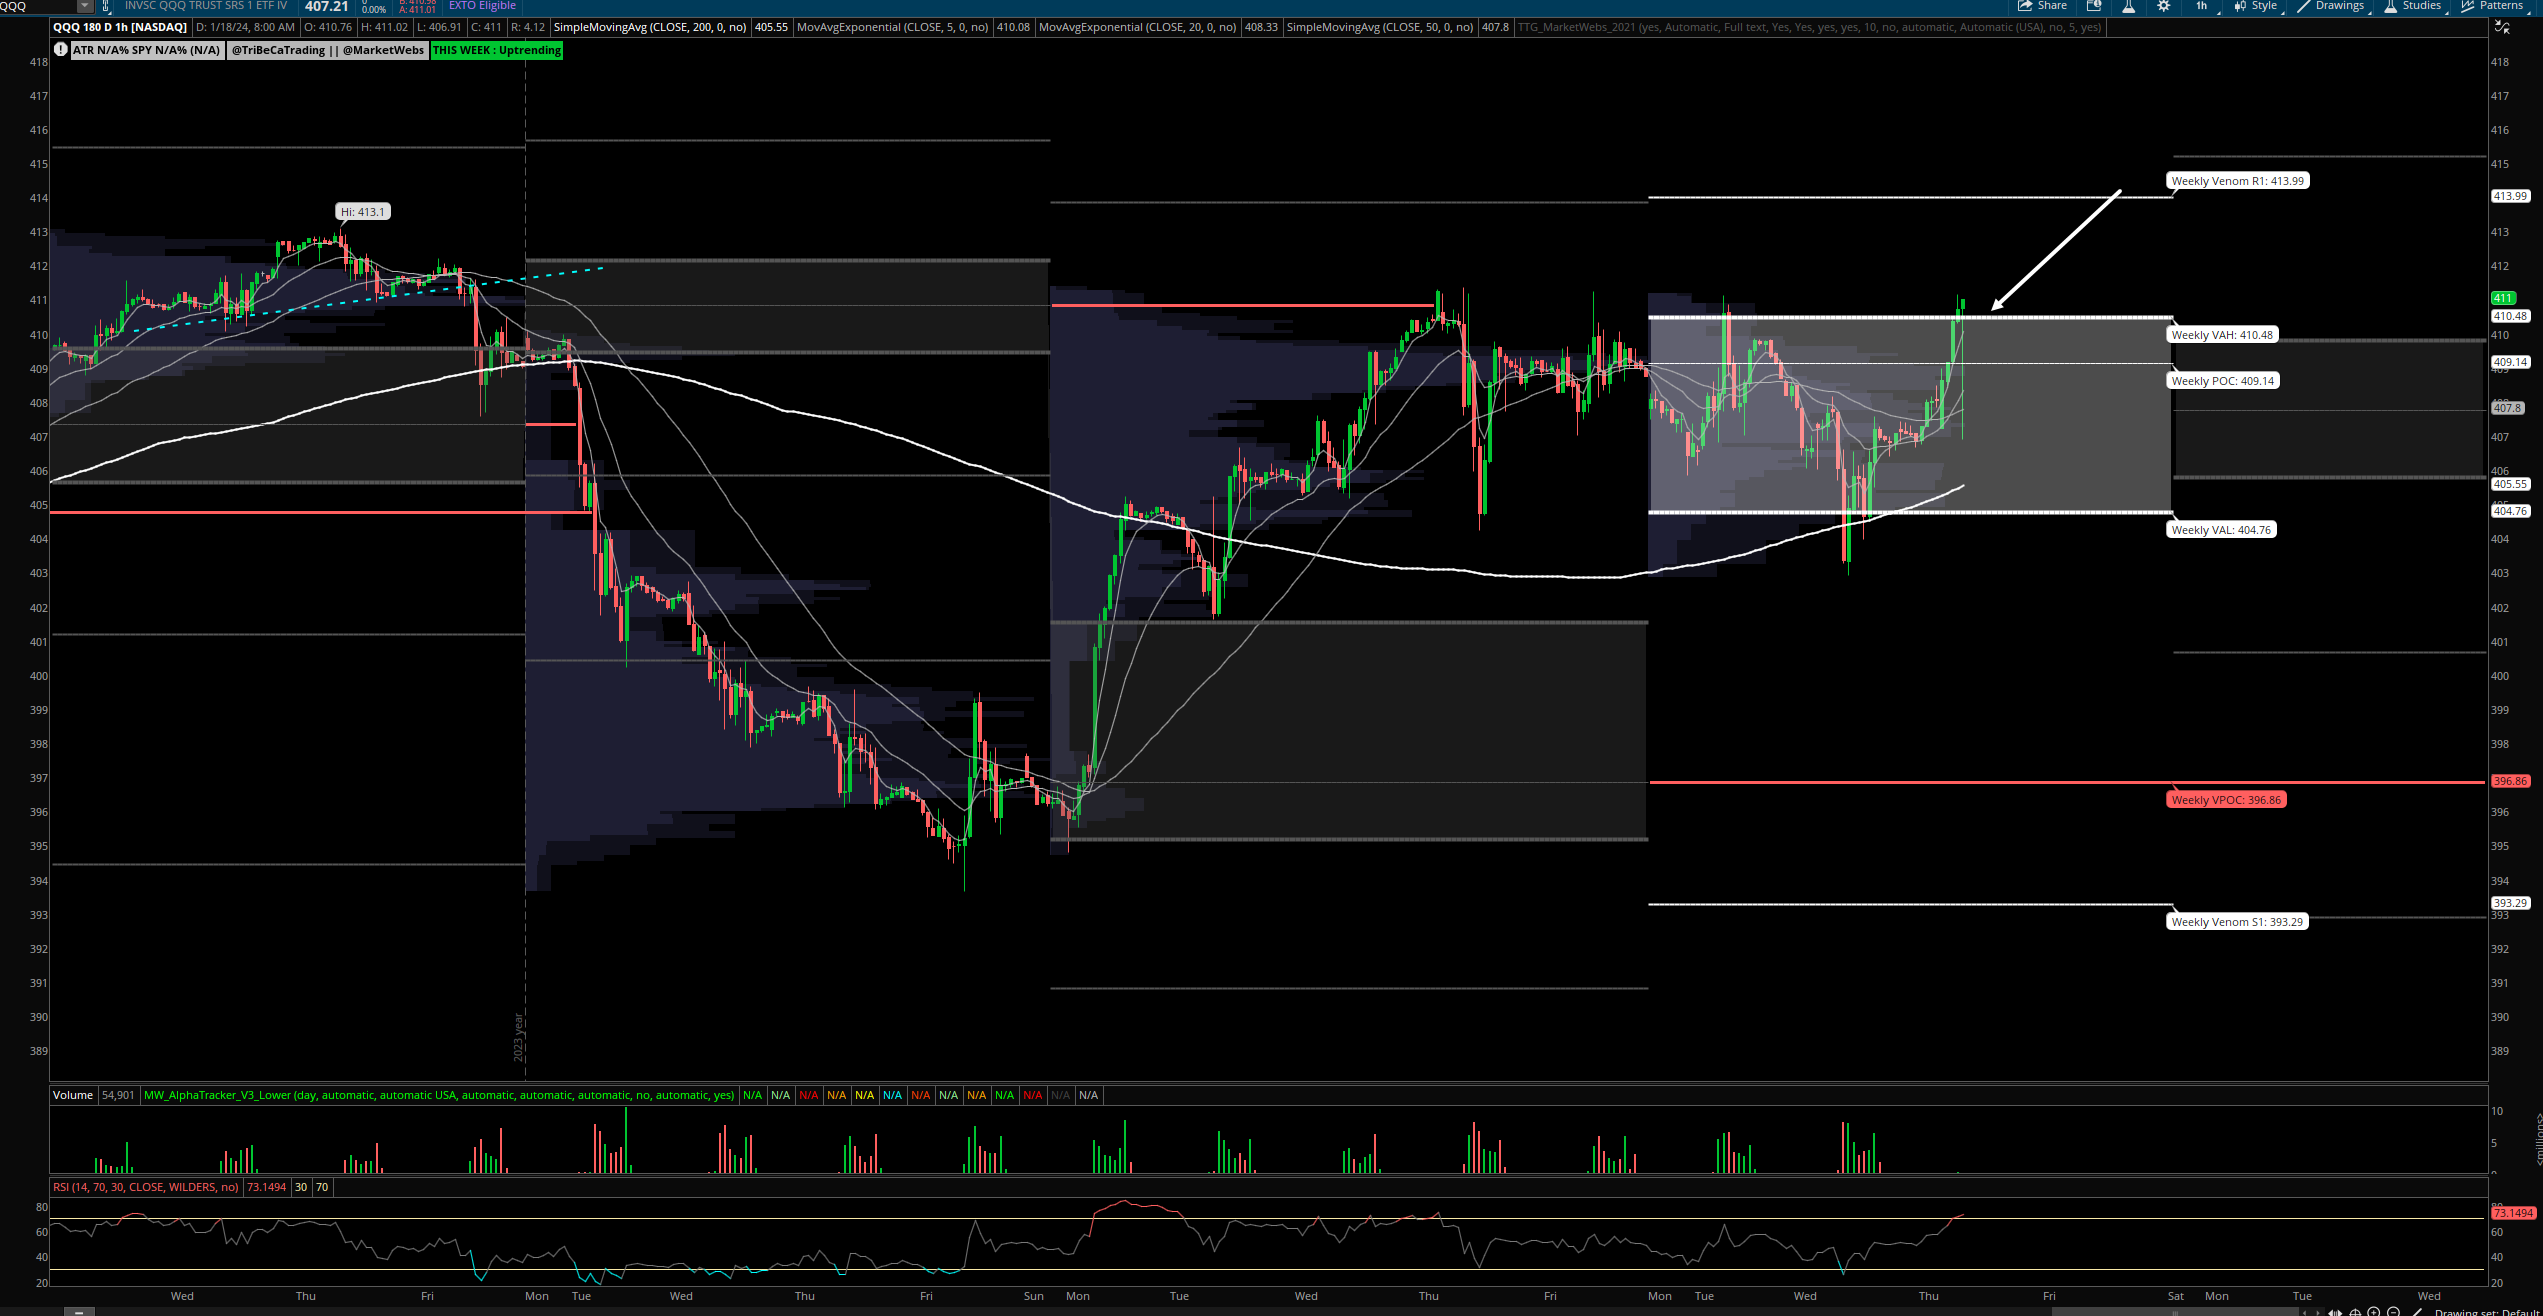
1hr chart: Price back to the top of this week's Value Area , watch $410.48 for a break higher
IWM - Russell Small Cap ETF- Price ind. +0.7% this morning and bouncing off its 50d MA (Moving Average)
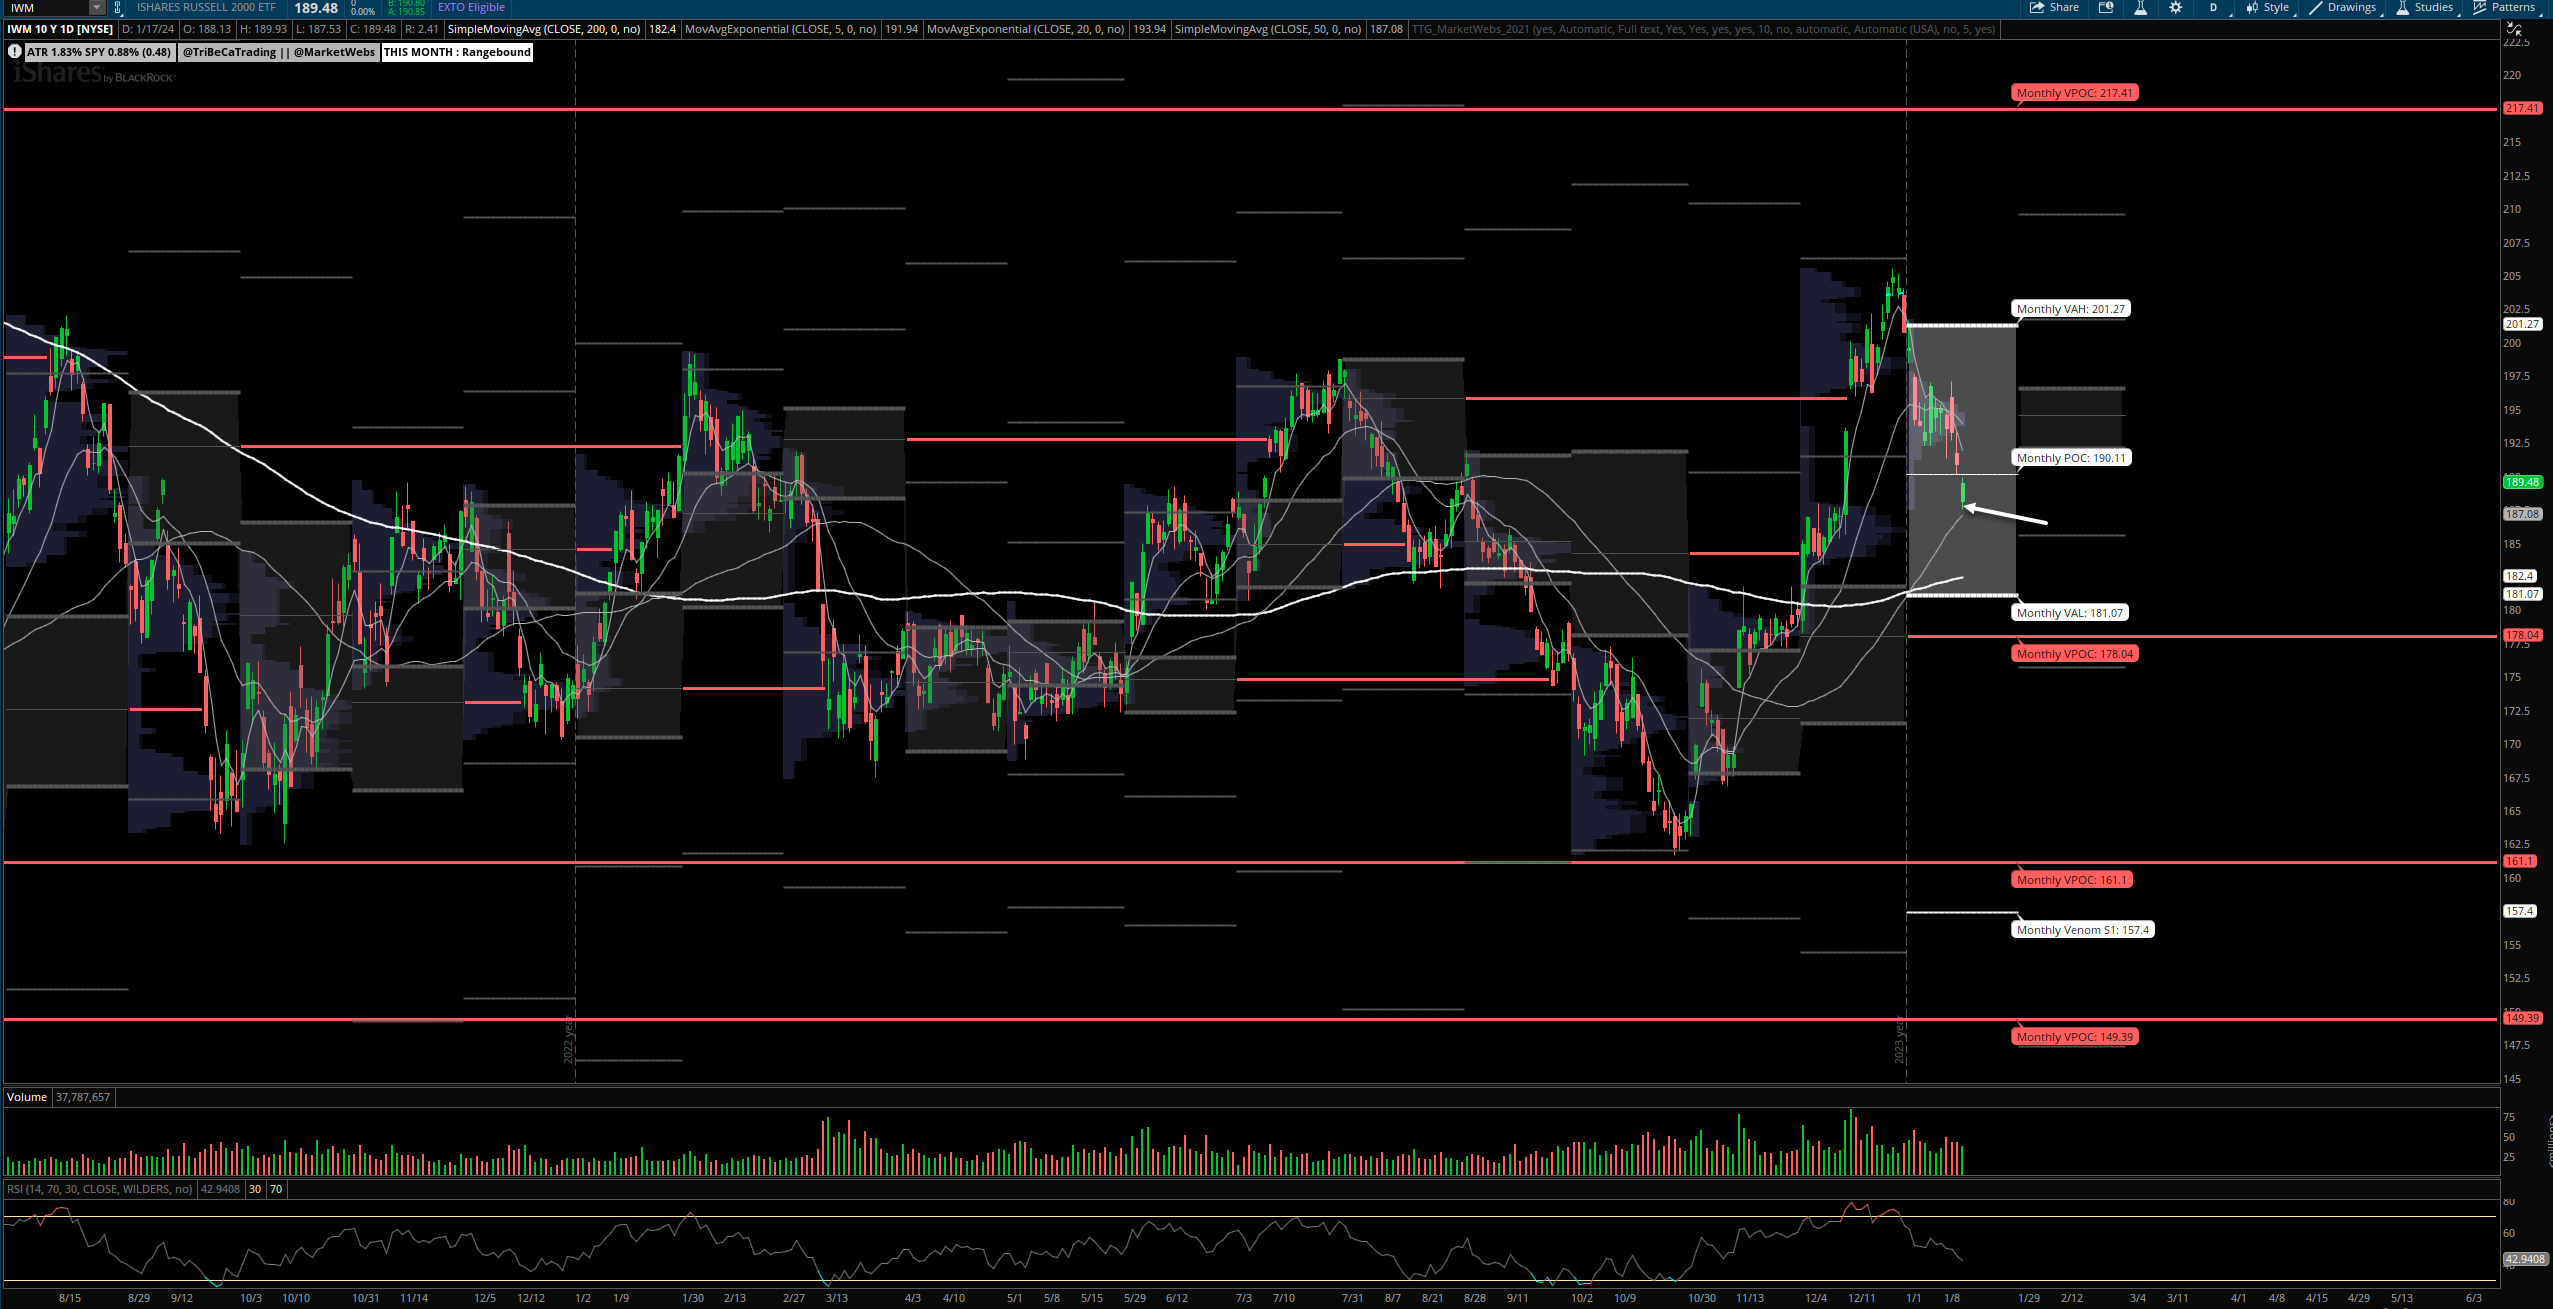
1hr chart: Price still decently below its Value Area for the week, upside 1st level of resistance $193.01

Here is today’s TTG Proprietary Stock Screen “Out of the Box” using Volume At Price
names trending above their Value Areas (on 3 multiple timeframes & not super extended)
Keep reading with a 7-day free trial
Subscribe to The Tribeca Trade Group to keep reading this post and get 7 days of free access to the full post archives.