

TTG Index Charts & Out of the Box Stock Screen 2/5/24 $LPLA
TTG Index Charts & Out of the Box Stock Screen 2/5/24 $LPLA
Out of the Box MarketWebs Screen
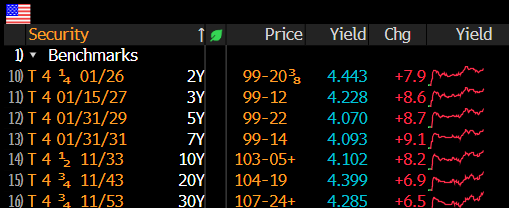
US Dollar +0.4% / 30yr Bonds -0.9% / Crude -0.4% & Nat Gas -0.1% / Gold -0.8% / Copper -0.9% / BTC +0.8%
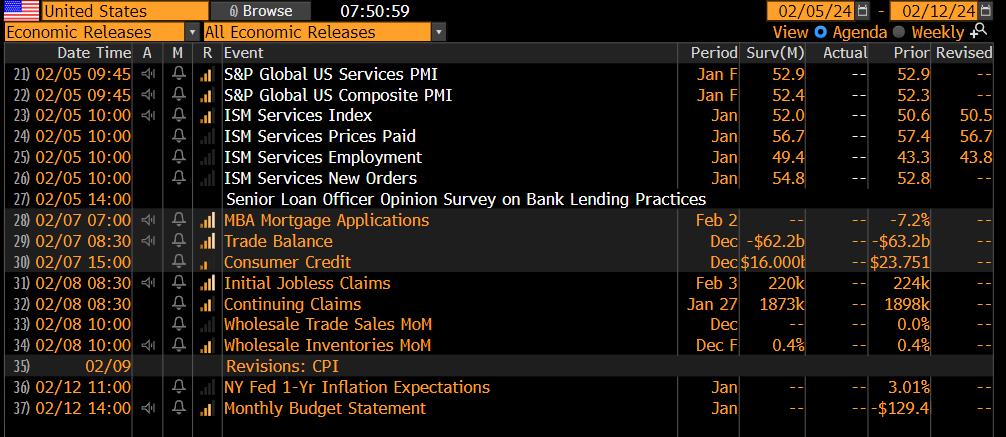
US Upcoming Economics
US Bond Yields
Index Updates
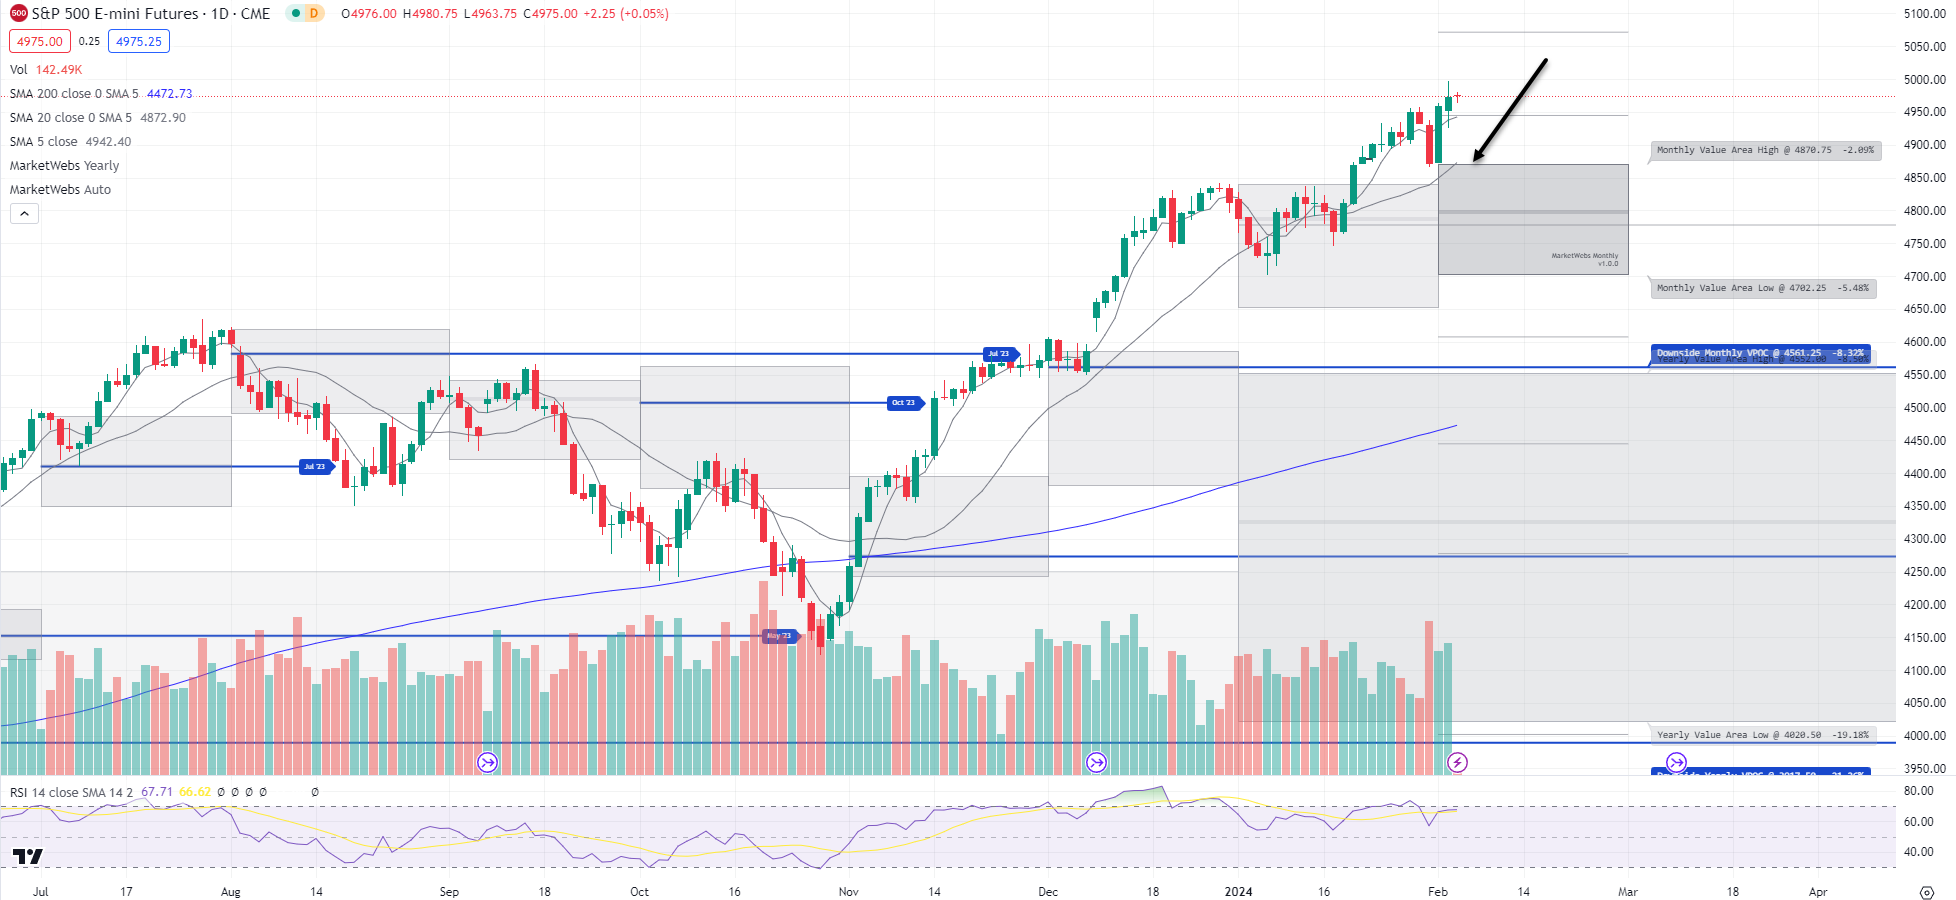
At TTG, I use Volume At Price in my chart analysis and I use the MarketWebs Indicator to provide Value Areas & VPOCs which indicate significant support & resistance levels. Learn More Here about Volume At Price and the MarketWebs.
ES_F - SPX Futures - Price ind. -0.1% this morning after breaking out to new highs on Friday. Note, we have some headwinds to start the day as the US Dollar is +0.4% and Yields are decently higher with the 10yr +7 bps. Another issue that has been getting more attention recently is poor Market Breadth (which has been poor since the end of Dec). Bottom line for me is to watch price which is currently above its 5d MA (Moving Average) and Feb Value Are, but also be practical with risk taking given the headwinds + weaker seasonality in Feb
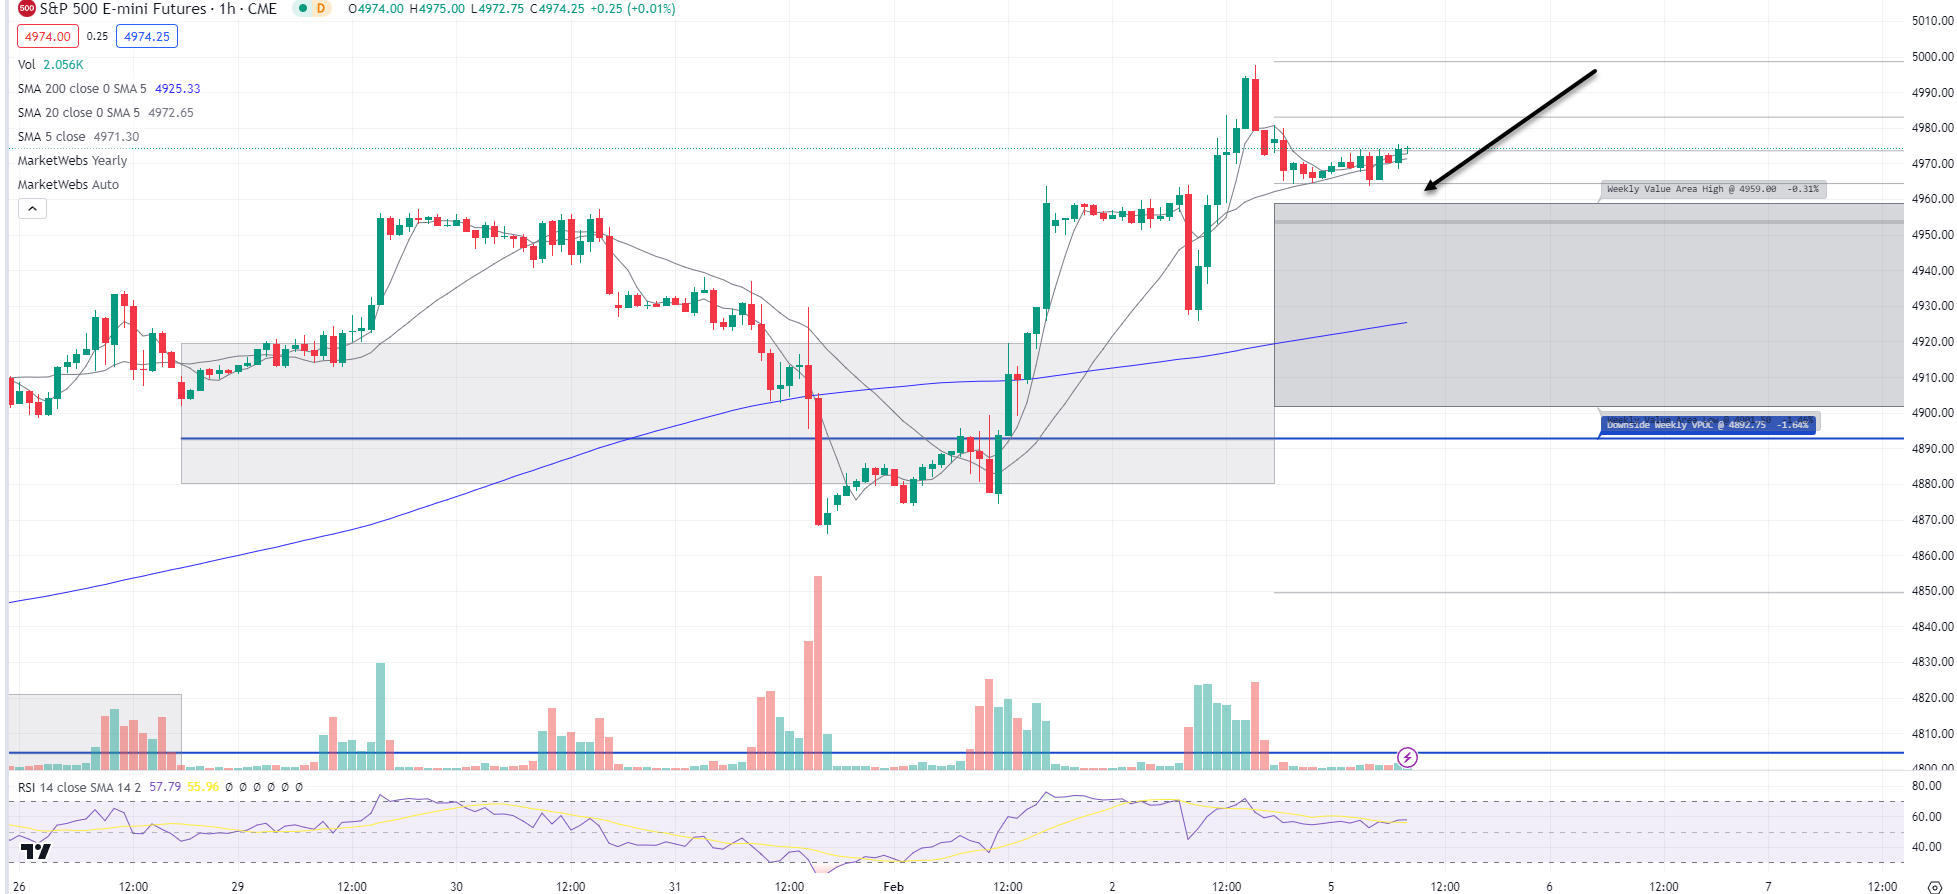
1hr chart: Price starts the week above its new Value Area for the week, support to watch is 4959
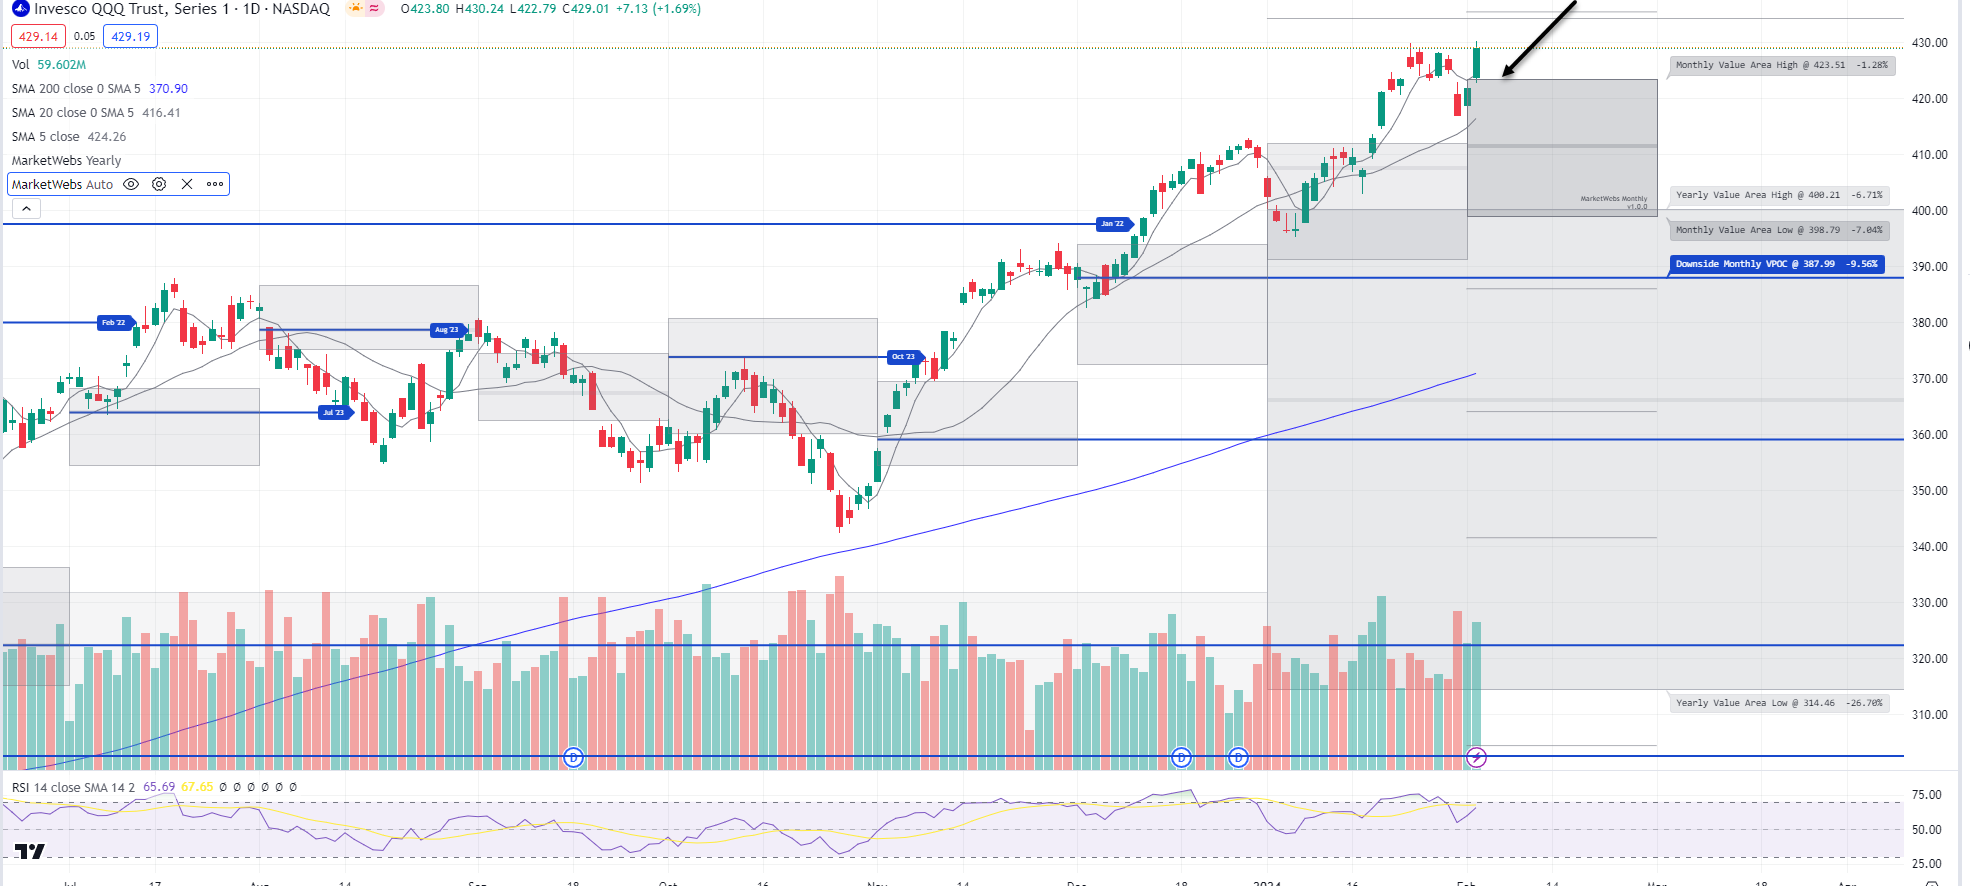
QQQ - NDX 100 ETF - Daily chart: Price ~ flat this morning after price closed at new highs on Friday and is currently above its Feb Value Area, support to watch $423.51
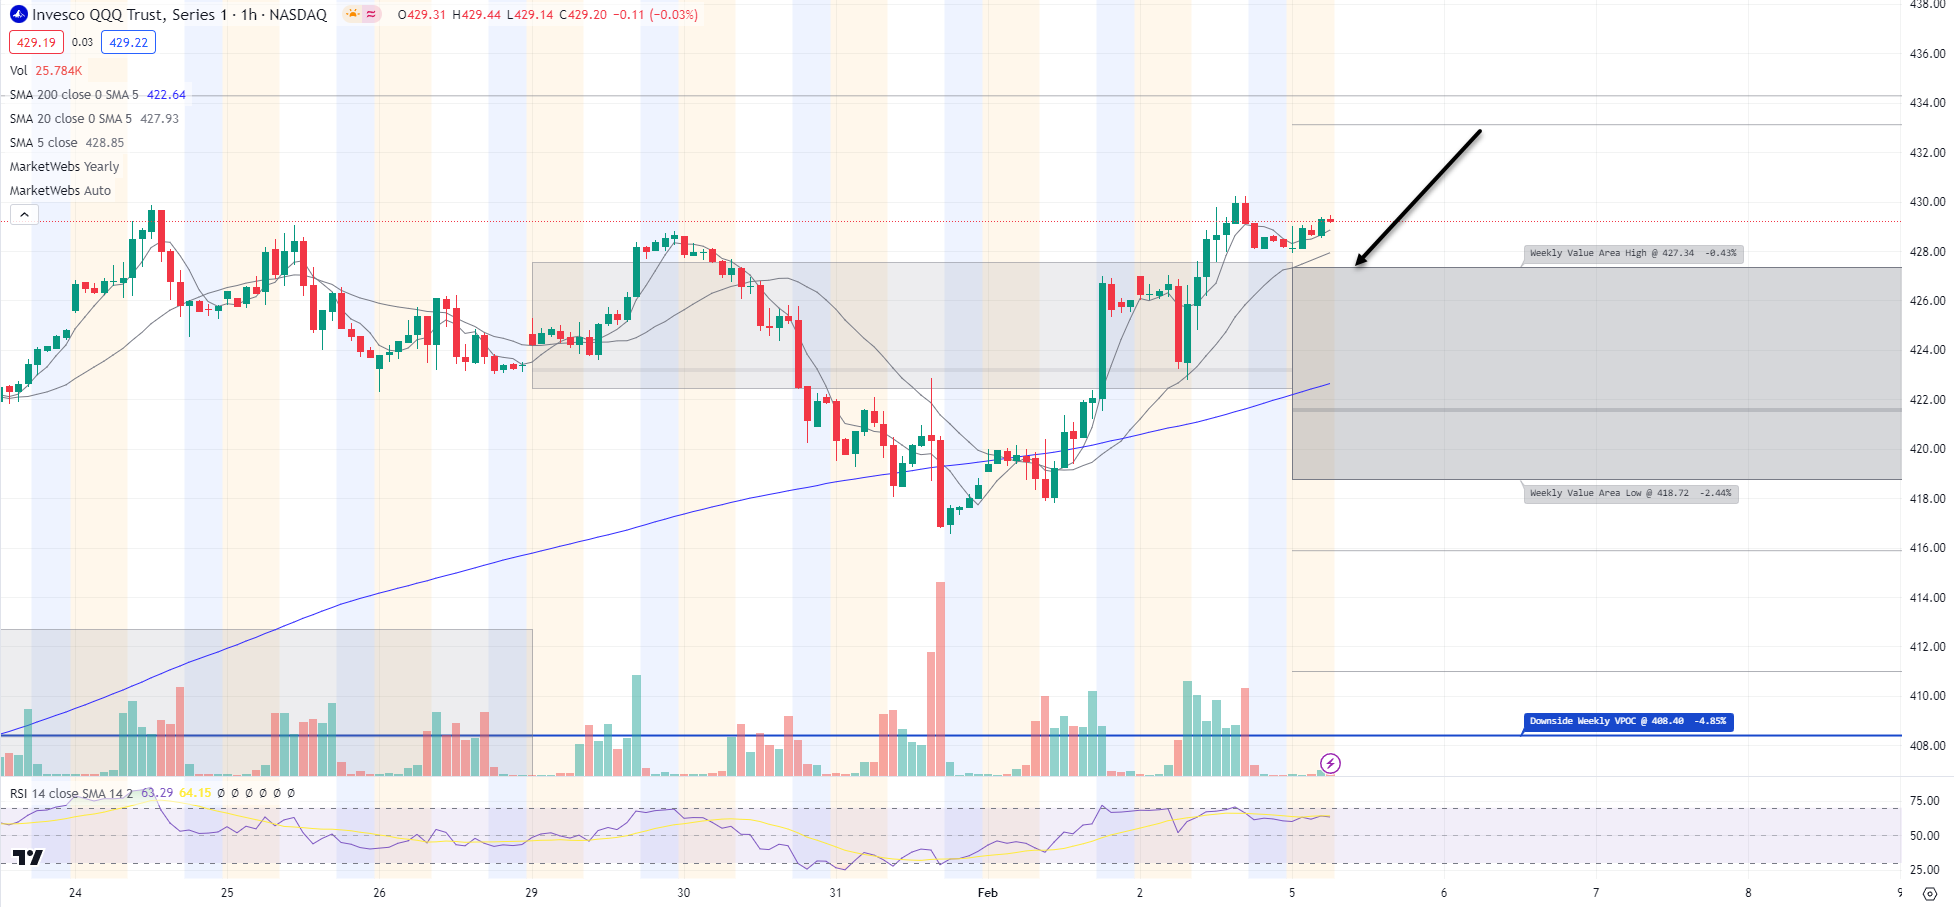
1hr chart: Price starts the week above its new Value Area, 1st level of support to watch is $427.34
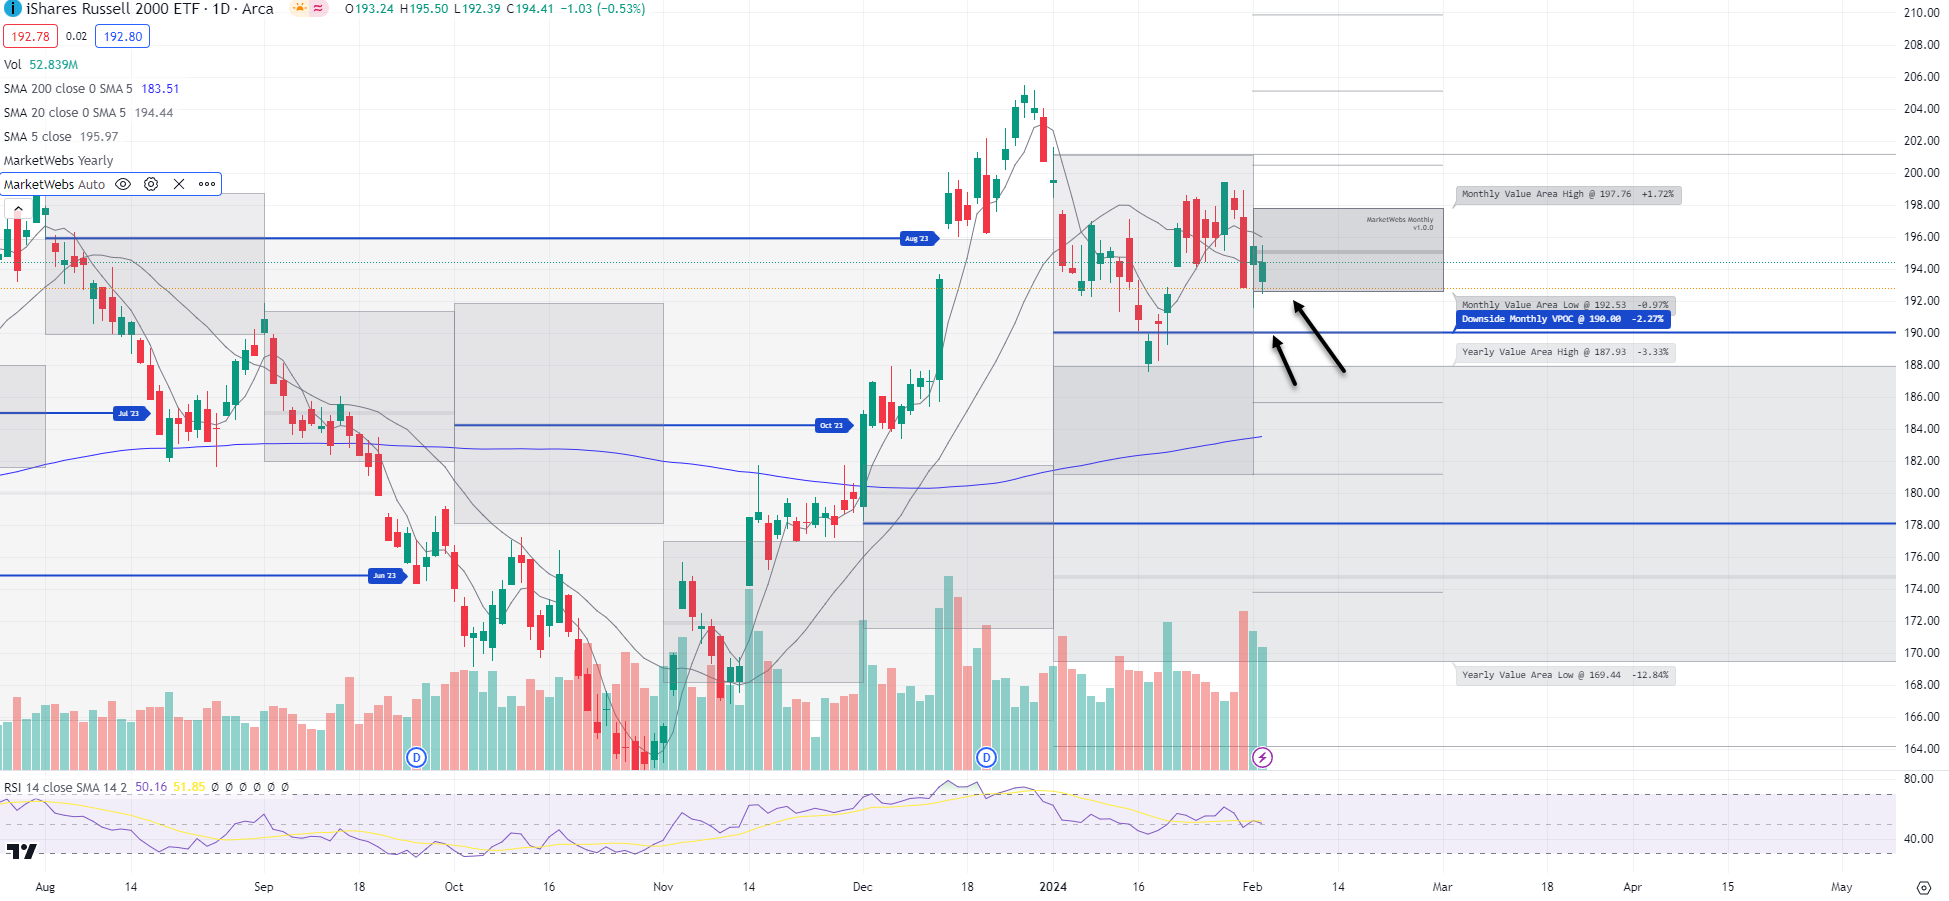
IWM - Russell Small Cap ETF- Price ind. -0.9% and may break below its Feb Area today, watch $192.53 support - IWM, Small Caps continue to be the "problem" Index to watch exhibiting Relative Weakness. If that support is broken, next level down to watch is $190 VPOC (blue line)
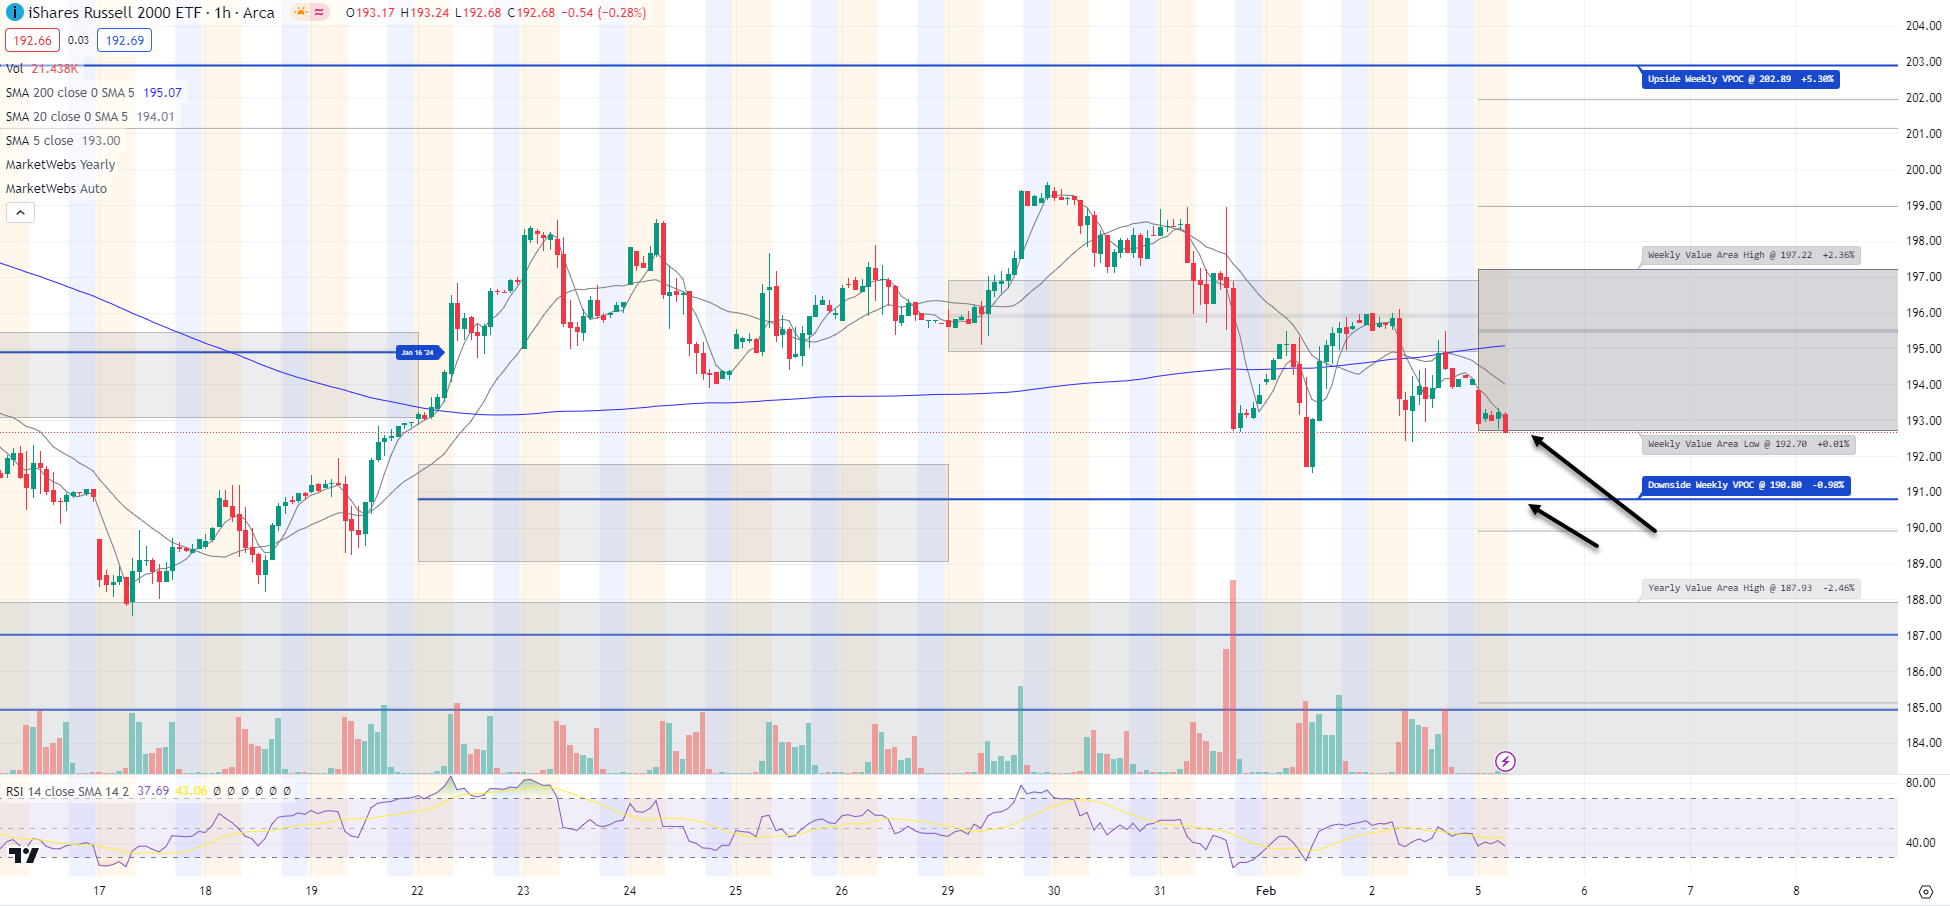
1hr chart: Price teetering on breaking below its Value Area for week, watch $192.7 for a break lower its 1hr Value Area
Here is today’s TTG Proprietary Stock Screen “Out of the Box” using Volume At Price
names trending above their Value Areas (on 3 multiple timeframes & not super extended)
Keep reading with a 7-day free trial
Subscribe to The Tribeca Trade Group to keep reading this post and get 7 days of free access to the full post archives.