

TTG Index Charts & Out of the Box Stock Screen 01/23/24 $DKS $BLDR
TTG Index Charts & Out of the Box Stock Screen 01/23/24 $DKS $BLDR
Out of the Box MarketWebs Screen
US Dollar +0.1% / 30yr Bonds -0.5% / Crude -0.9% & Nat Gas -1.8% / Gold +0.3% / Copper +0.8% / BTC -3.0%
US Upcoming Economics

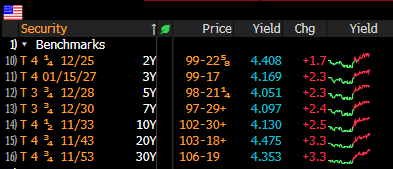
US Bond Yields
Index Updates
At TTG, I use Volume At Price in my chart analysis and I use the MarketWebs Indicator to provide Value Areas & VPOCs which indicate significant support & resistance levels. Learn More Here about Volume At Price and the MarketWebs.
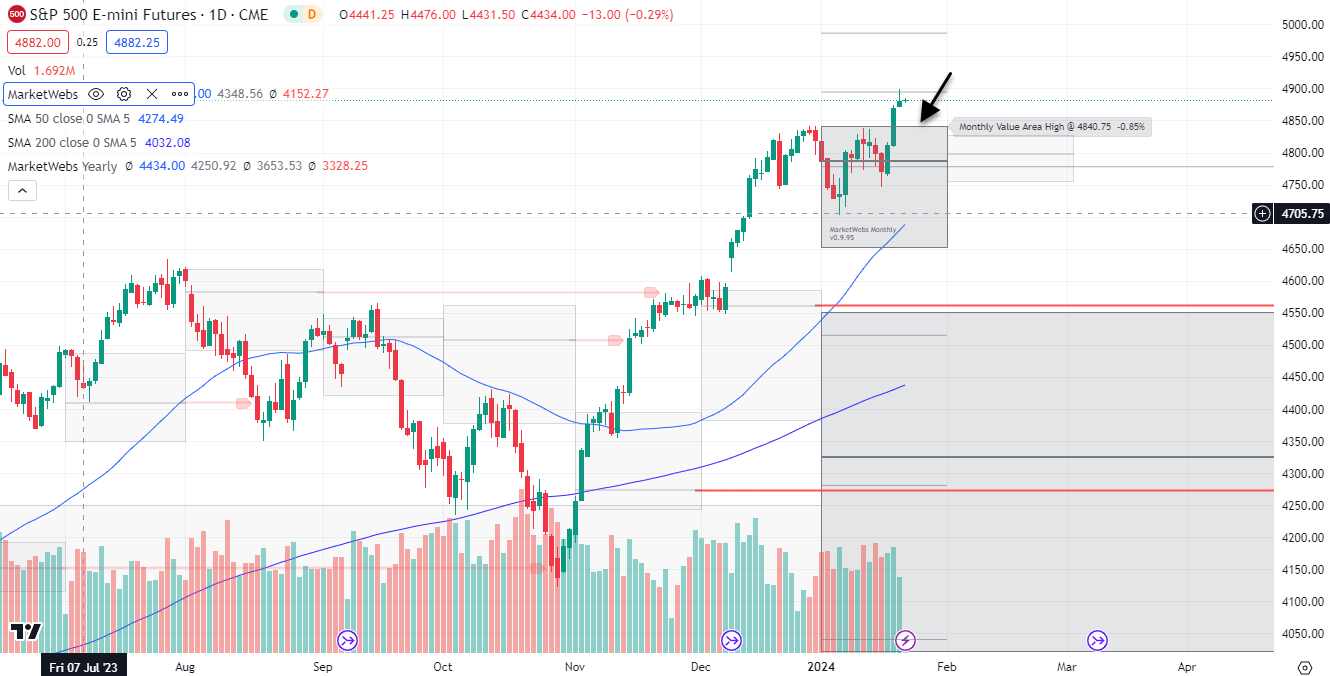
$ES_F- S&P Futures - Price grinding higher this morning, ind. +0.1% above Value on multiple timeframes, top of Jan Value Area support is 4841
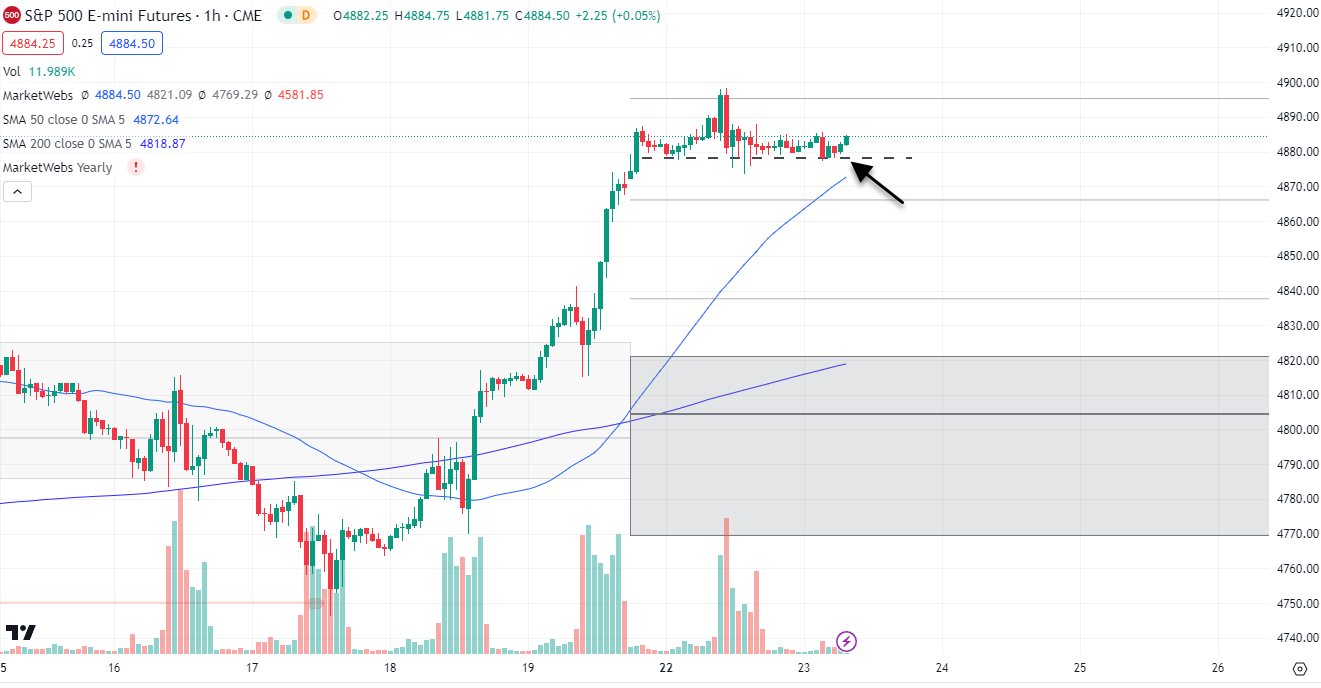
1hr chart: After getting a bit overbought in short-term there is some consolidation and I am watching to see which way the consolidation results - for now, I have drawn a trendline and price may be forming a head & shoulders top - but also may not - it is not a head and shoulders until price breaks a neckline and could also just be seeing normal consolidation before next move higher
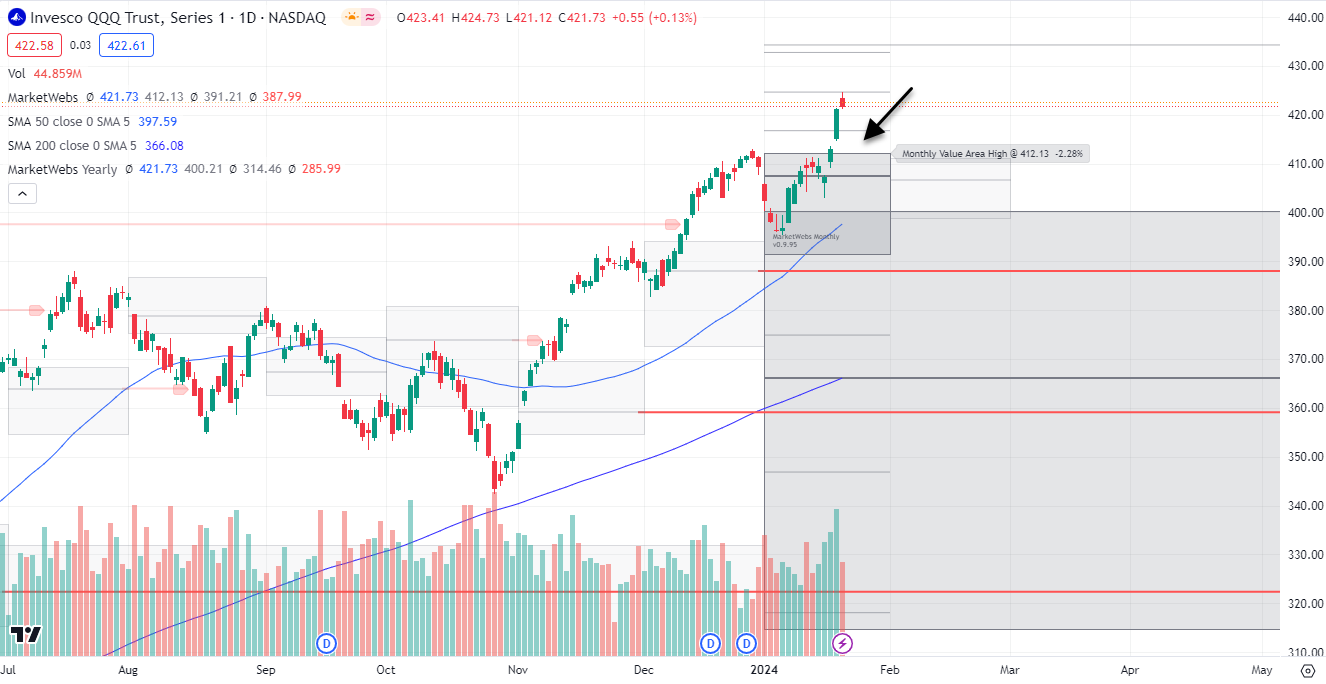
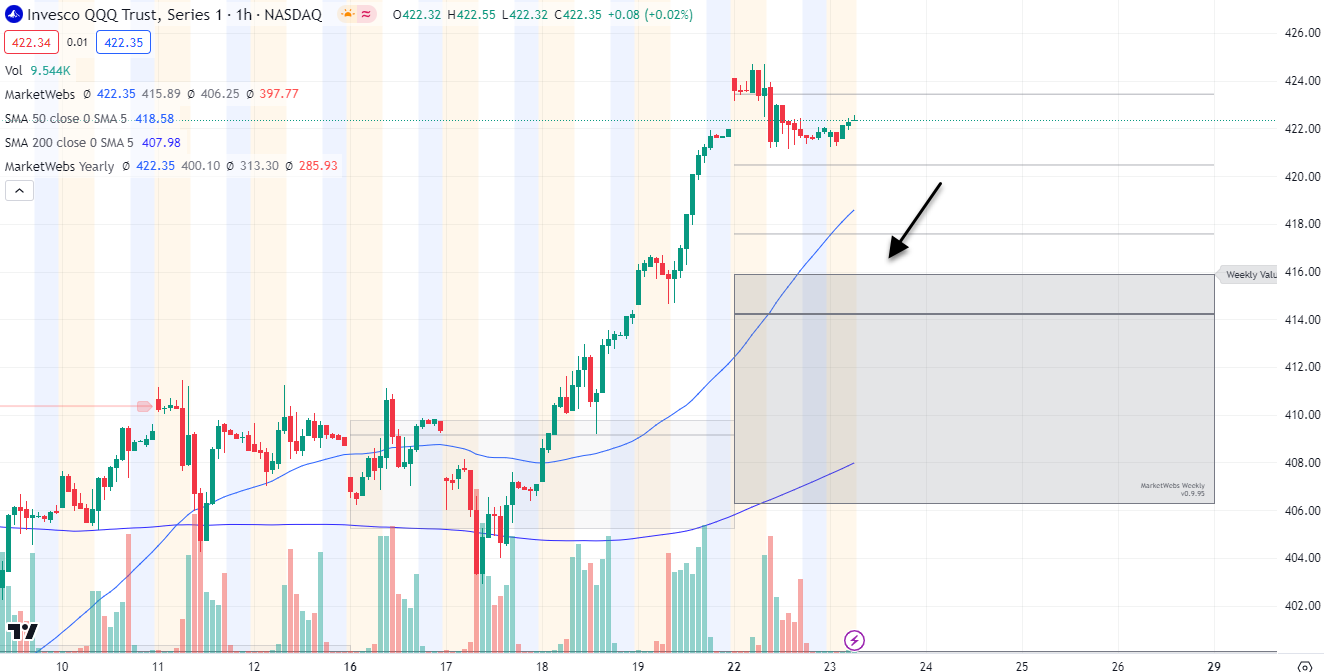
QQQ - NDX 100 ETF - Daily chart: Price ind. +0.1% this morning and a little extended in short term and it feels like there was some rotation yesterday out of bigger Tech and into some of the Small Caps, higher momentum names.
1hr chart: Price decently above its Value Area for week
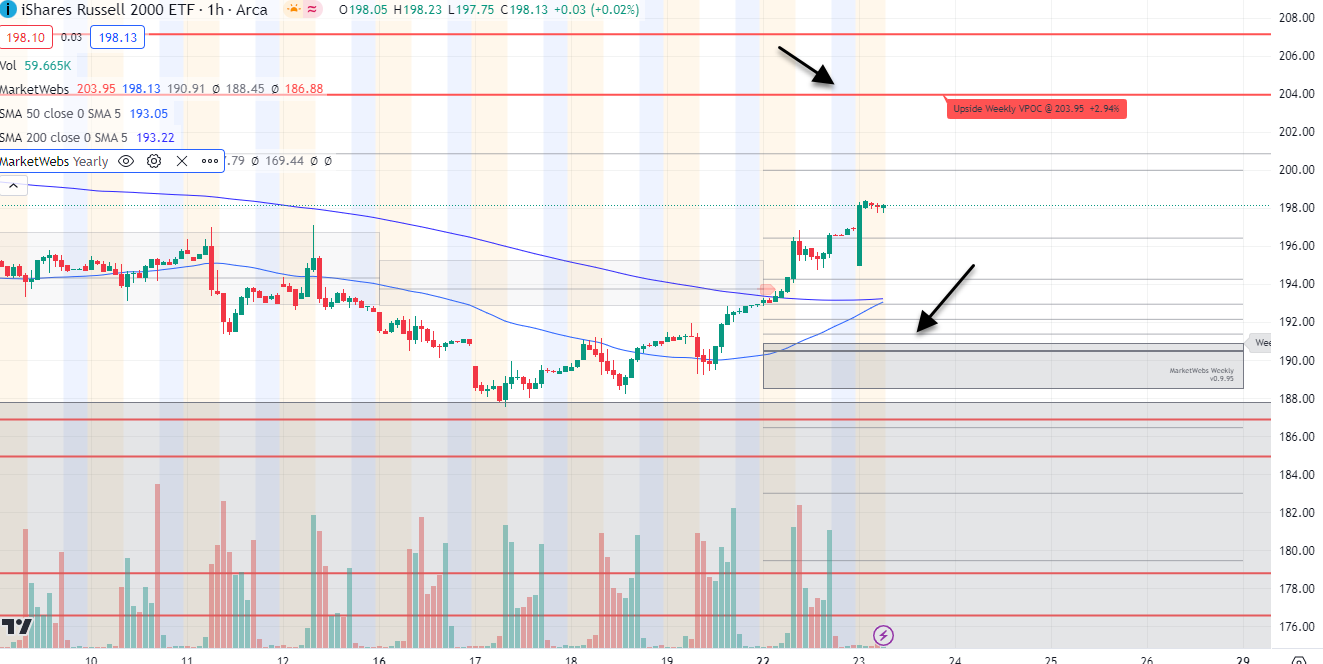
IWM - Russell Small Cap ETF- Price following through from yesterday's outperformance, ind. +0.7%. So far, real nice bounce off of 50d MA and top of its yearly Value Area. Resistance to watch is $201.08

1hr chart: Price moving decently above its Value Area for week , levels to watch below
Here is today’s TTG Proprietary Stock Screen “Out of the Box” using Volume At Price
names trending above their Value Areas (on 3 multiple timeframes & not super extended)
Keep reading with a 7-day free trial
Subscribe to The Tribeca Trade Group to keep reading this post and get 7 days of free access to the full post archives.