

TTG Index Charts & Out of the Box Stock Screen 3/21/24 $CMC
TTG Index Charts & Out of the Box Stock Screen 3/21/24 $CMC
Out of the Box MarketWebs Screen
US Dollar +0.2% / 30yr Bonds +0.5% / Crude -0.4% & Nat Gas -1.1% / Gold +2.3% / Copper +0.6% / BTC +2.3%
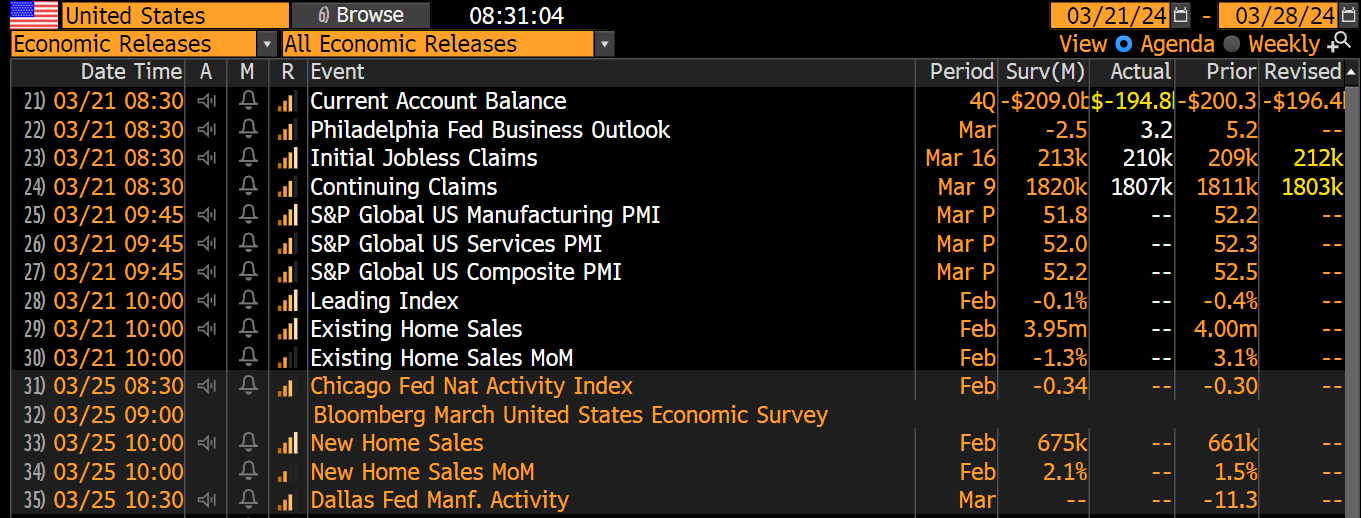
US Upcoming Economics
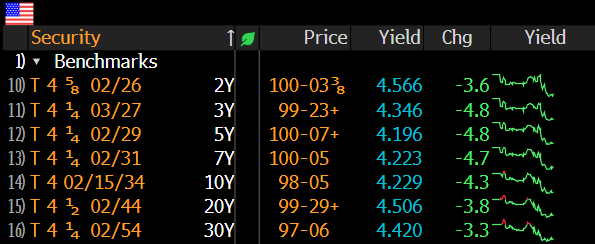
US Bond Yields
Index Updates
At TTG, I use Volume At Price in my chart analysis and I use the MarketWebs Indicator to provide Value Areas & VPOCs which indicate significant support & resistance levels. Learn More Here about Volume At Price and the MarketWebs.
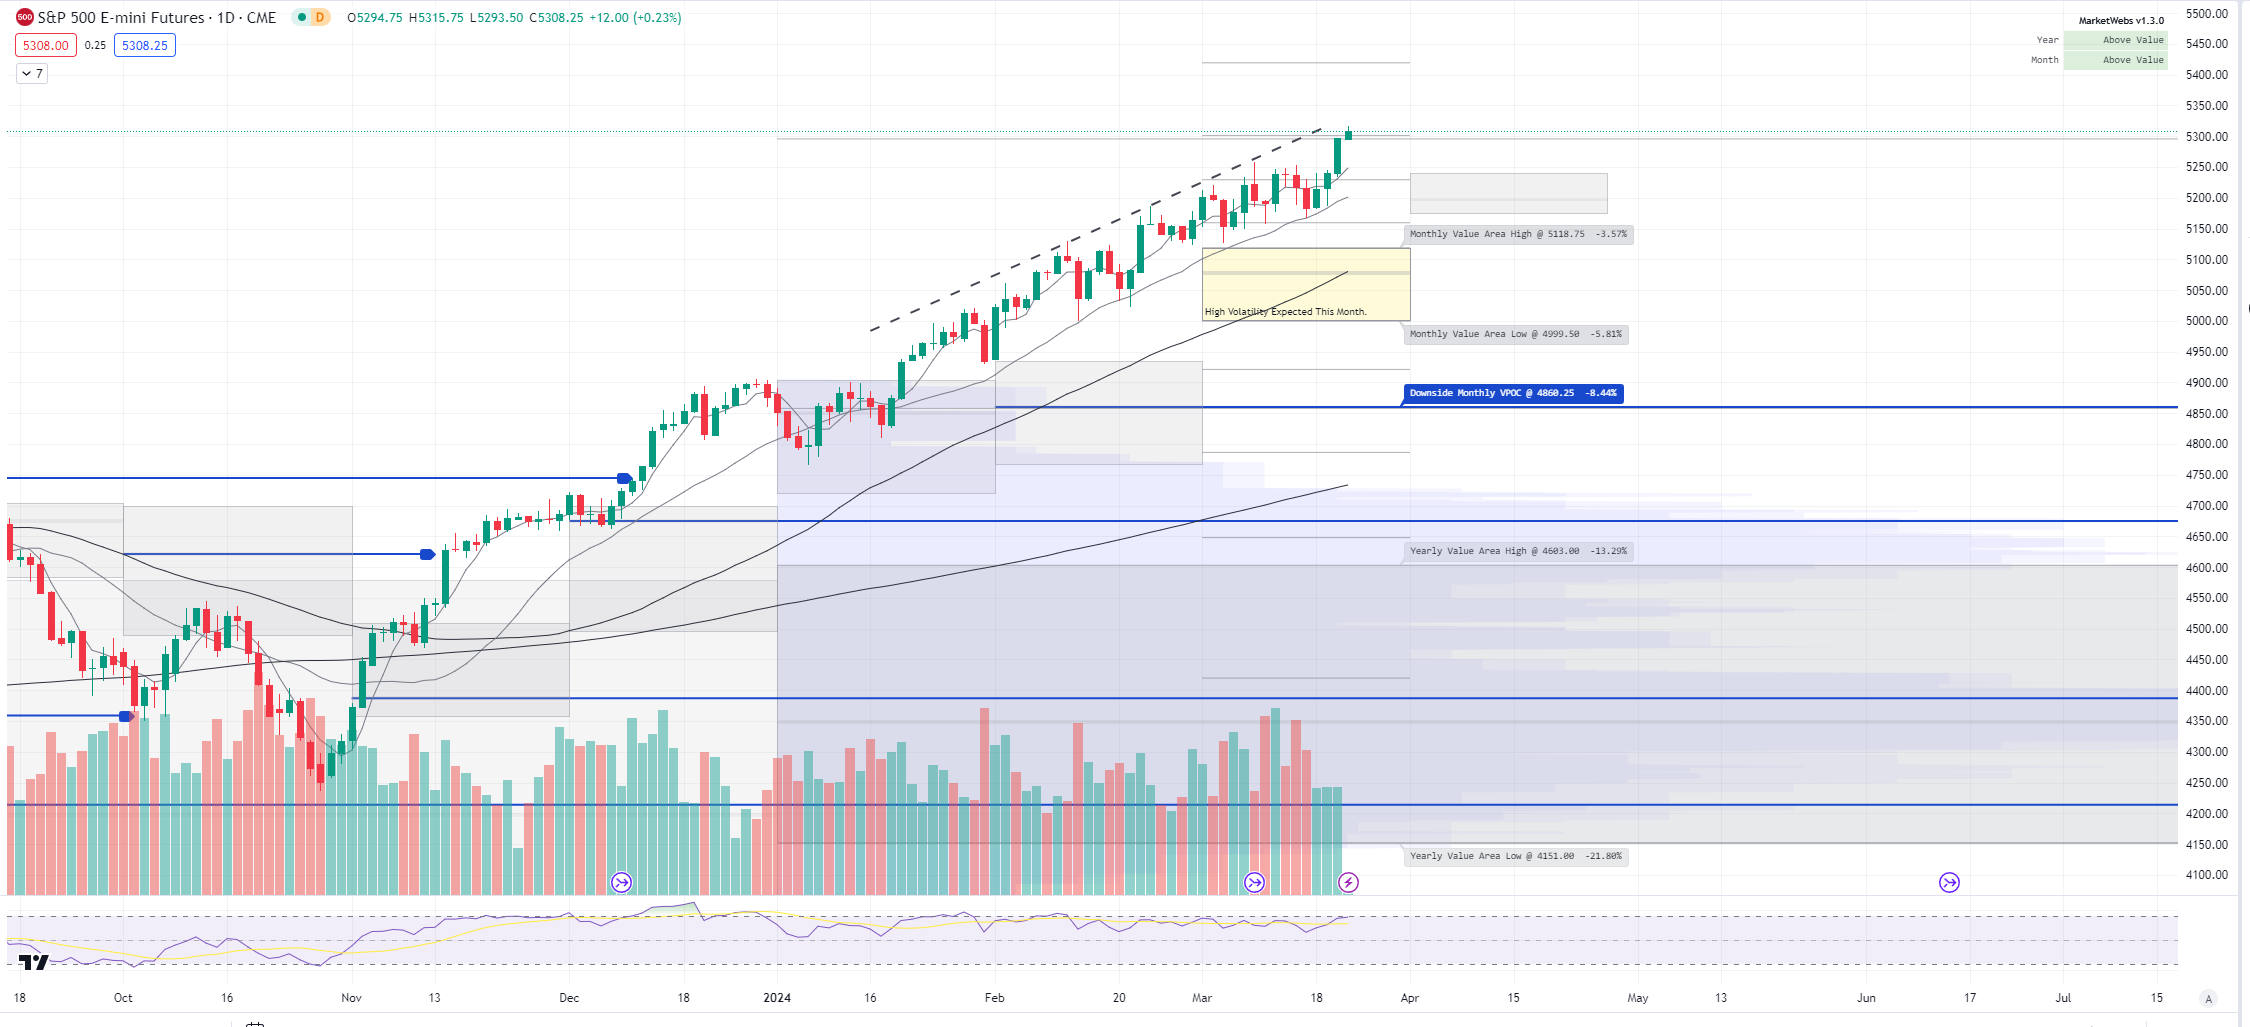
ES_F - SPX Futures - Prices close to premkt highs, ind +0.5% this morning and nice follow through from yesterday's rally. The Fed took a dovish tone and Fed Fund Futures are now pricing in 3 interest rate cuts in '24 - this was surprising to me to hear Powell take a dovish tone despite recent higher inflation reports, but it is what it is and our job is not to argue with market signals, but take them as they come.
Price is now on the upper side of the uptrend channel
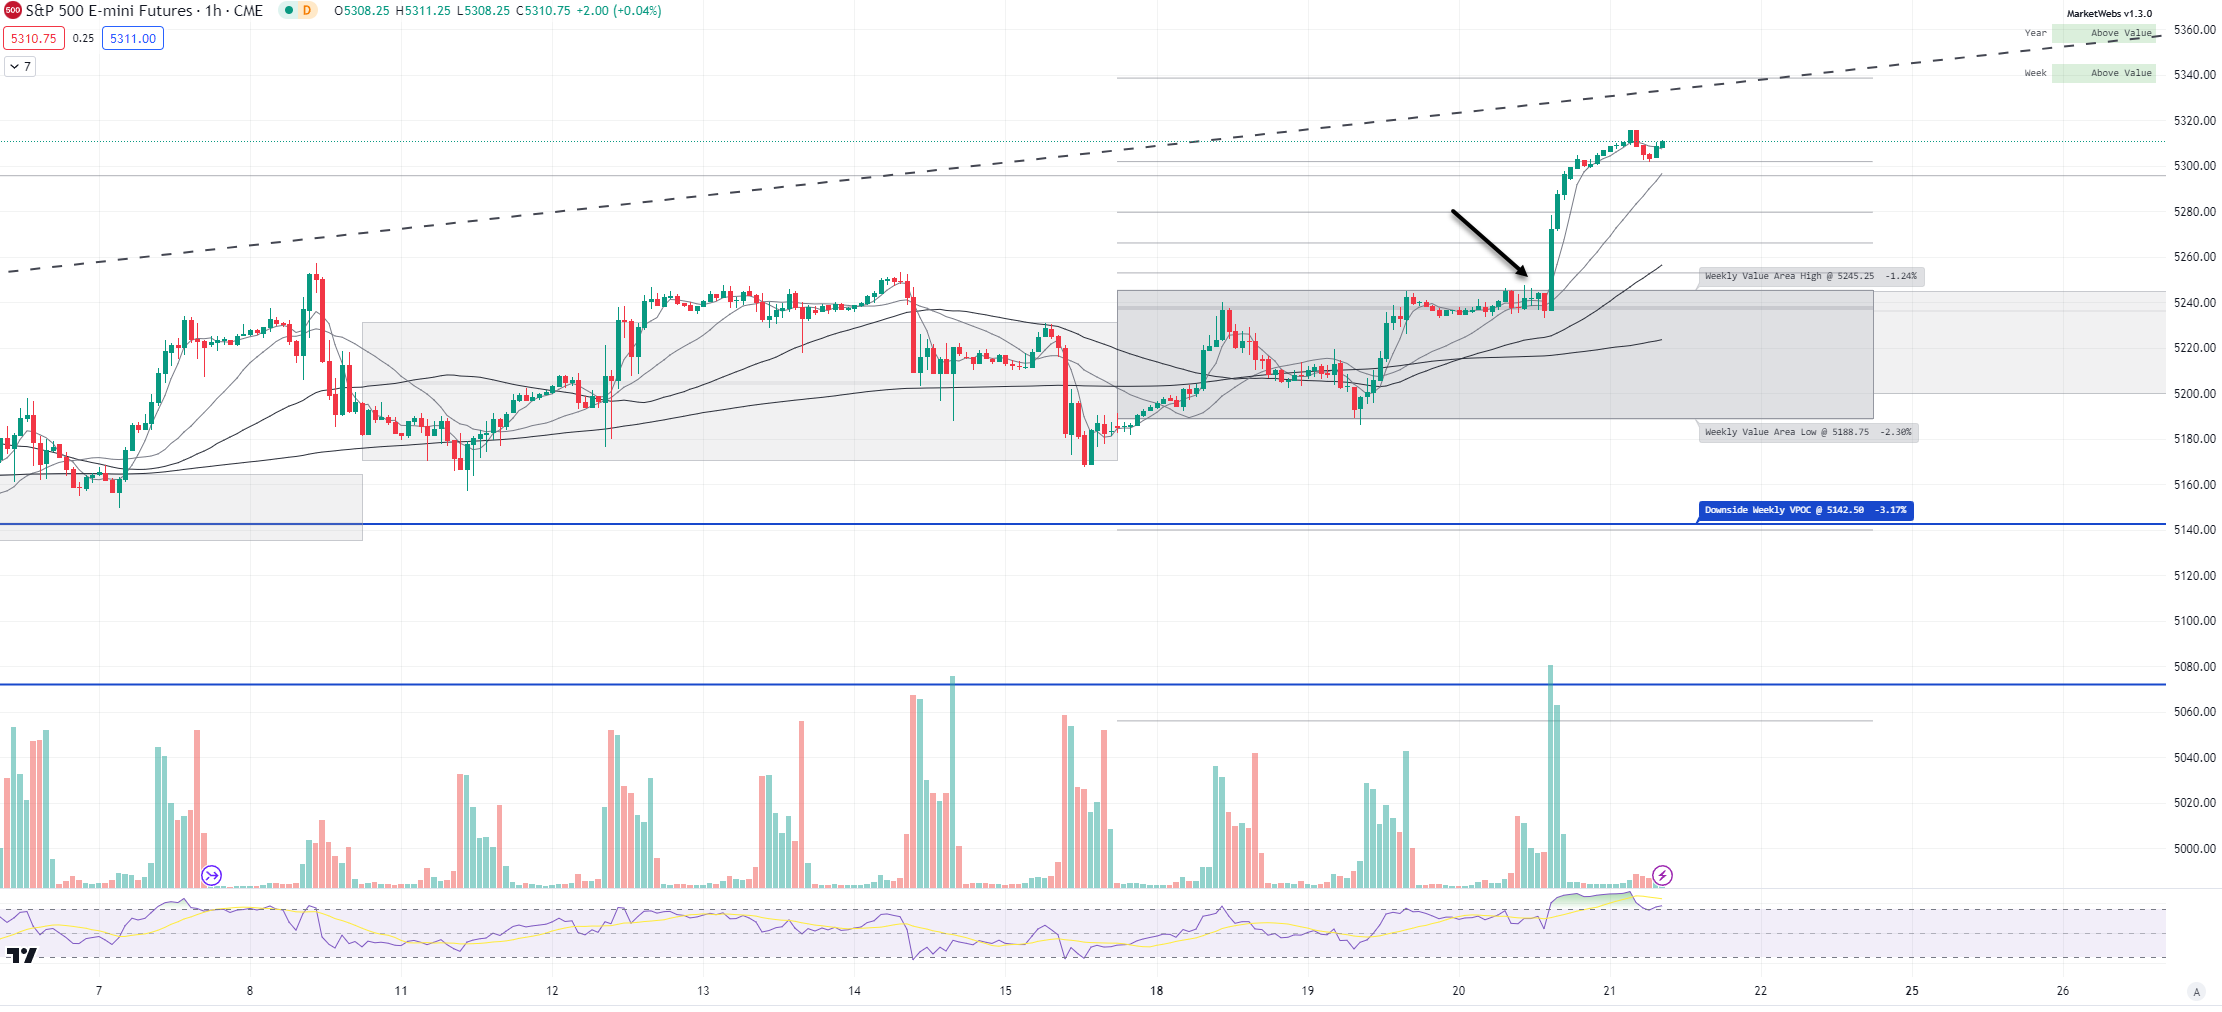
1hr chart: Price decisively broke through its Value Area yesterday, support down at 5425.25
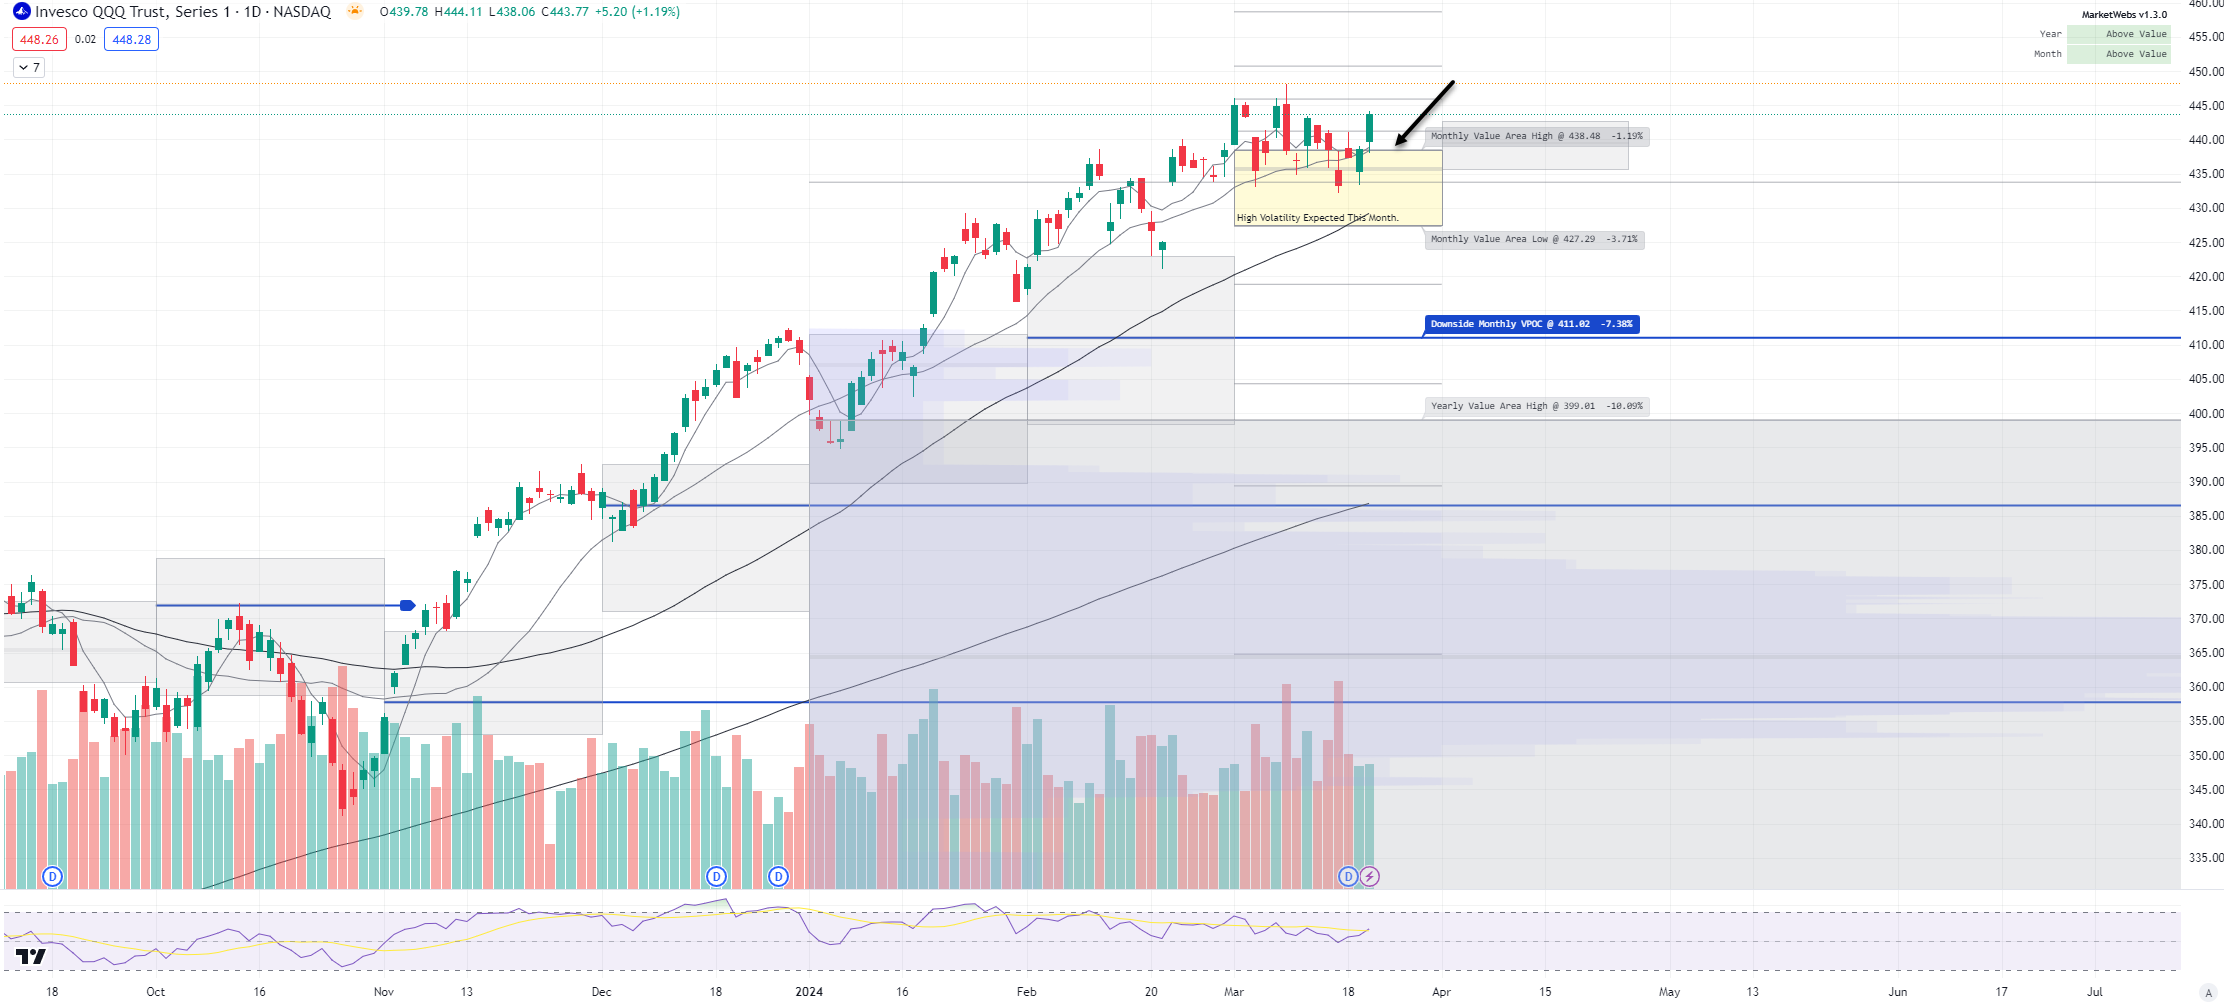
QQQ - NDX 100 ETF - Daily chart: Price ind. +1.0% and will be looking at possible new highs this morning, a nice catch up from recent underperformance in QQQ. MU leading gains +17% after a strong earnings report.
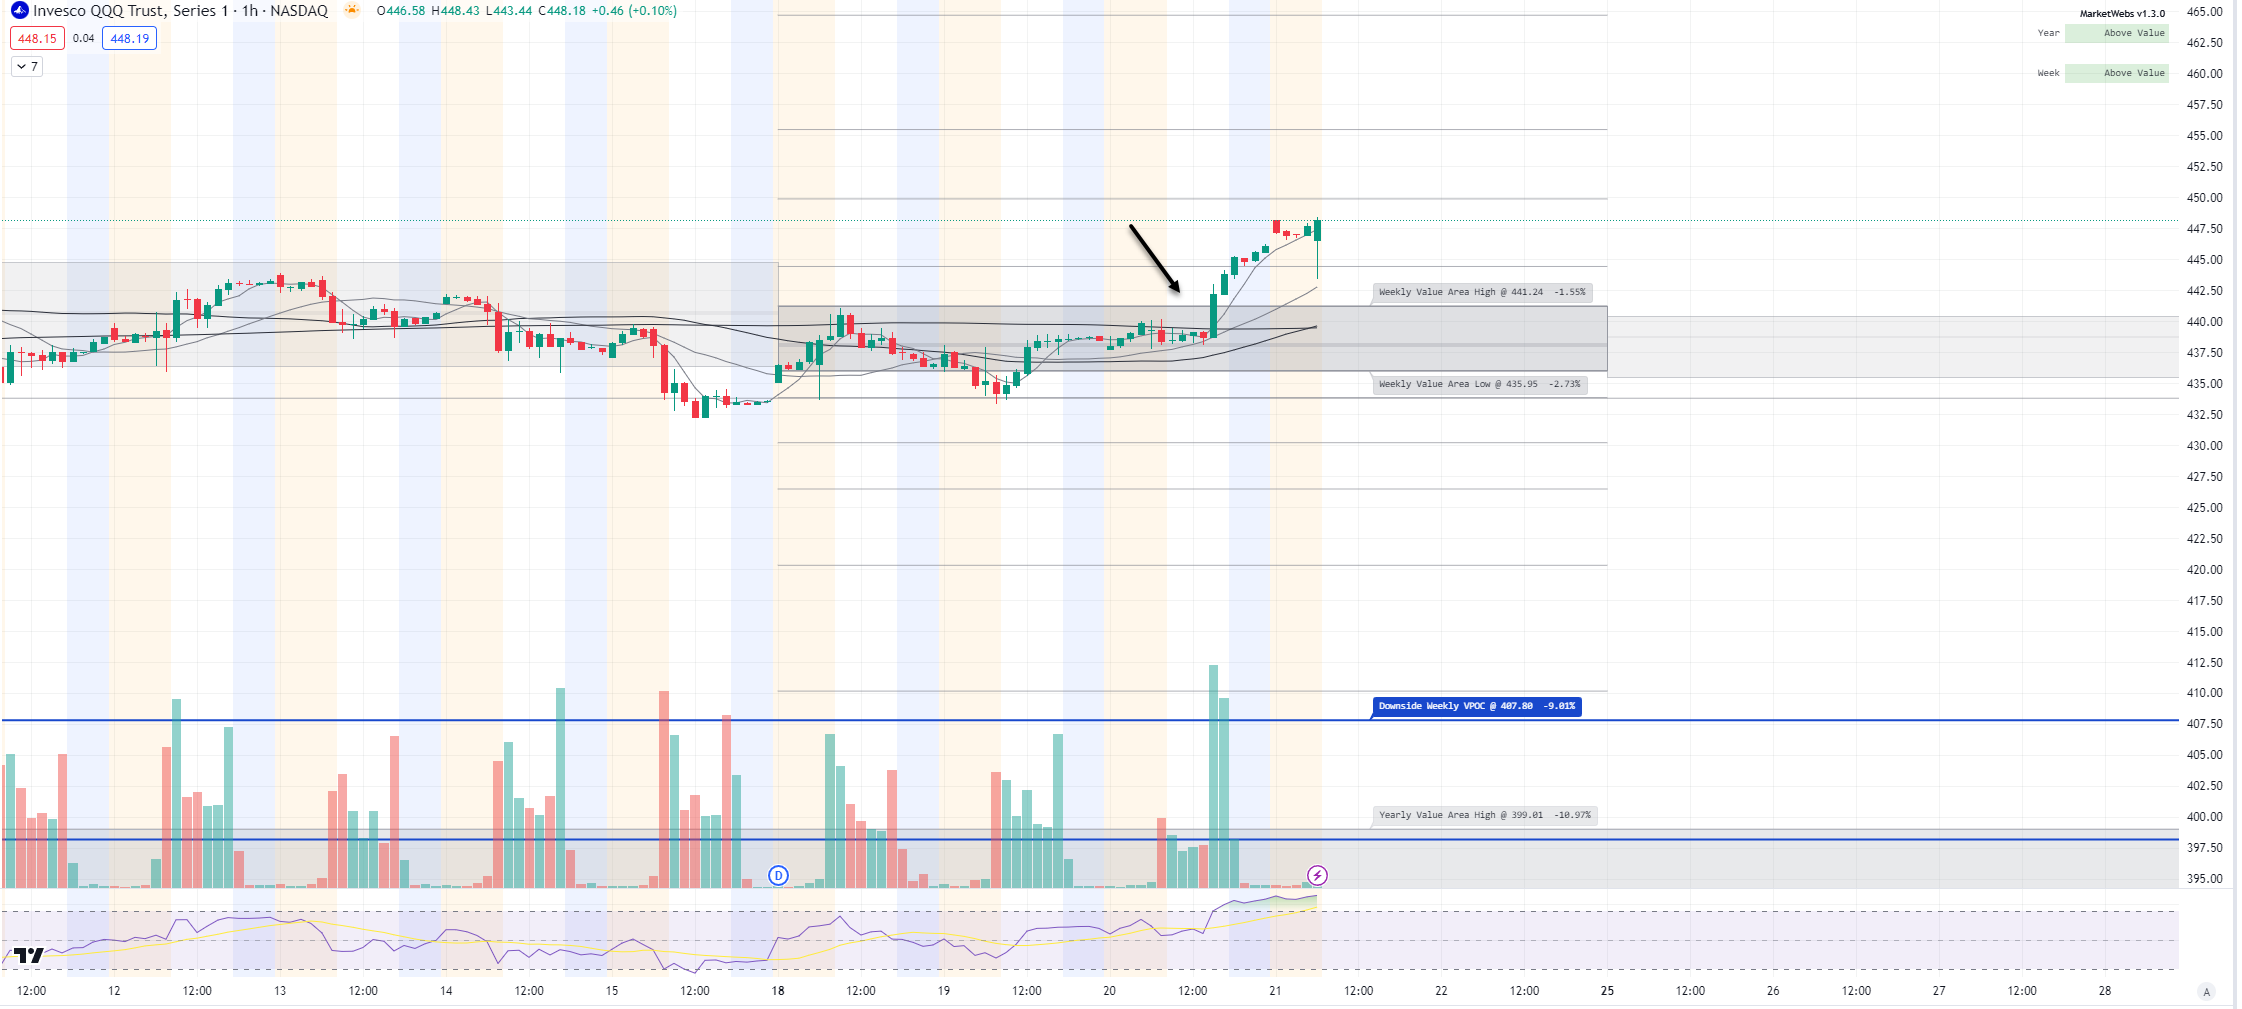
1hr chart: Similar to the S&P, price broke through its Value Area for the week above resistance
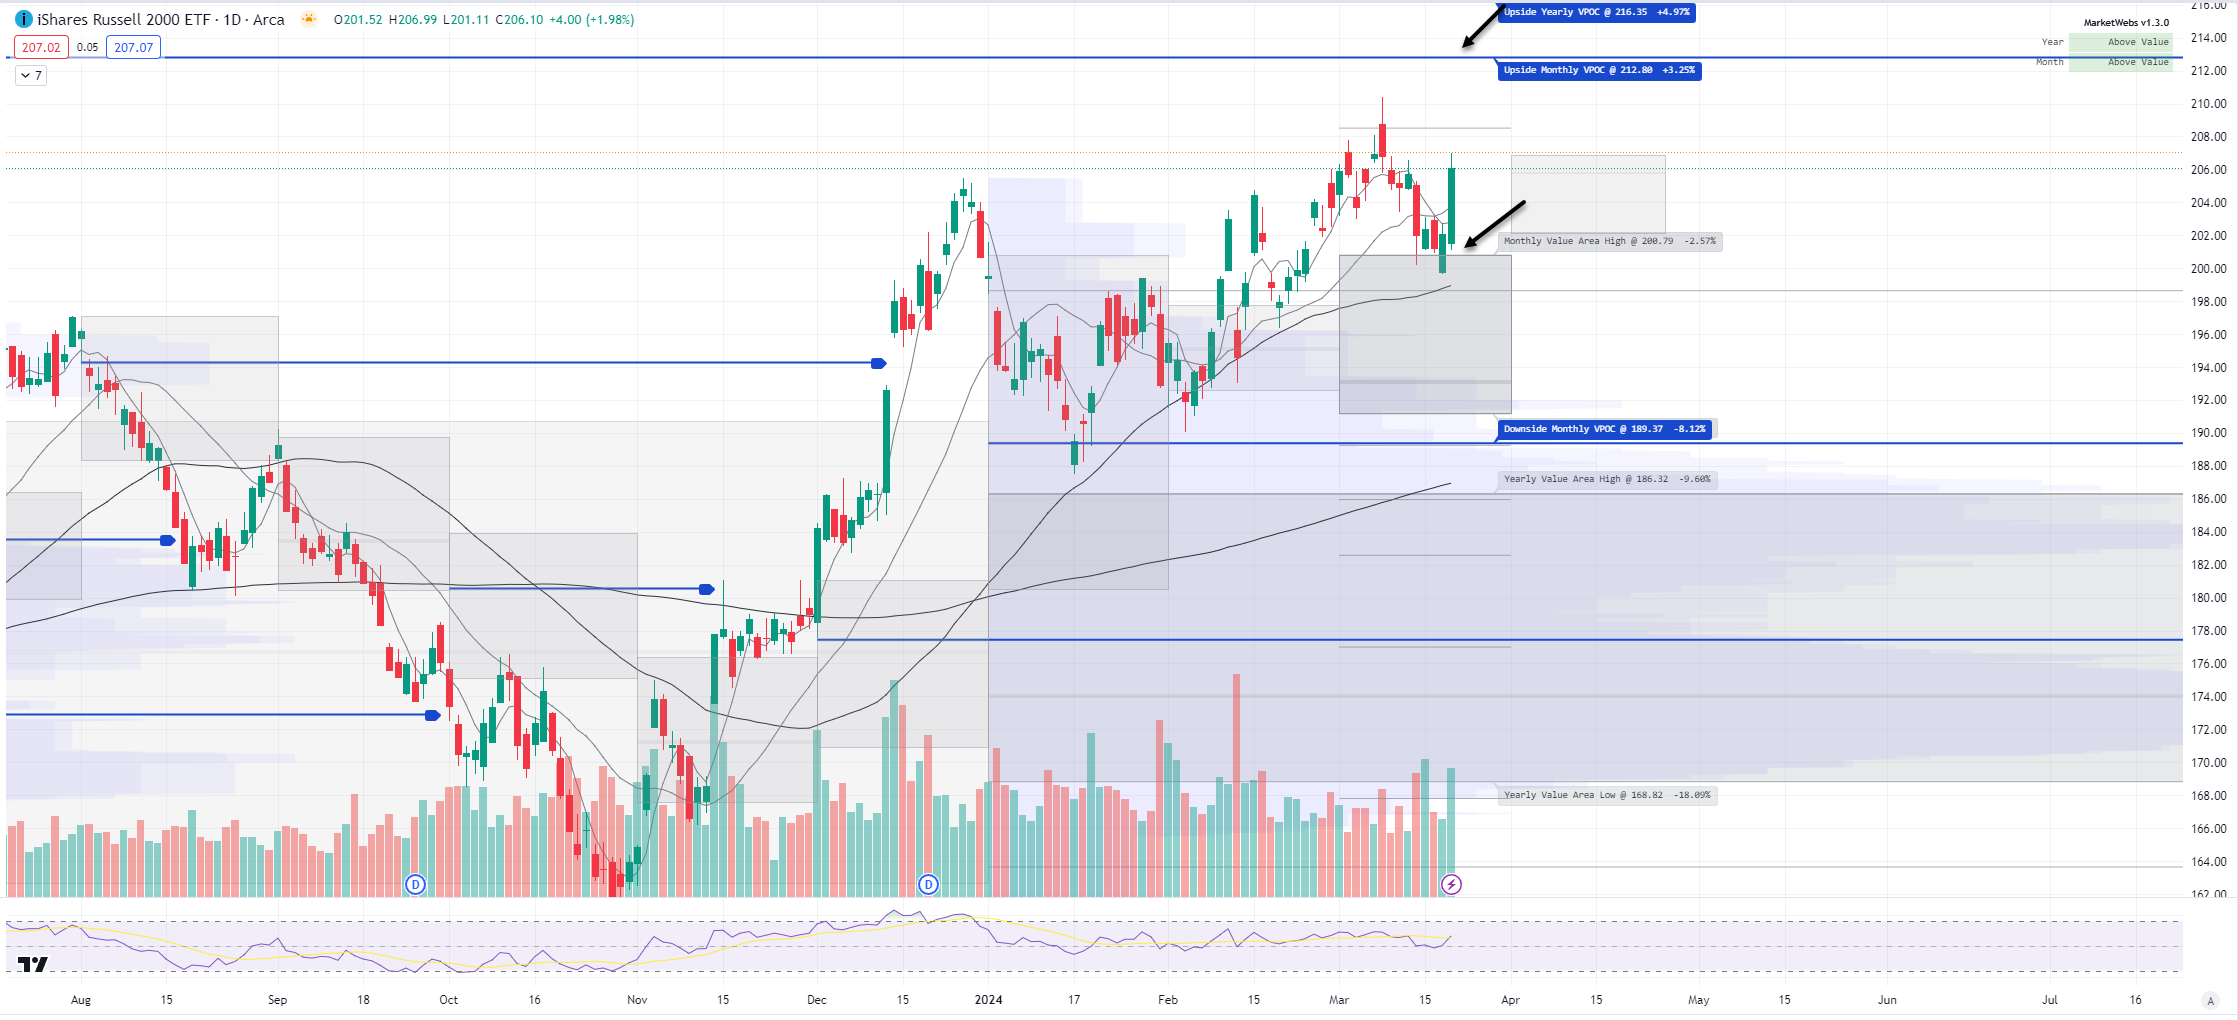
IWM - Russell Small Cap ETF- Price ind. +0.6% and will be challenging that 3/8 recent high. If price can continue to rally, next level to watch is $212.8 VPOC
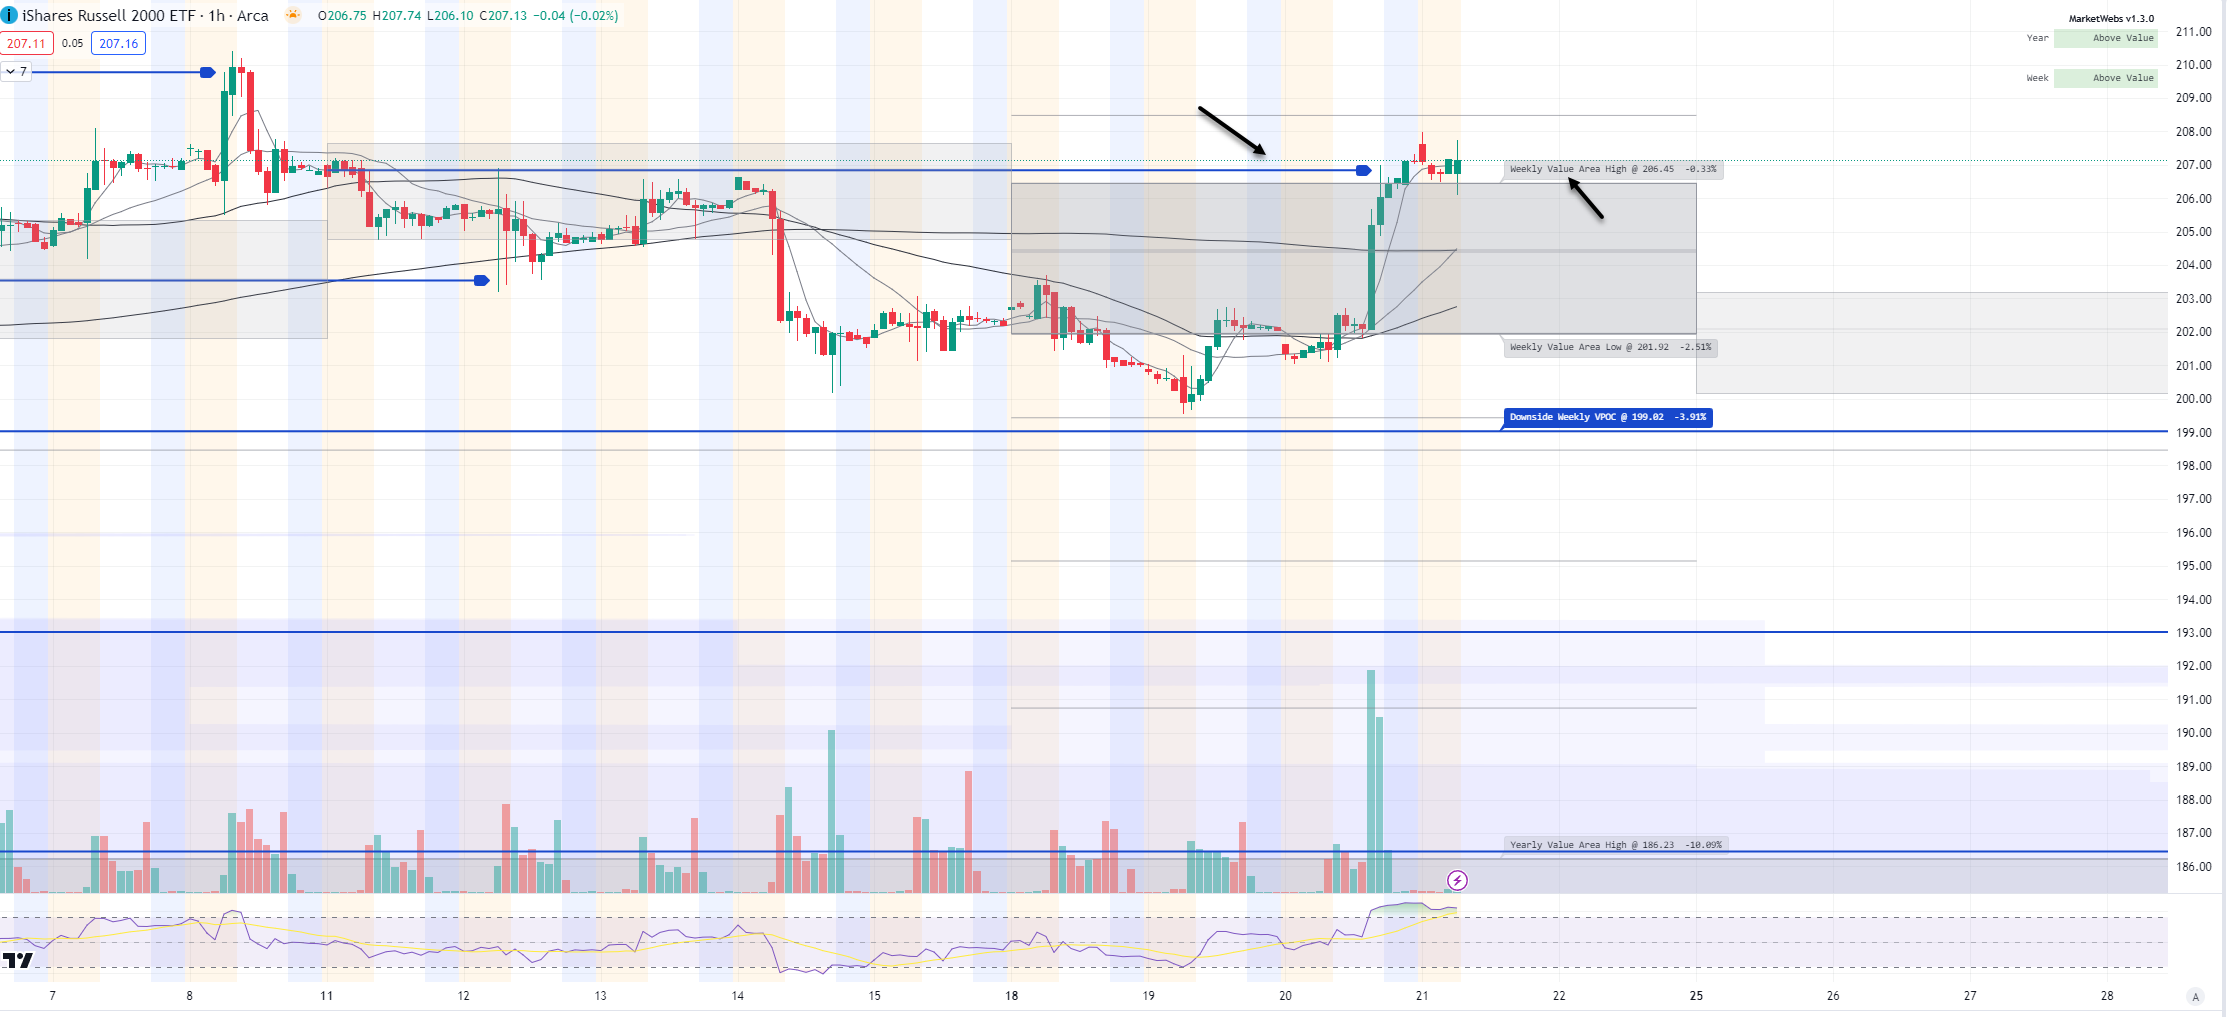
1hr chart: Price is just above its Value Area for the week & a VPOC (blue line) was taken out , support to watch $206.45
Here is today’s TTG Proprietary Stock Screen “Out of the Box” using Volume At Price
names trending above their Value Areas (on 3 multiple timeframes & not super extended)
Keep reading with a 7-day free trial
Subscribe to The Tribeca Trade Group to keep reading this post and get 7 days of free access to the full post archives.