

TTG Index Charts & Out of the Box Stock Screen 2/16/24 $LHX
TTG Index Charts & Out of the Box Stock Screen 2/16/24 $LHX
Out of the Box MarketWebs Screen
US Dollar +0.1% / 30yr Bonds -0.3% / Crude -0.9% & Nat Gas +1.2% / Gold +0.2% / Copper +1.5% / BTC +1.4%
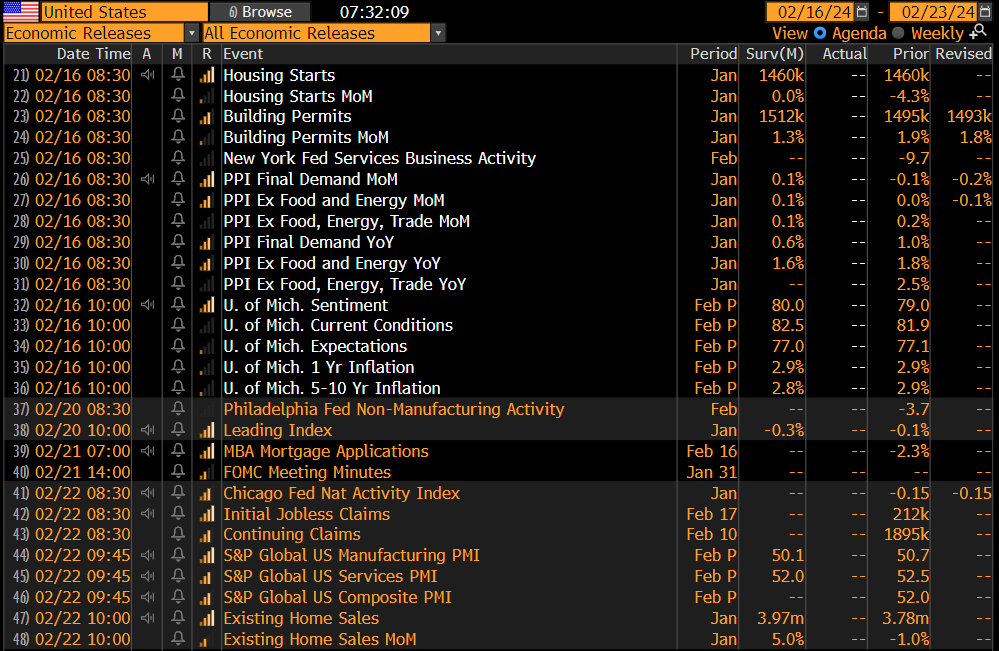
US Upcoming Economics
US Bond Yields
Index Updates
At TTG, I use Volume At Price in my chart analysis and I use the MarketWebs Indicator to provide Value Areas & VPOCs which indicate significant support & resistance levels. Learn More Here about Volume At Price and the MarketWebs.
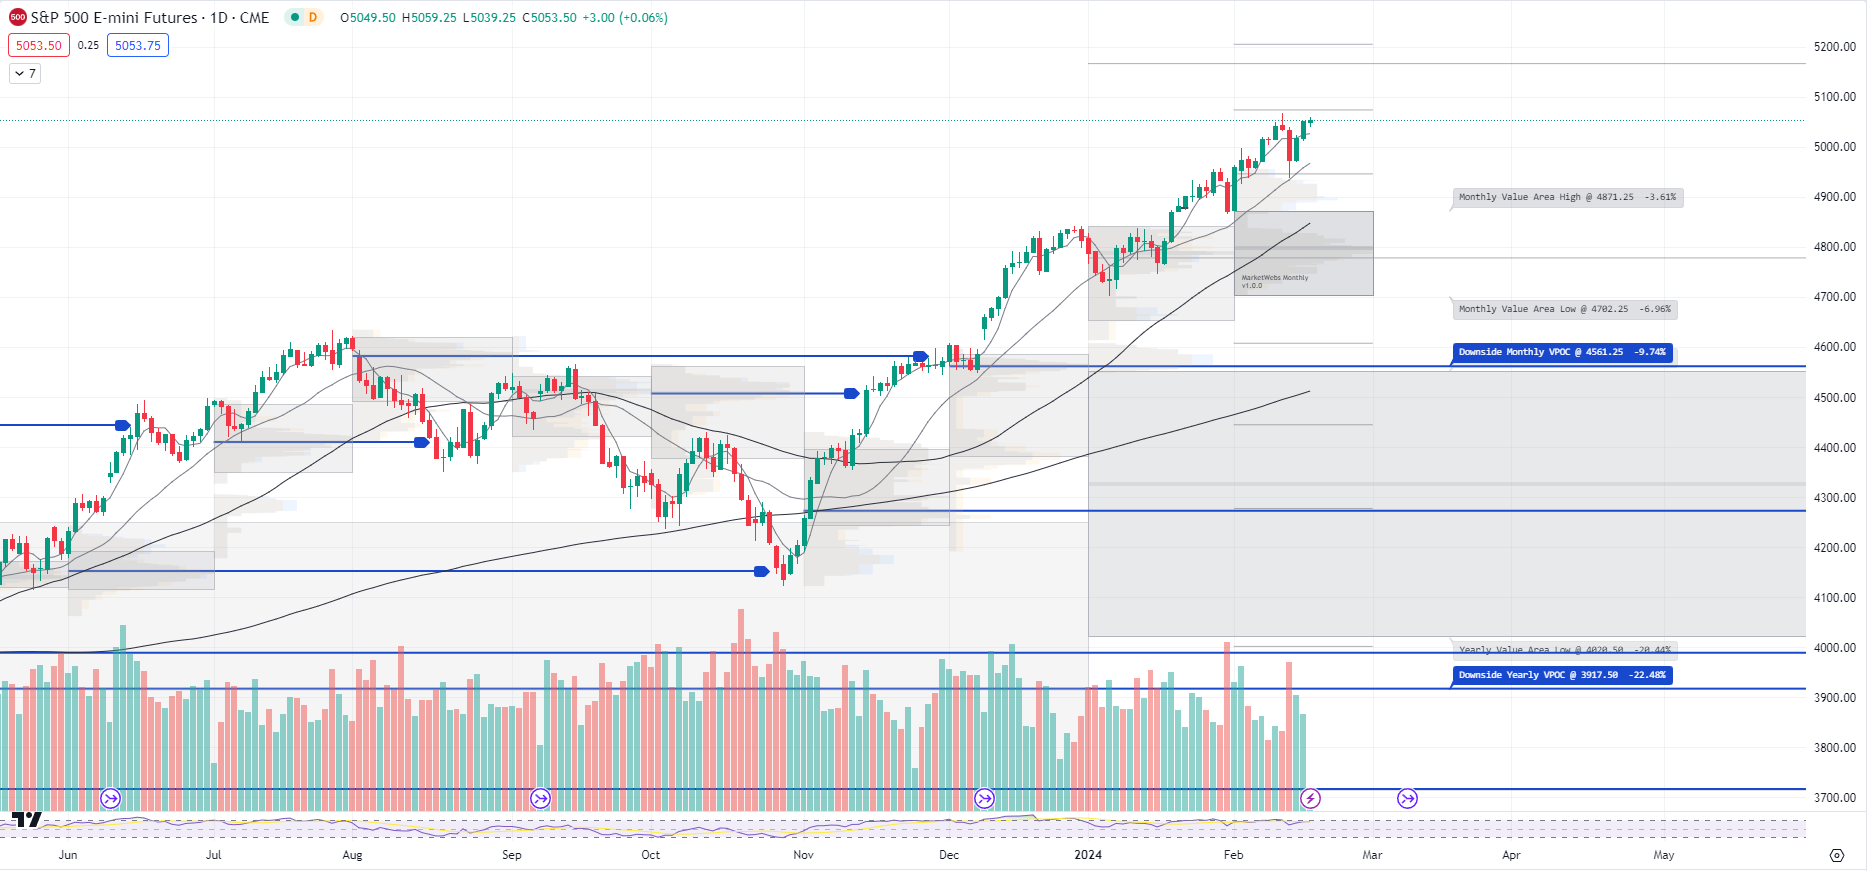
ES_F - SPX Futures - Price ind. +0.2% and just a about a full recovery from this week's Volatility earlier in the week. Notable, that the VIX almost hit a high of 18 on Tues and is now back down to ~ 14. Price in S&P futures is back above its 5d MA (Moving Average) and there is a PP report today at 8:30am
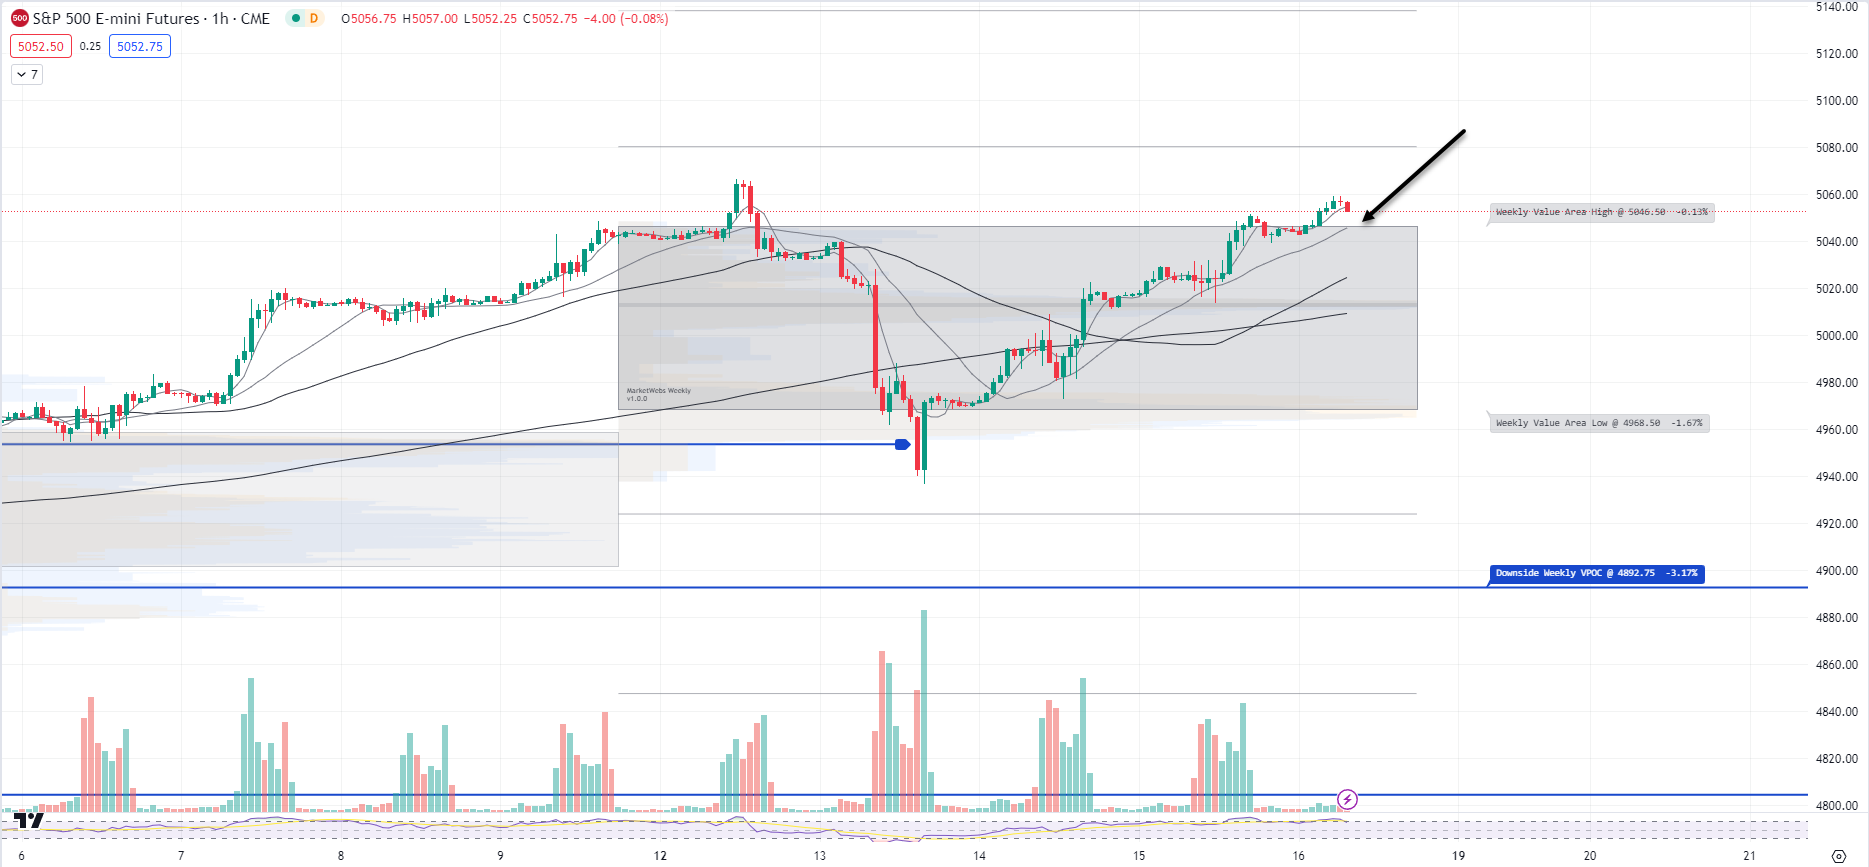
1hr chart: Price is back above its Value Area for the week, support to watch is 5046.5
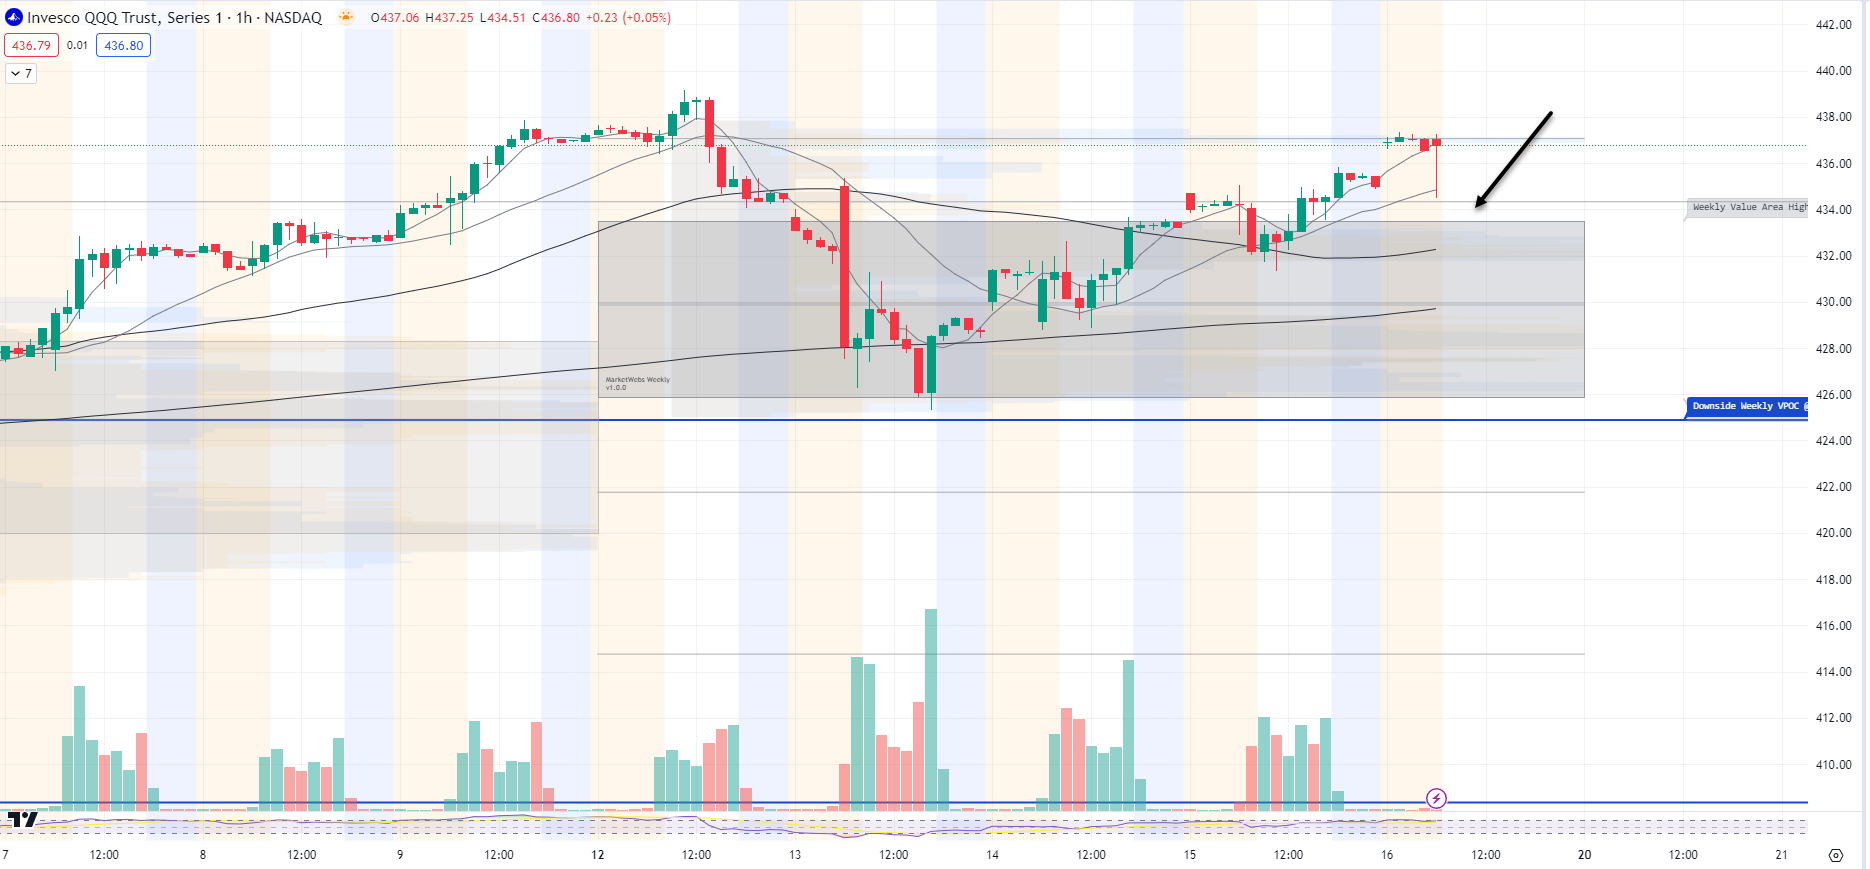
QQQ - NDX 100 ETF - Daily chart: Price ind. +0.5% ahead of this morning's PPI report and price is right at its 5d MA

1hr chart: Price back above its Value Area for the week and essentially where price started the week, support to watch is $433.5
IWM - Russell Small Cap ETF- Price taking a small breather this morning after an aggressive move the last 2 days, ind. -0.2% premarket. Price is above the Feb Value Area for the month
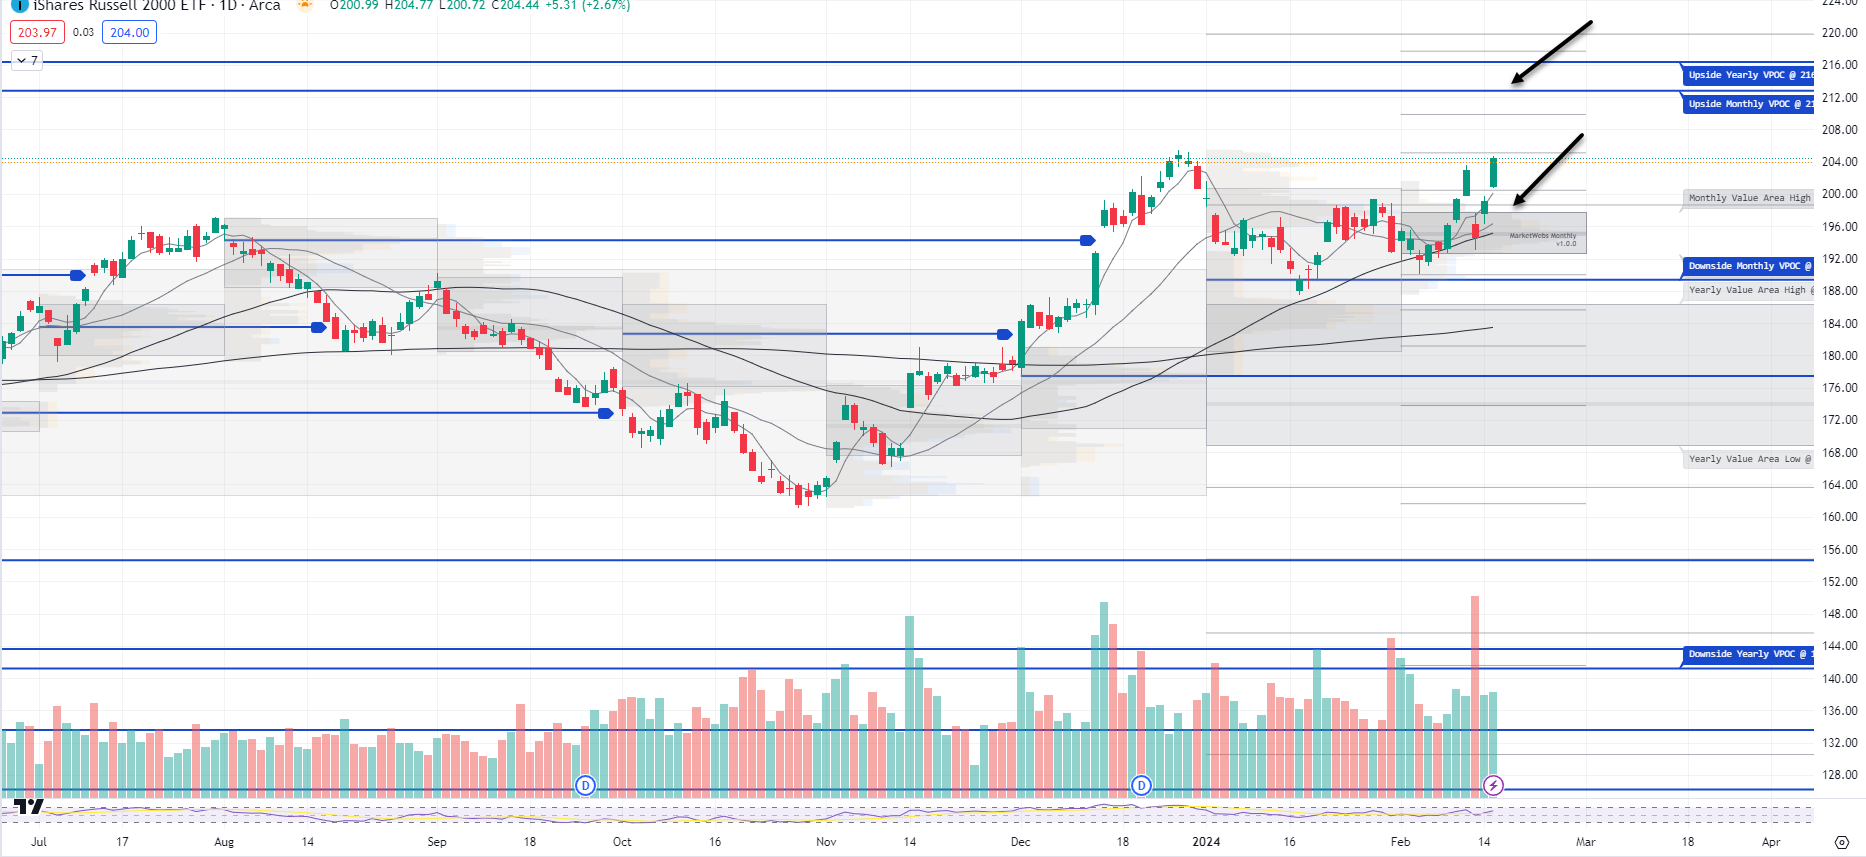
1hr chart: Price took out an upside VPOC and is pausing , watch for direction around that blue line, $209.77

Here is today’s TTG Proprietary Stock Screen “Out of the Box” using Volume At Price
names trending above their Value Areas (on 3 multiple timeframes & not super extended)
Keep reading with a 7-day free trial
Subscribe to The Tribeca Trade Group to keep reading this post and get 7 days of free access to the full post archives.