

TTG Index Charts & Out of the Box Stock Screen 01/19/24 $AFL $MKSI
TTG Index Charts & Out of the Box Stock Screen 01/19/24 $AFL $MKSI
Out of the Box MarketWebs Screen
US Dollar -0.2% / 30yr Bonds +0.2% / Crude -0.4% & Nat Gas -3.2% / Gold +0.7% / Copper +0.7% / BTC +1.0%
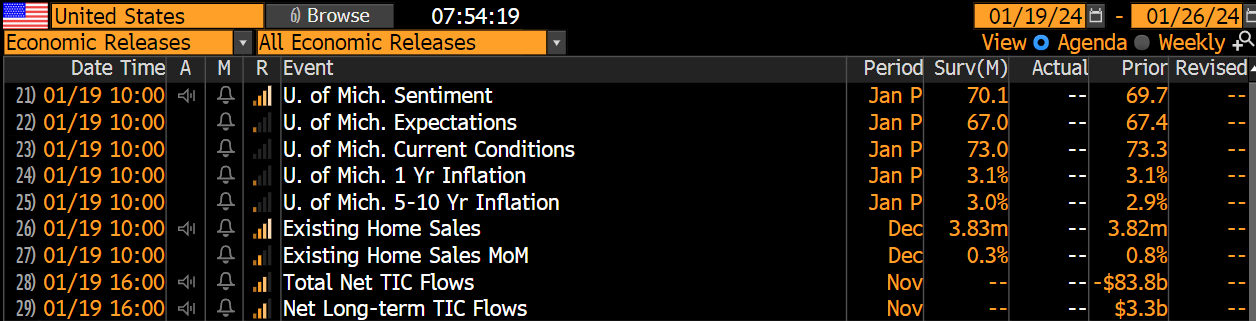
US Upcoming Economics
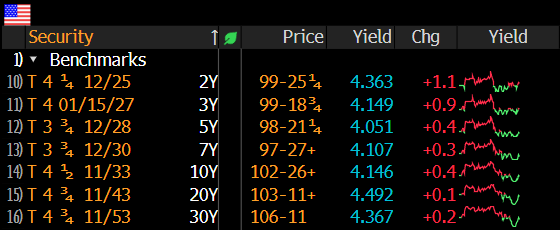
US Bond Yields
Index Updates
At TTG, I use Volume At Price in my chart analysis and I use the MarketWebs Indicator to provide Value Areas & VPOCs which indicate significant support & resistance levels. Learn More Here about Volume At Price and the MarketWebs.
$ES_F- S&P Futures - An interesting development this morning with price rallying above its Jan Value Area - could we see the fist close above its Value Area this year/ month??? That would be a significant development imo as price would begin to breakout
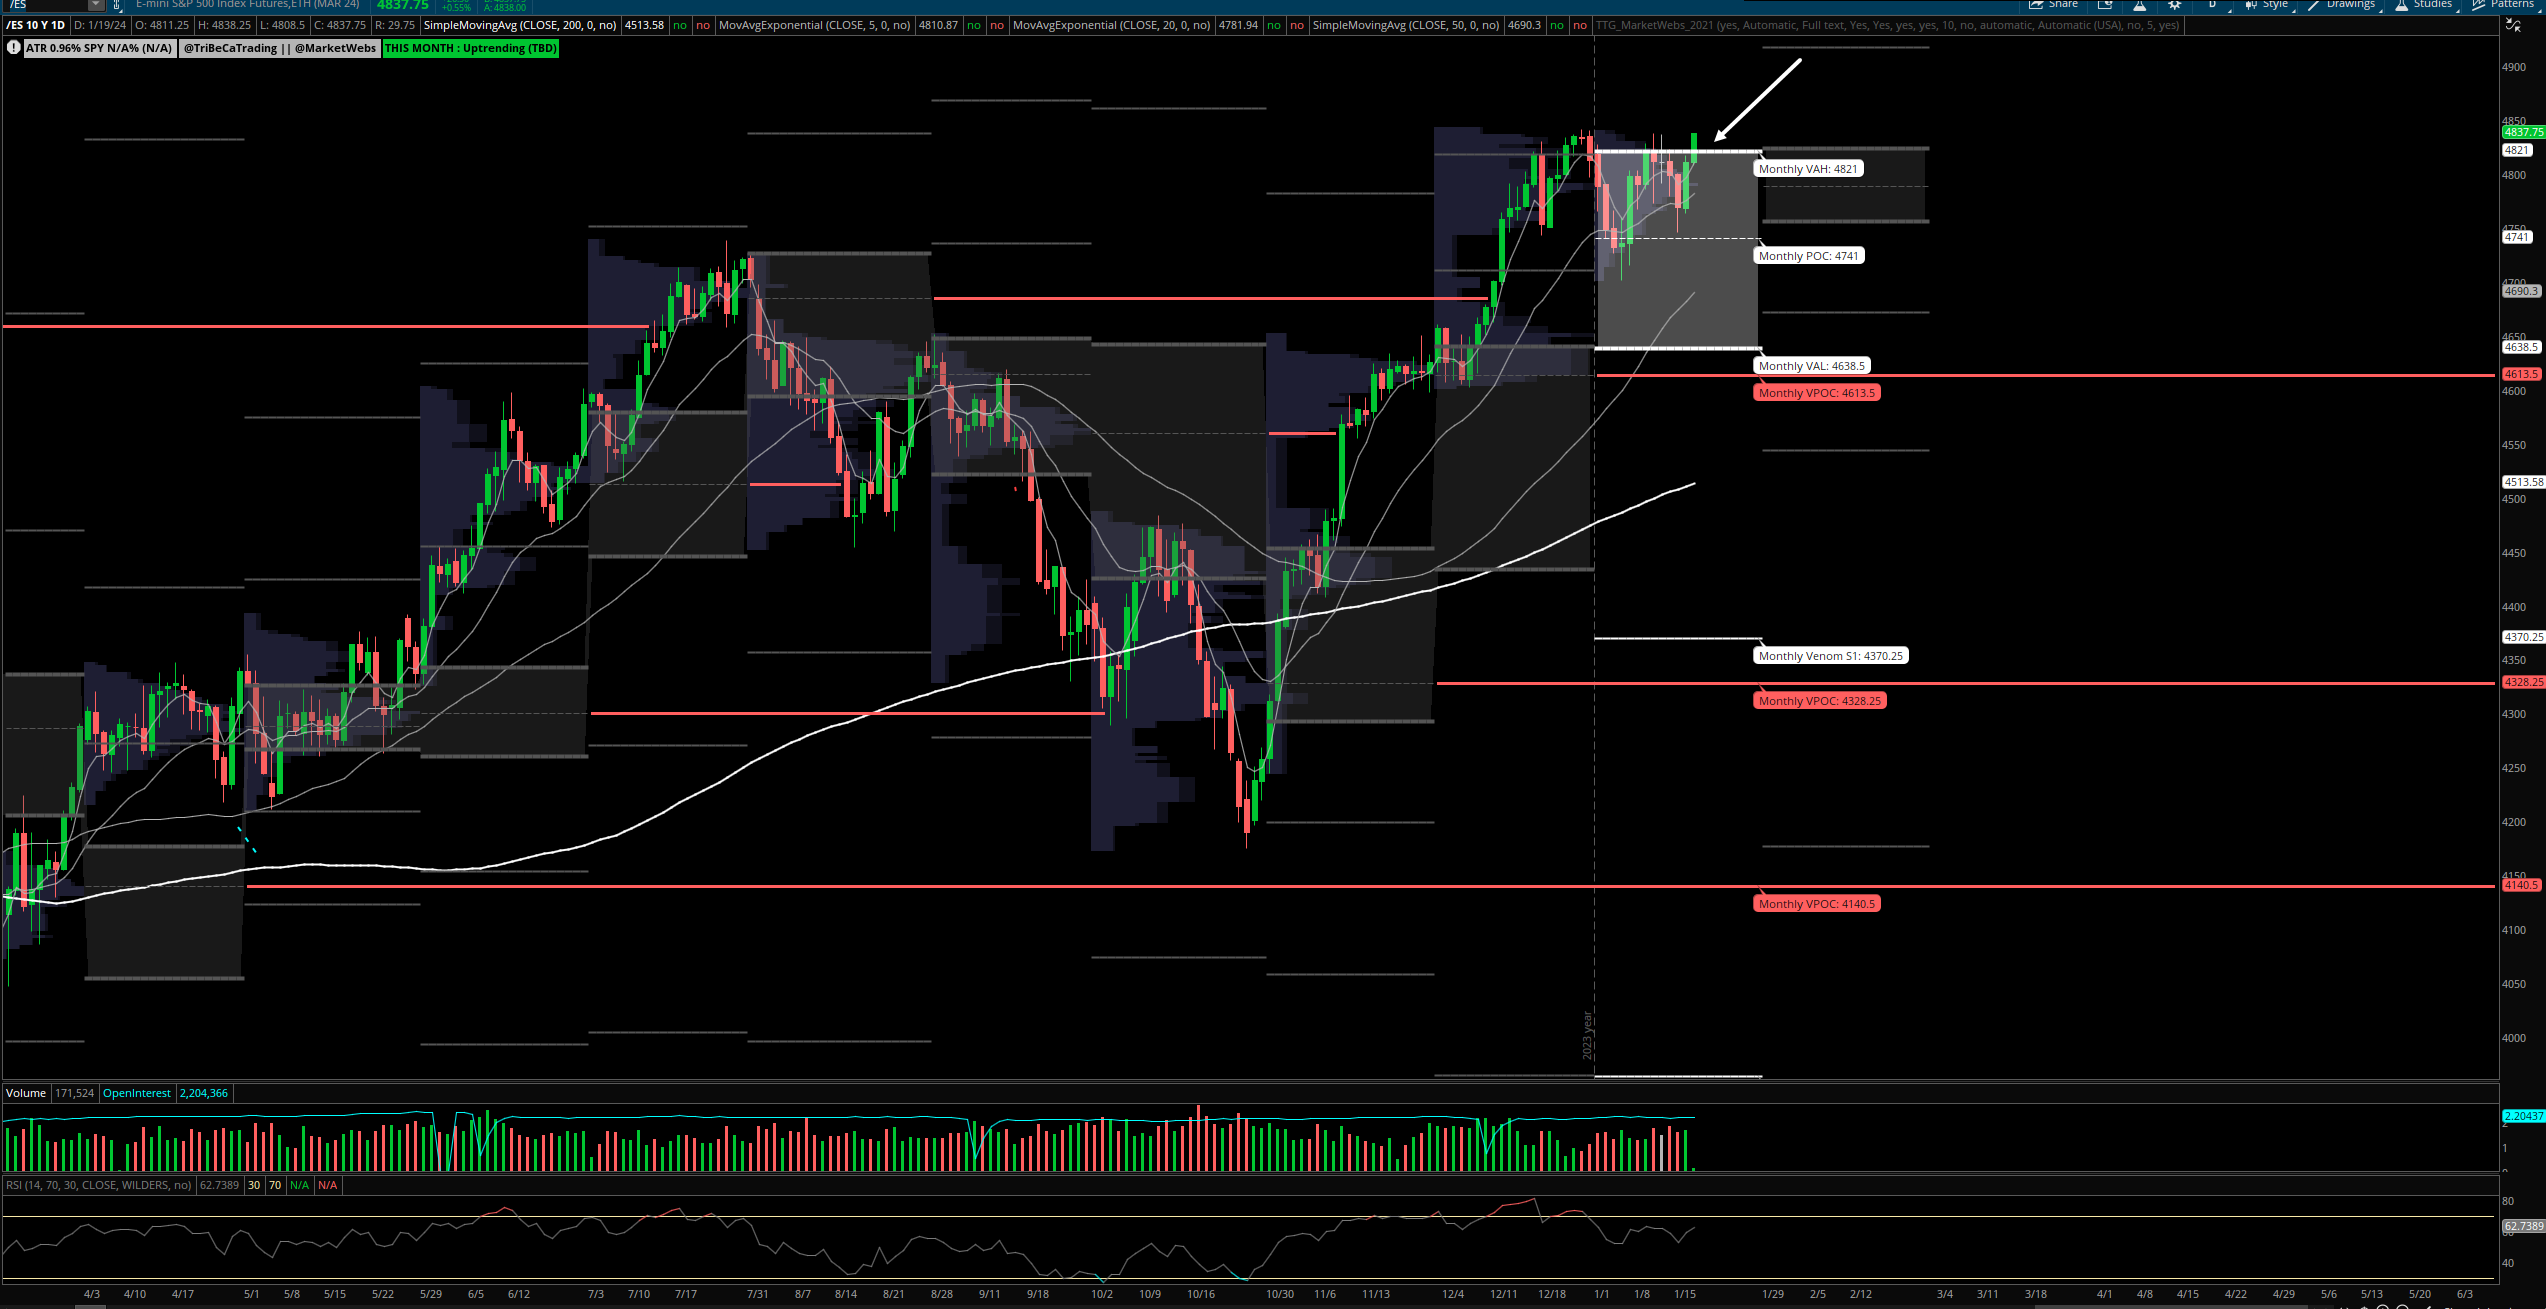
1hr chart: After the VPOC reversal earlier in the week, price has been trending higher and now above its Value Area for the week, watch 4826.25 support

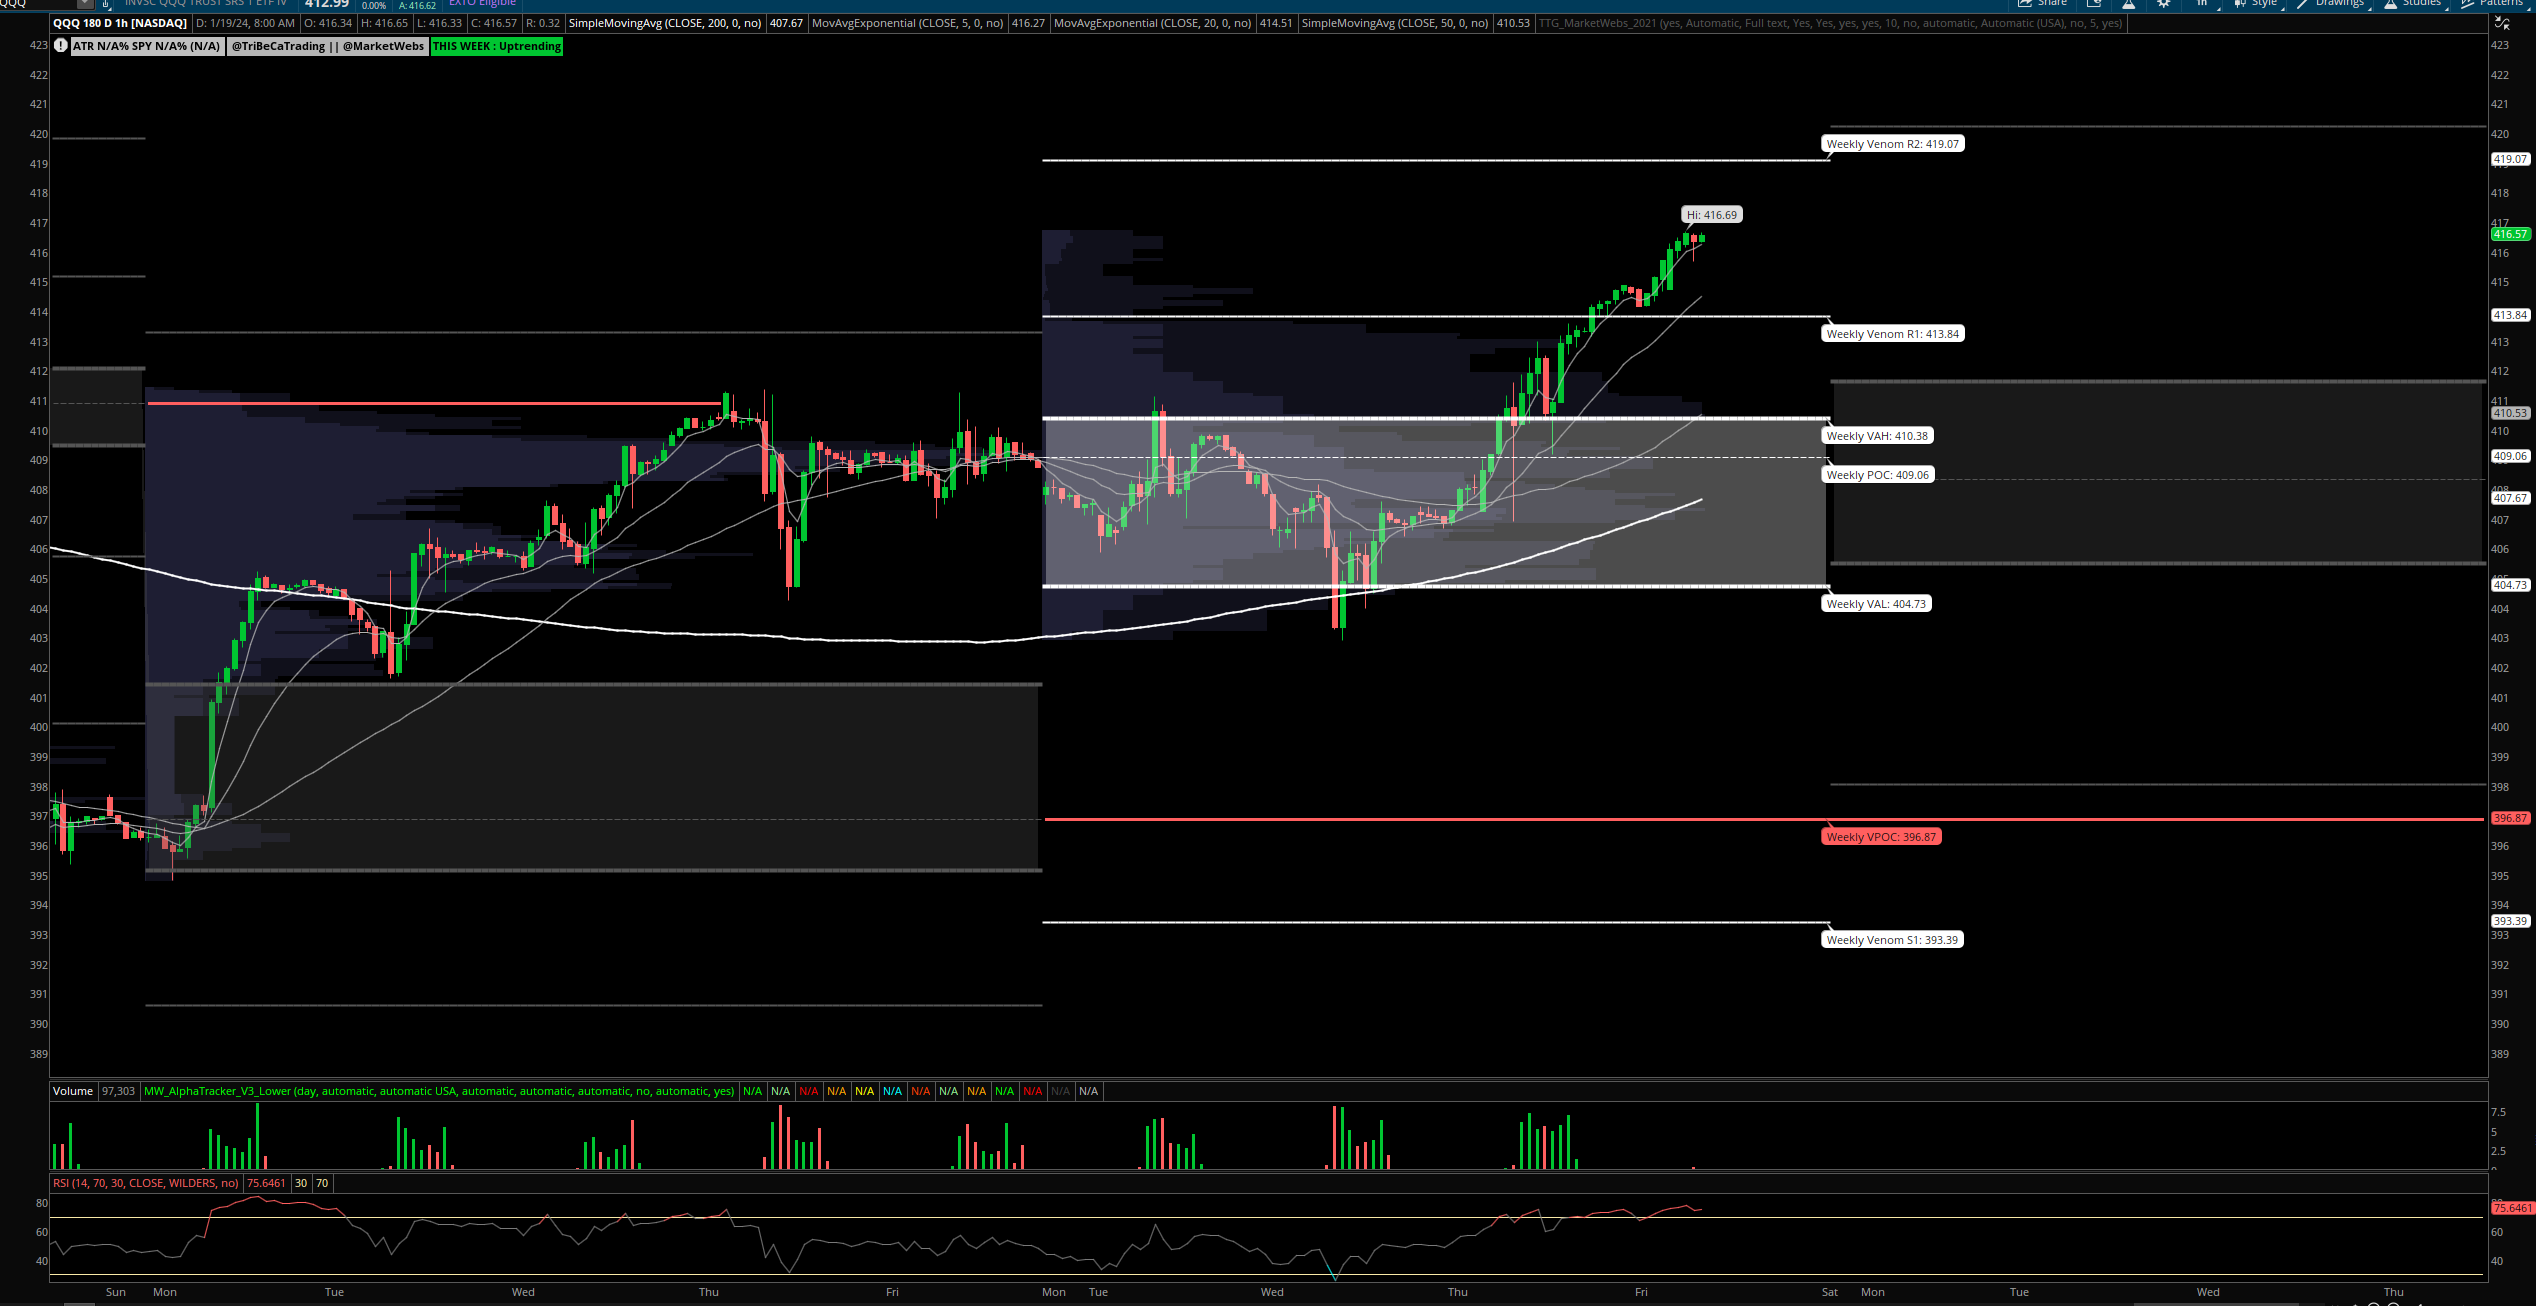
QQQ - NDX 100 ETF - Daily chart: Price continuing from yesterday's rally and ind. +0.8%. Price is now breaking out above its Jan Value Area
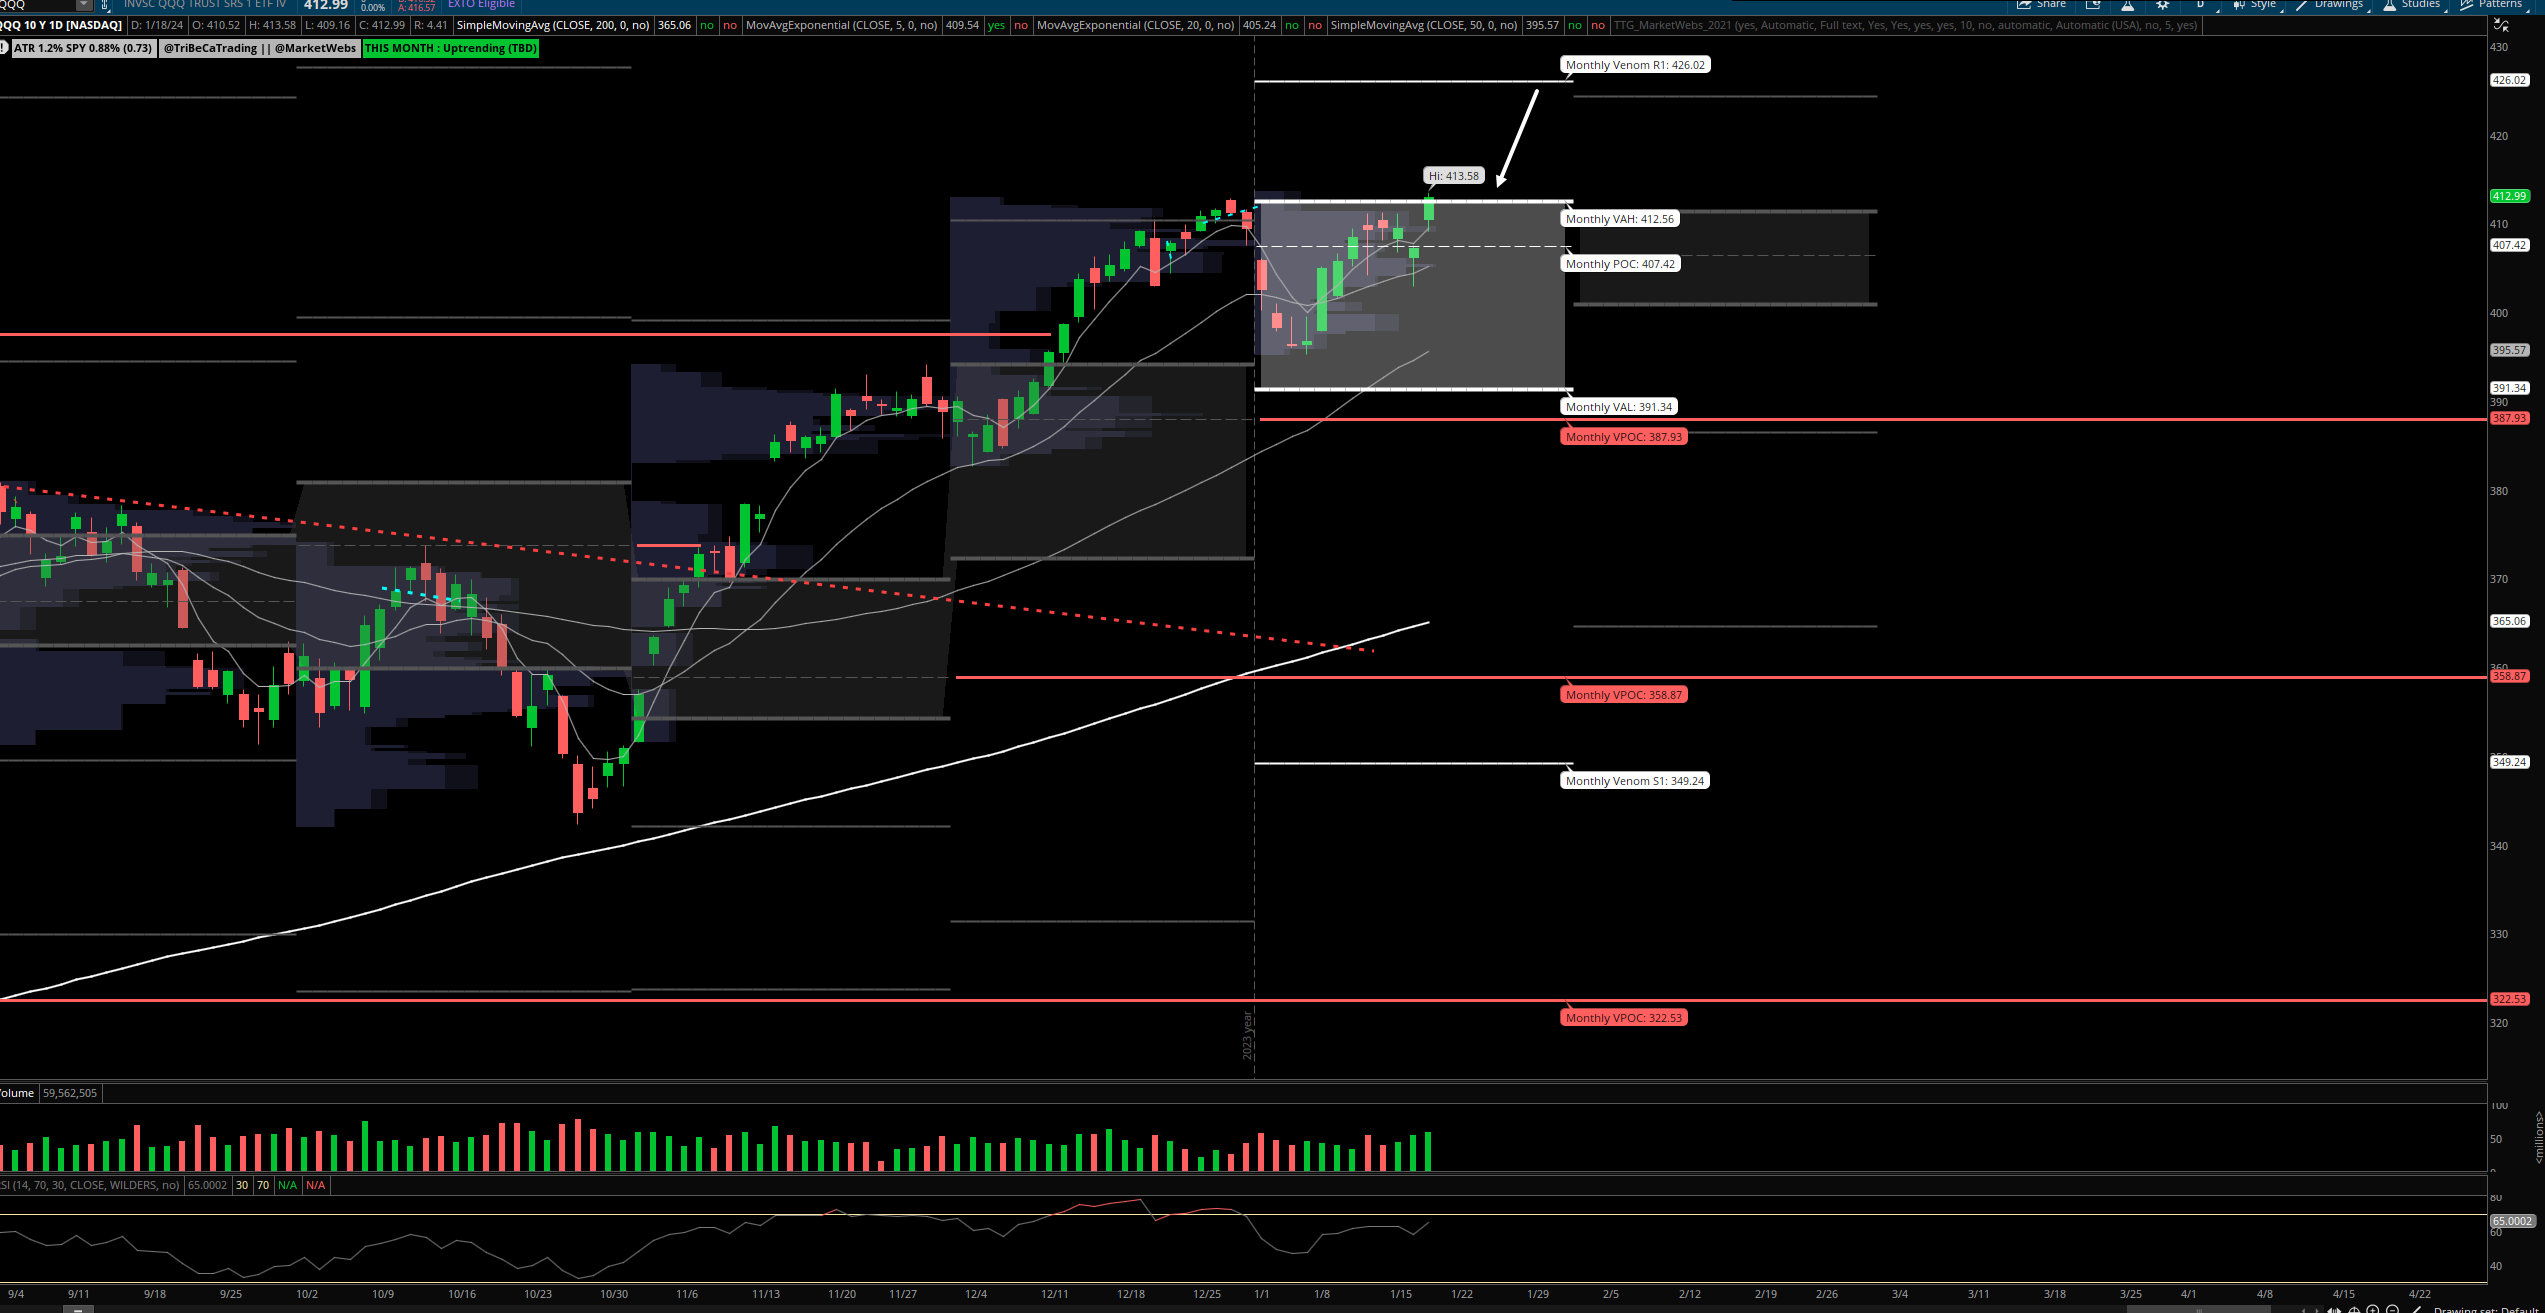
1hr chart: Price is extending above its Value Area for the week
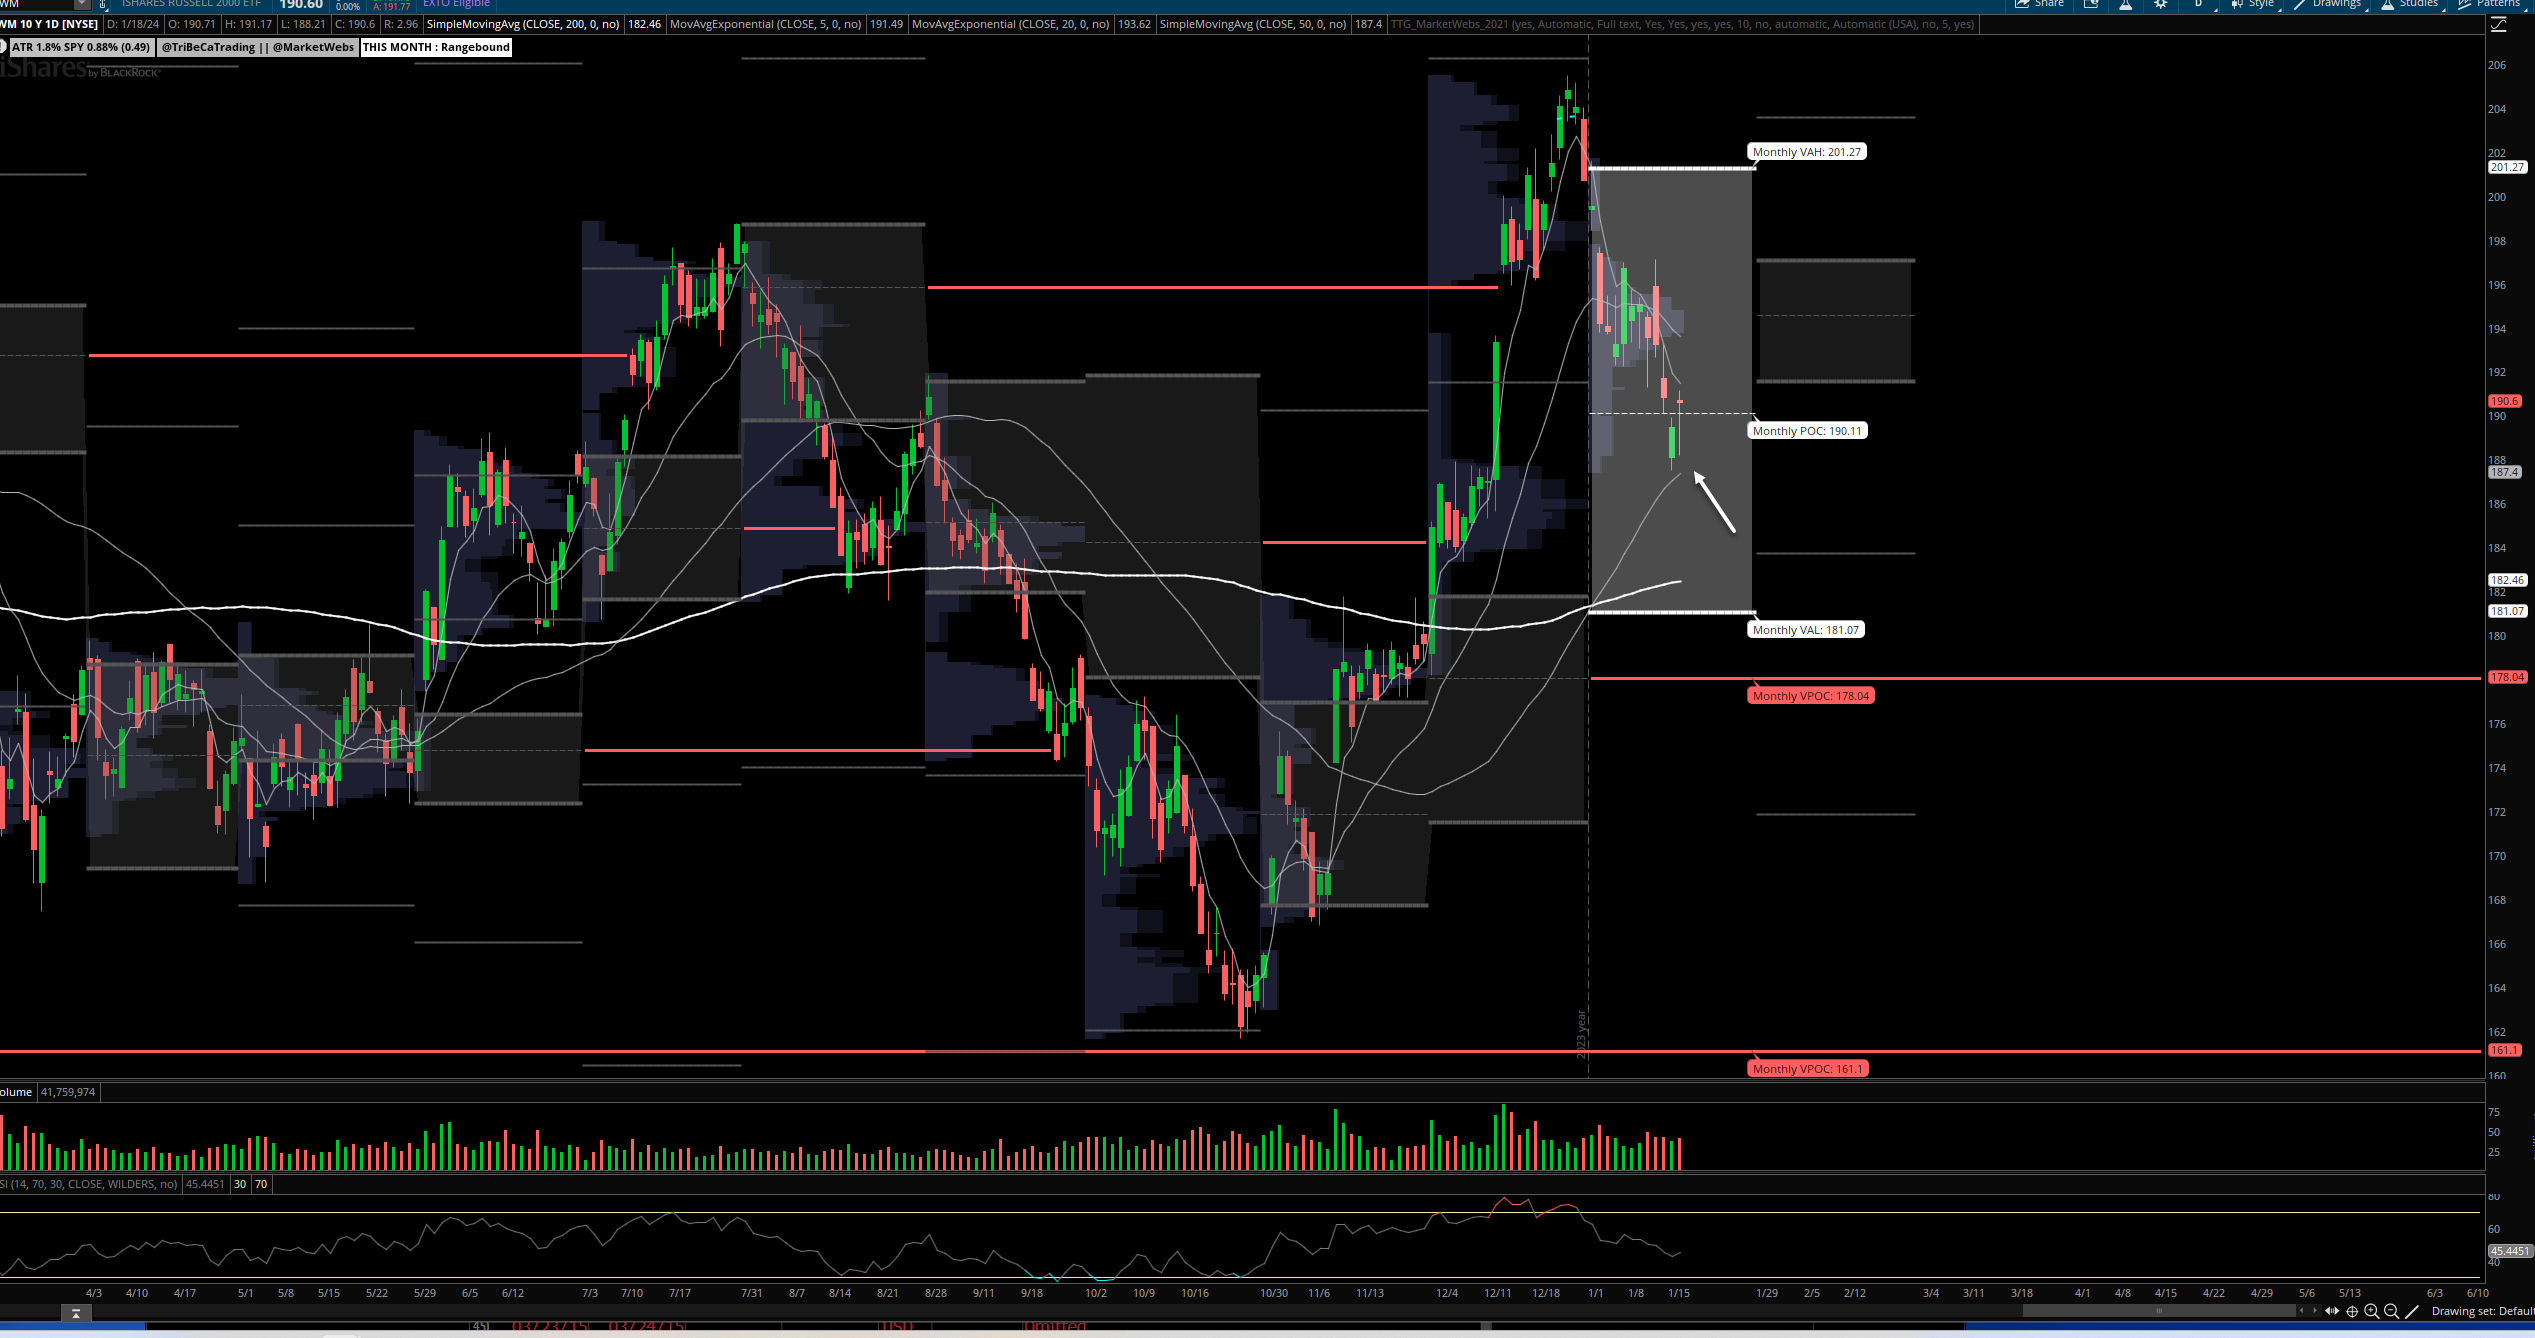
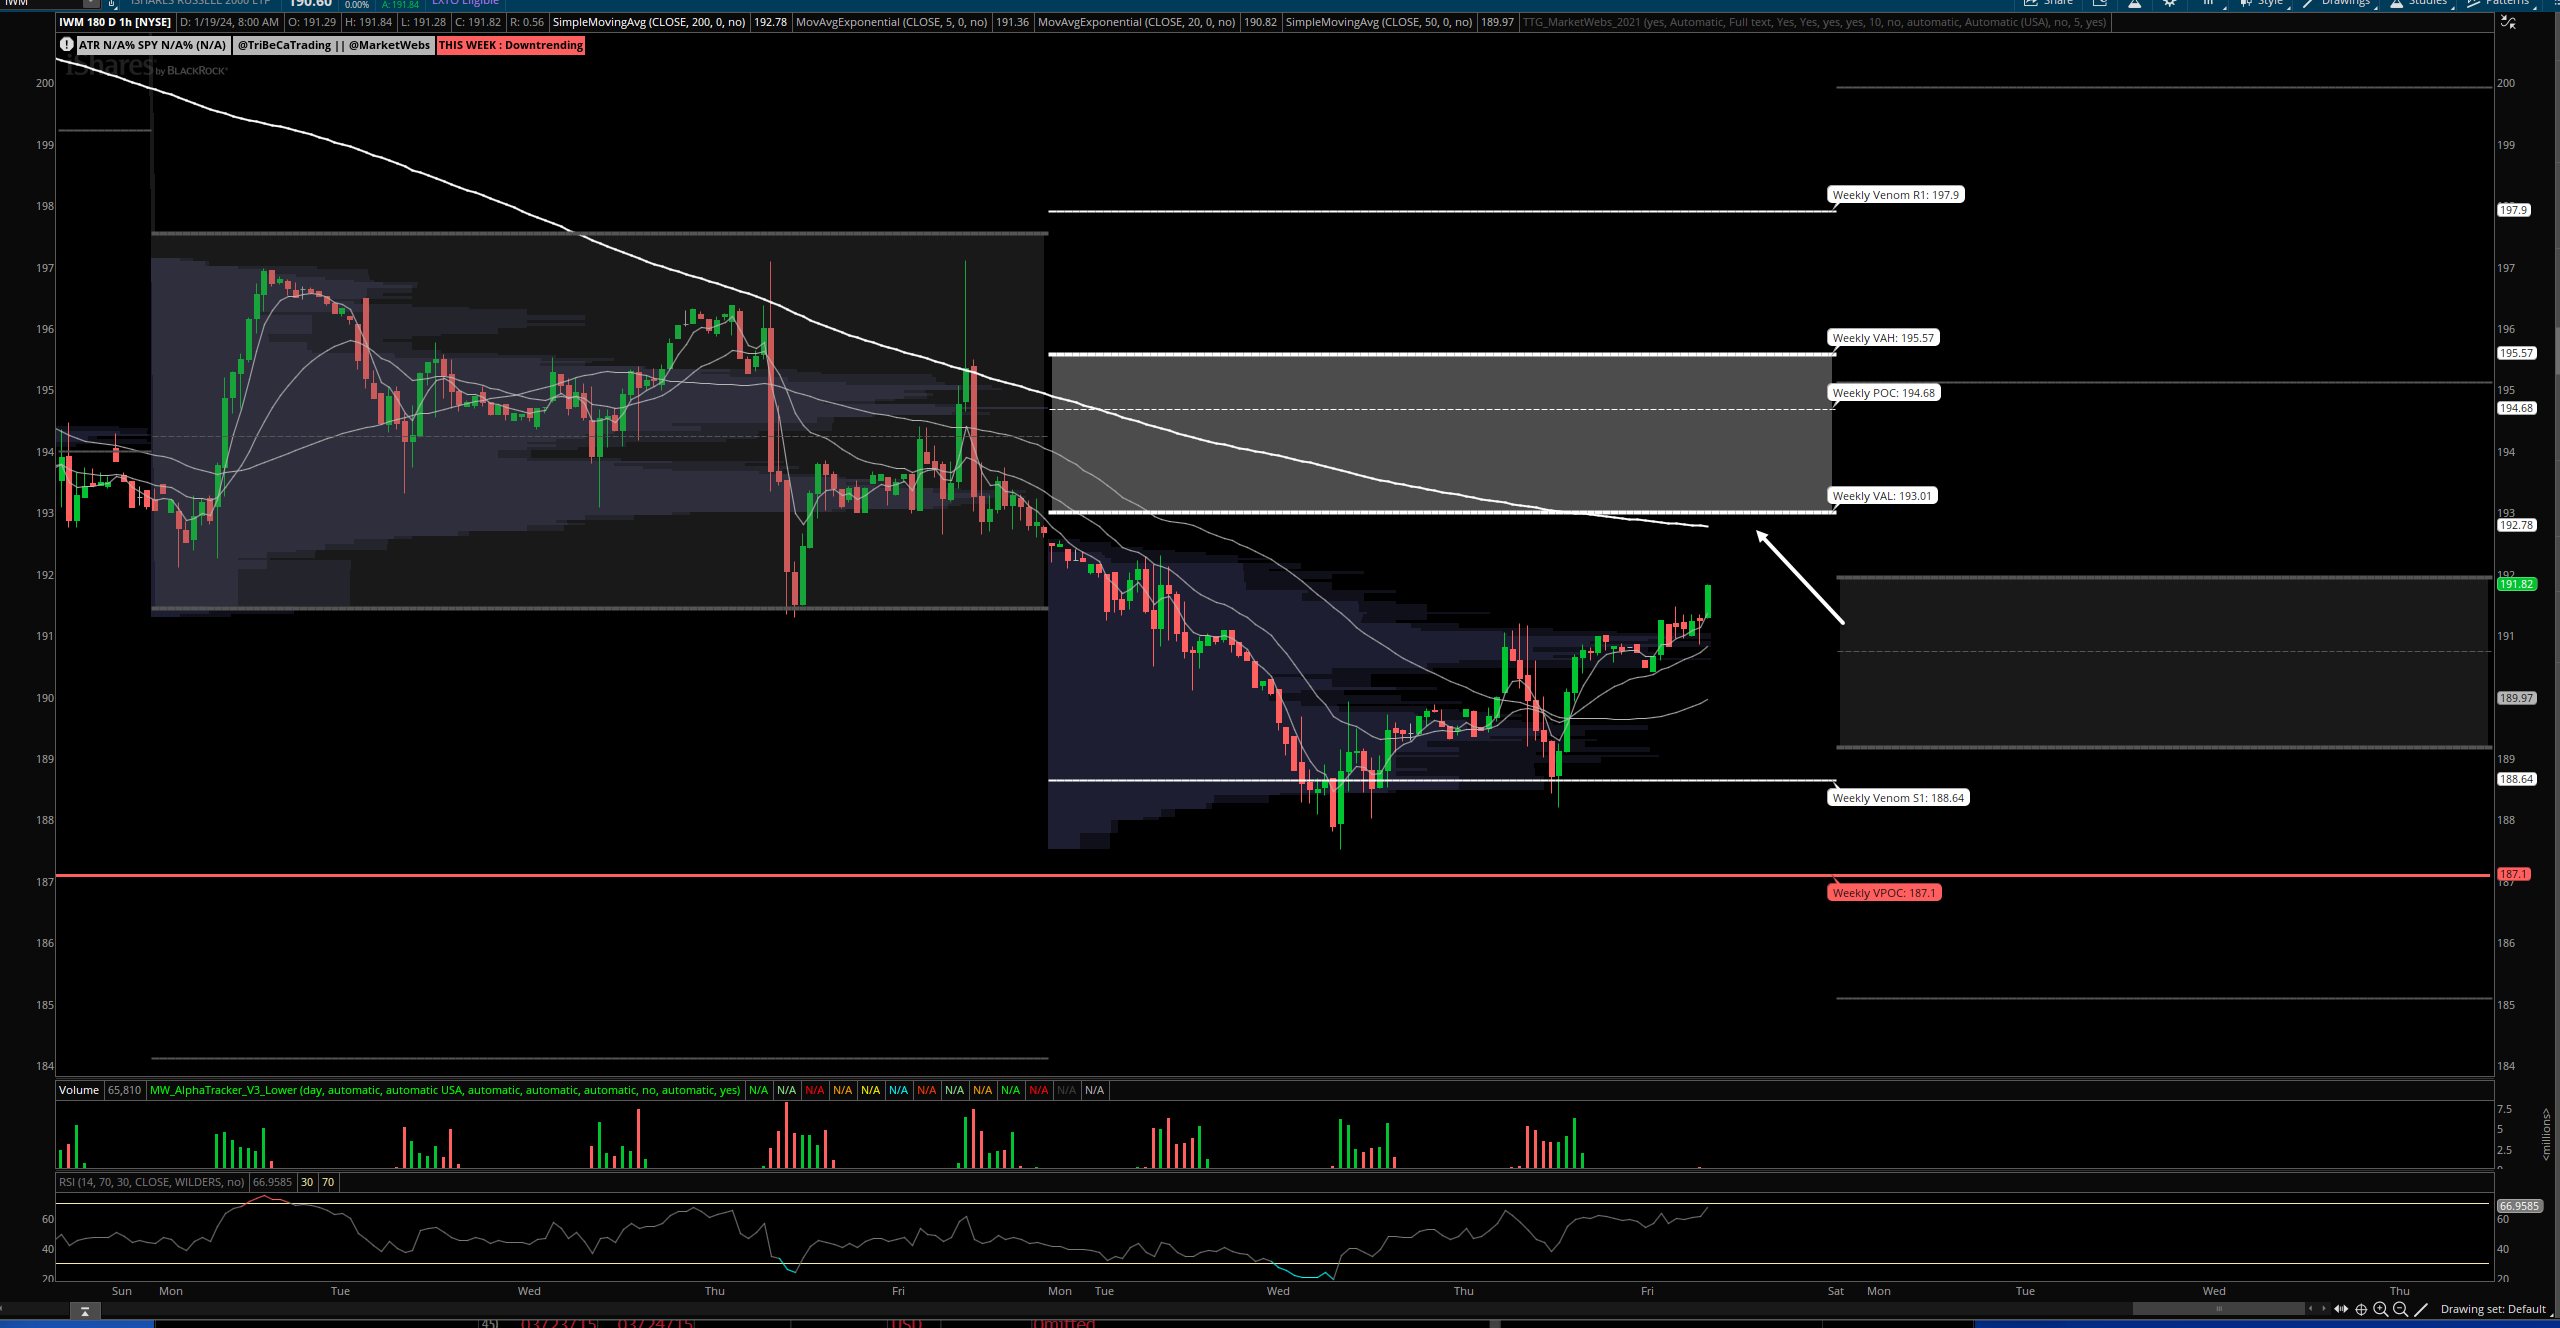
IWM - Russell Small Cap ETF- Price ind. +0.6% this morning and continuing to bounce above its 50d MA (Moving Average)
1hr chart: Price still below its Value Area for the week but moving closer to that bottom of the bottom of Value Area $193
Here is today’s TTG Proprietary Stock Screen “Out of the Box” using Volume At Price
names trending above their Value Areas (on 3 multiple timeframes & not super extended)
Keep reading with a 7-day free trial
Subscribe to The Tribeca Trade Group to keep reading this post and get 7 days of free access to the full post archives.