

TTG Index Charts & Out of the Box Stock Screen 2/2/24 $GFL $CAVA
TTG Index Charts & Out of the Box Stock Screen 2/2/24 $GFL $CAVA
Out of the Box MarketWebs Screen
US Dollar -0.1% / 30yr Bonds -0.2% / Crude -0.4% & Nat Gas -0.8% / Gold +0.1% / Copper -0.1% / BTC +0.2%
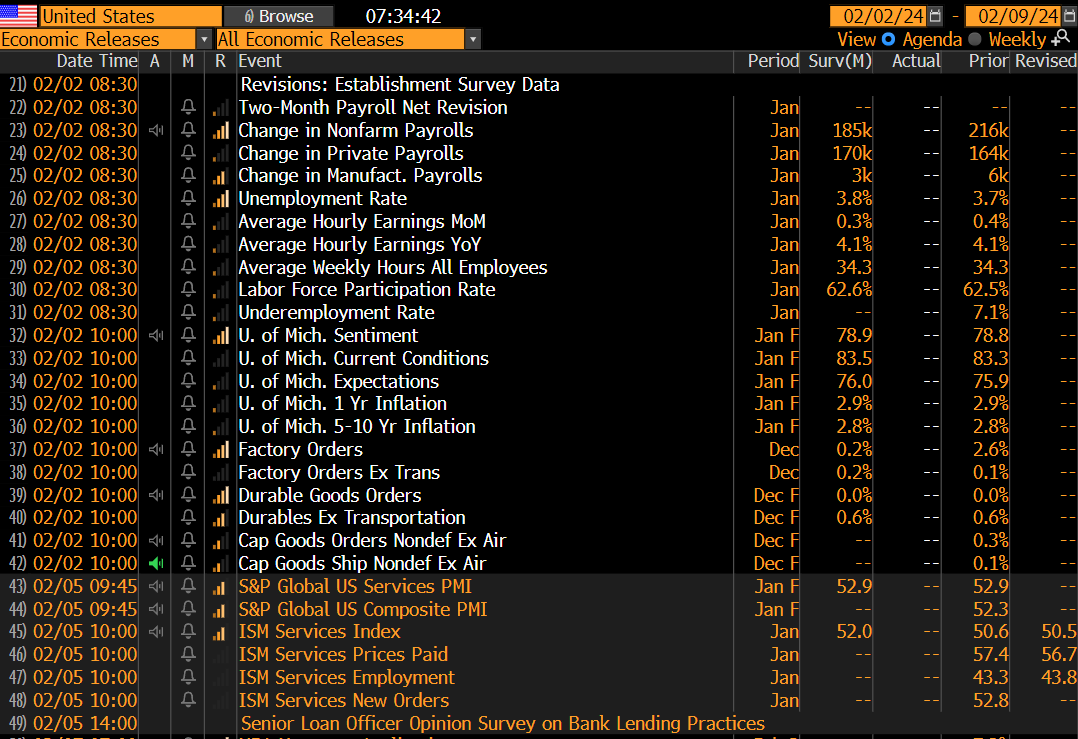
US Upcoming Economics
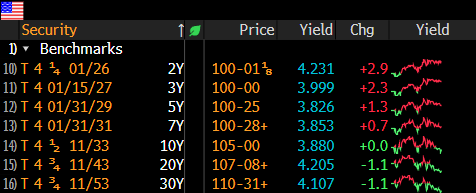
US Bond Yields
Index Updates
At TTG, I use Volume At Price in my chart analysis and I use the MarketWebs Indicator to provide Value Areas & VPOCs which indicate significant support & resistance levels. Learn More Here about Volume At Price and the MarketWebs.
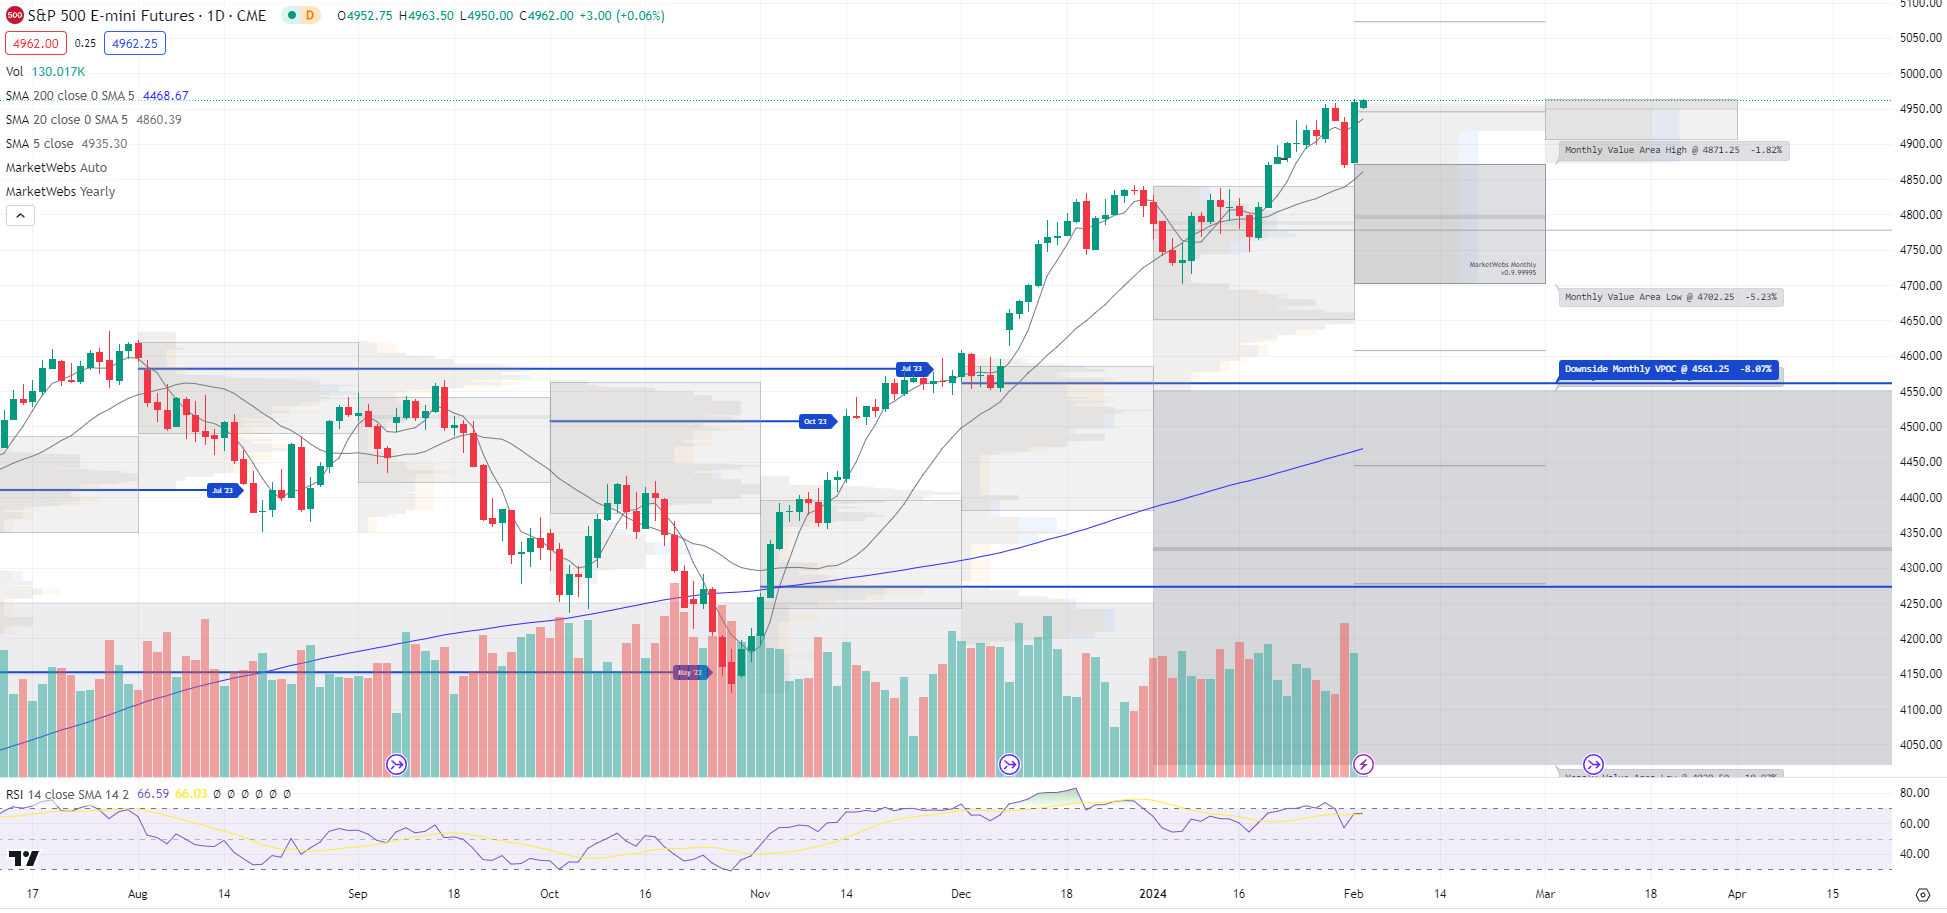
ES_F - SPX Futures - Price rallying, ind. +0.7% on strong earnings reports and trying to push to new highs ahead of this morning's monthly Jobs
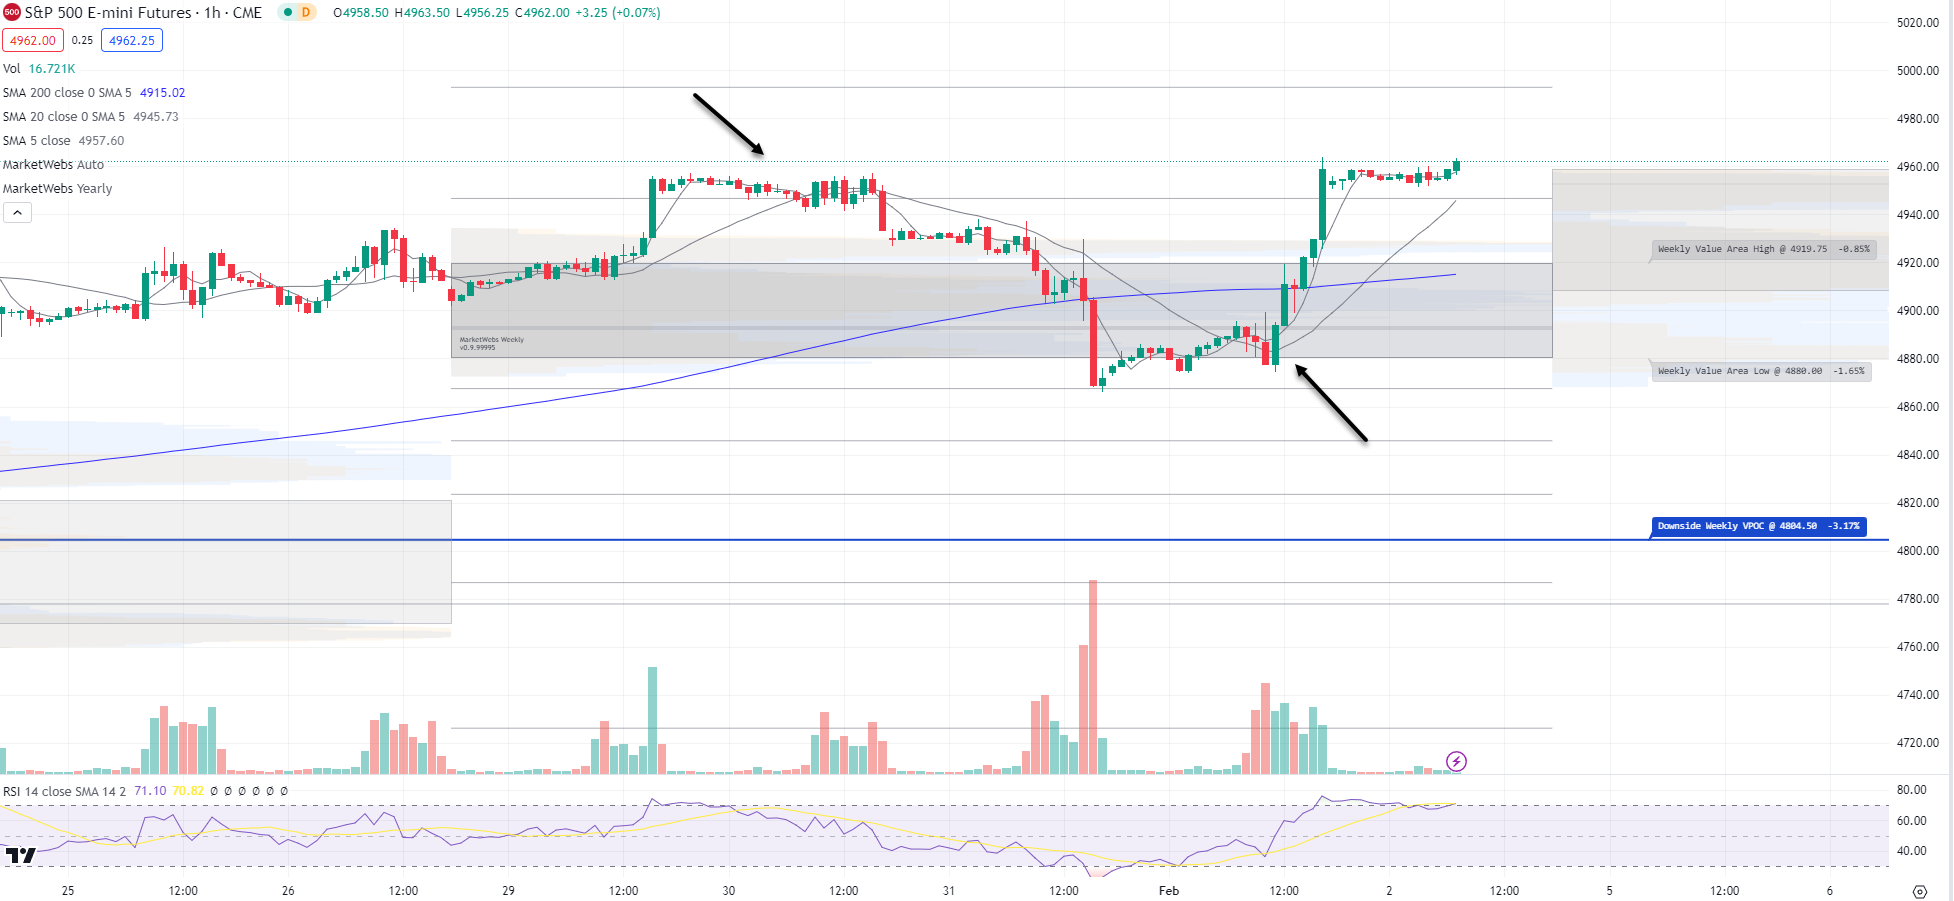
1hr chart: After finding support at the bottom of this week's Value Area, price is now testing this week's highs. This morning's Jobs reports could be pivotal on whether price closes at new highs today's
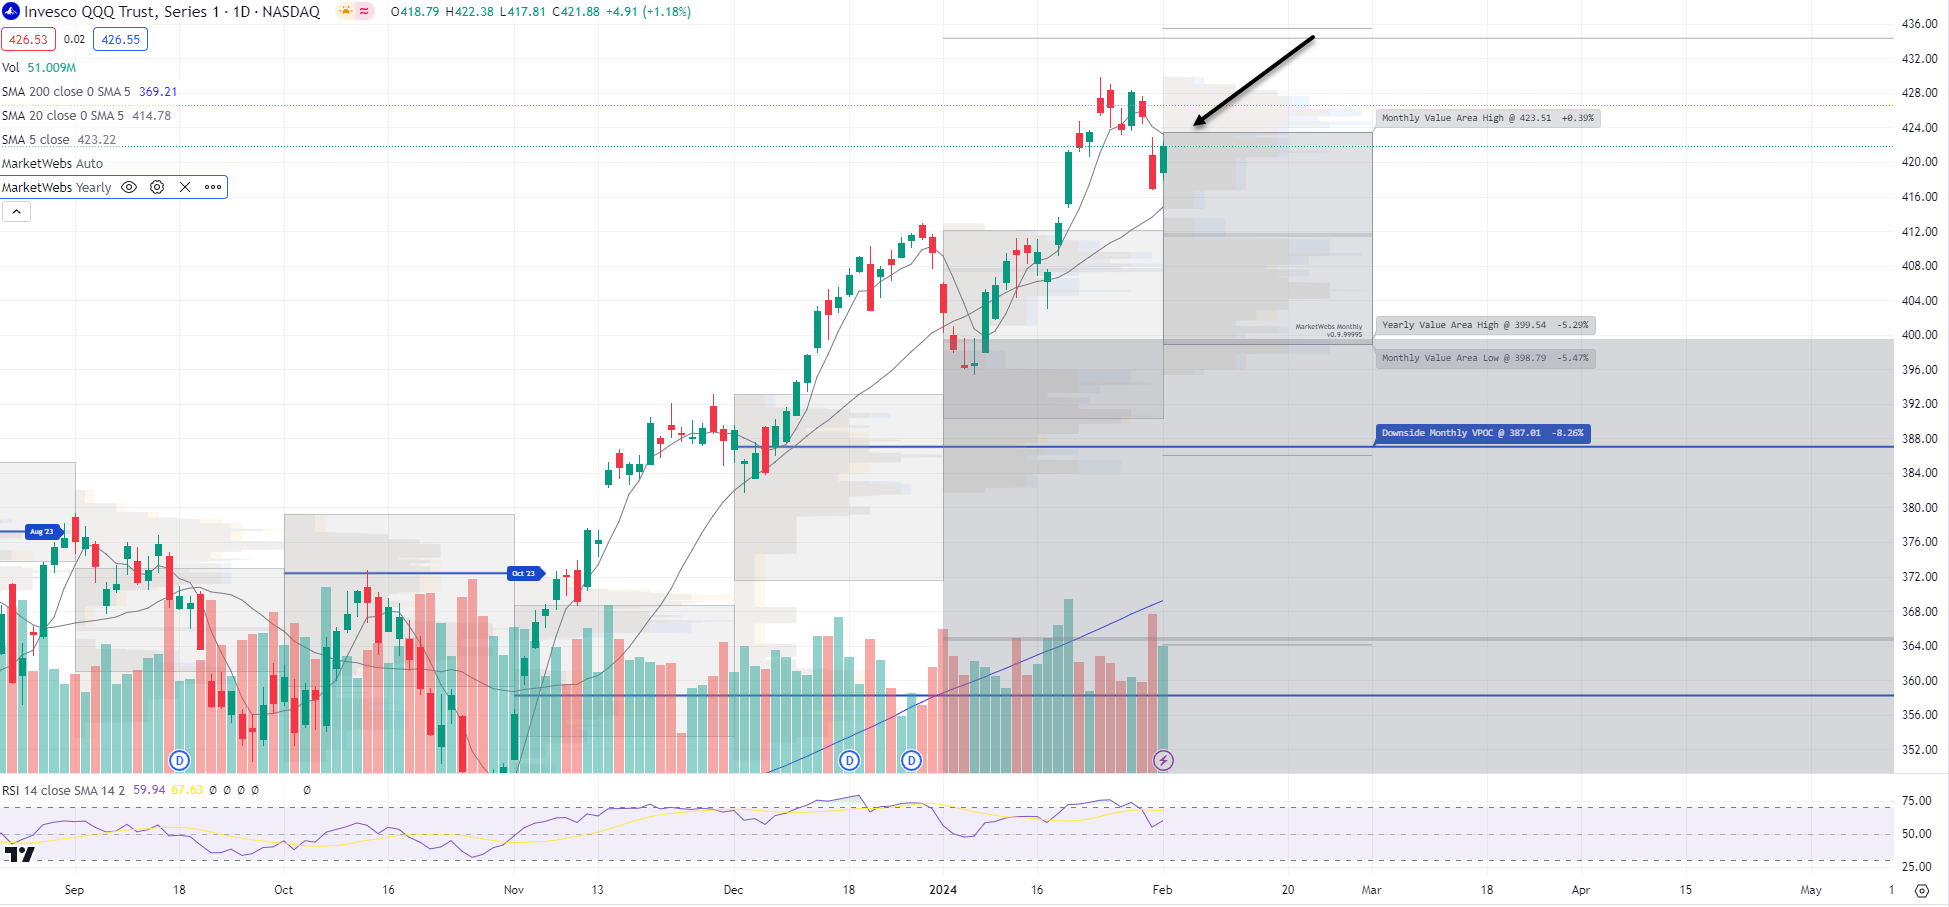
QQQ - NDX 100 ETF - Daily chart: Price ind. +1.0% and that should get price above its Feb Value Area & its 5d MA (but not yet to new highs), if price can maintain the gains, that would trigger a #bullish signal for the month (above its Value Area)
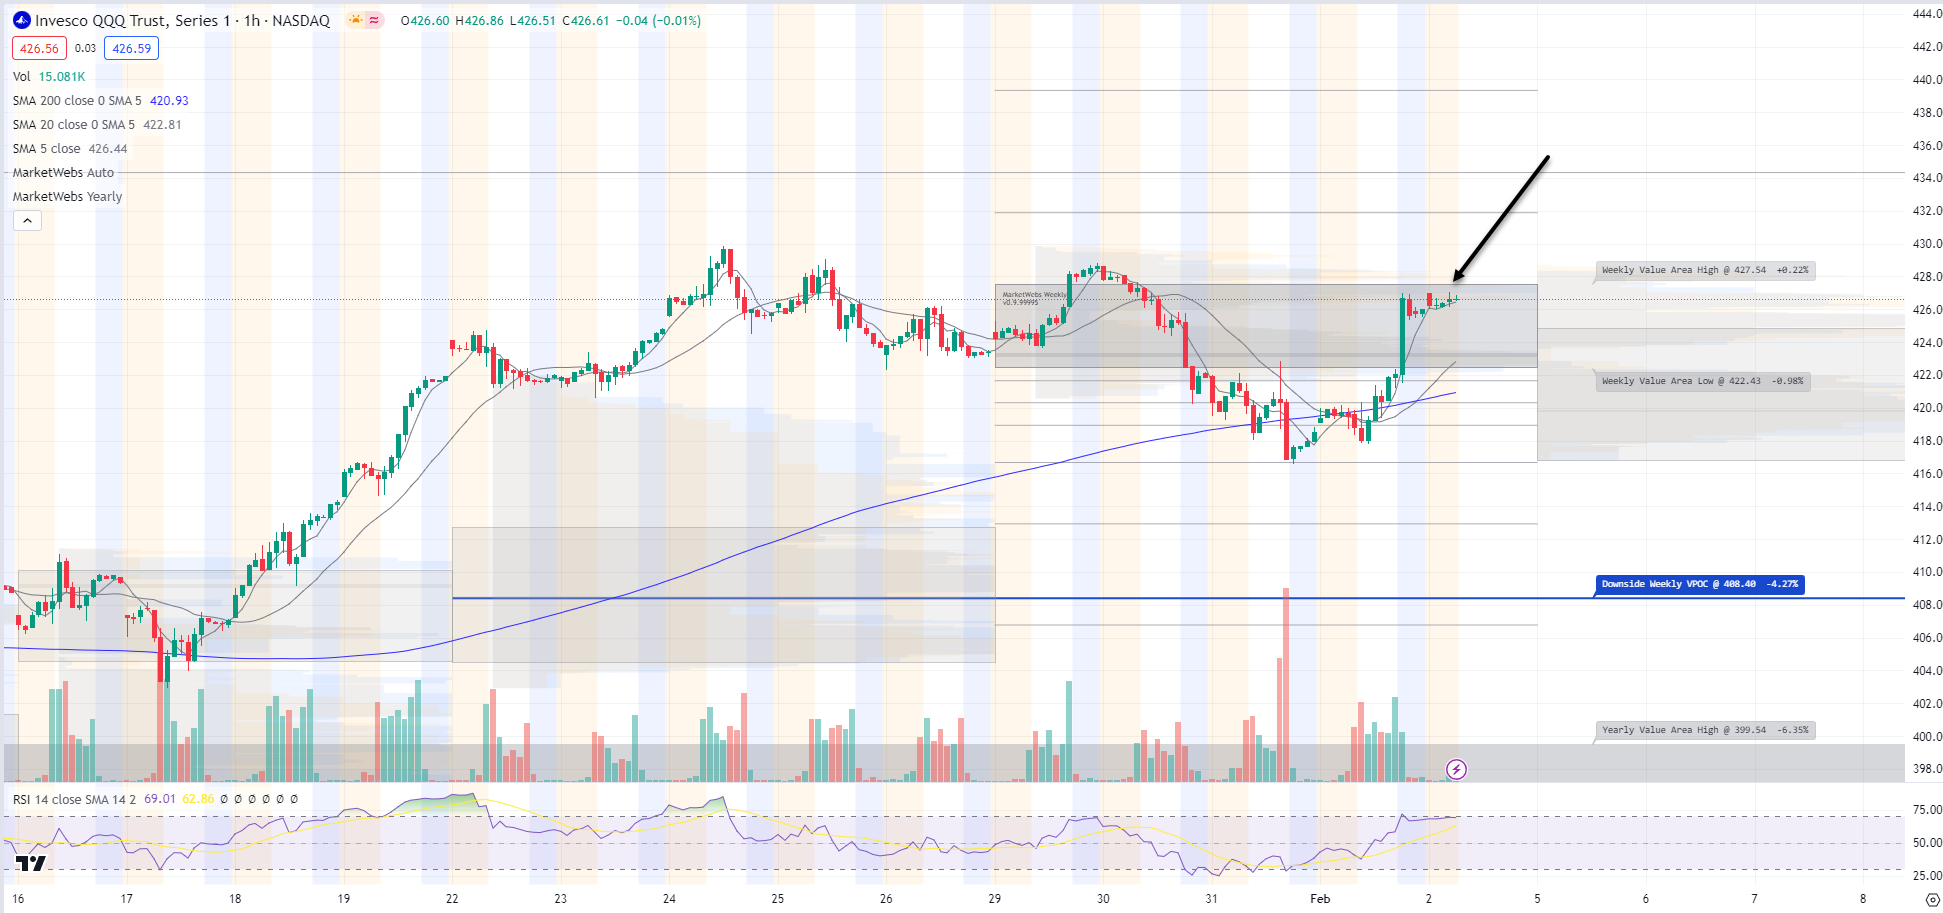
1hr chart: Also notable is that price is still inside its Value Area for the week, resistance to watch $427.54
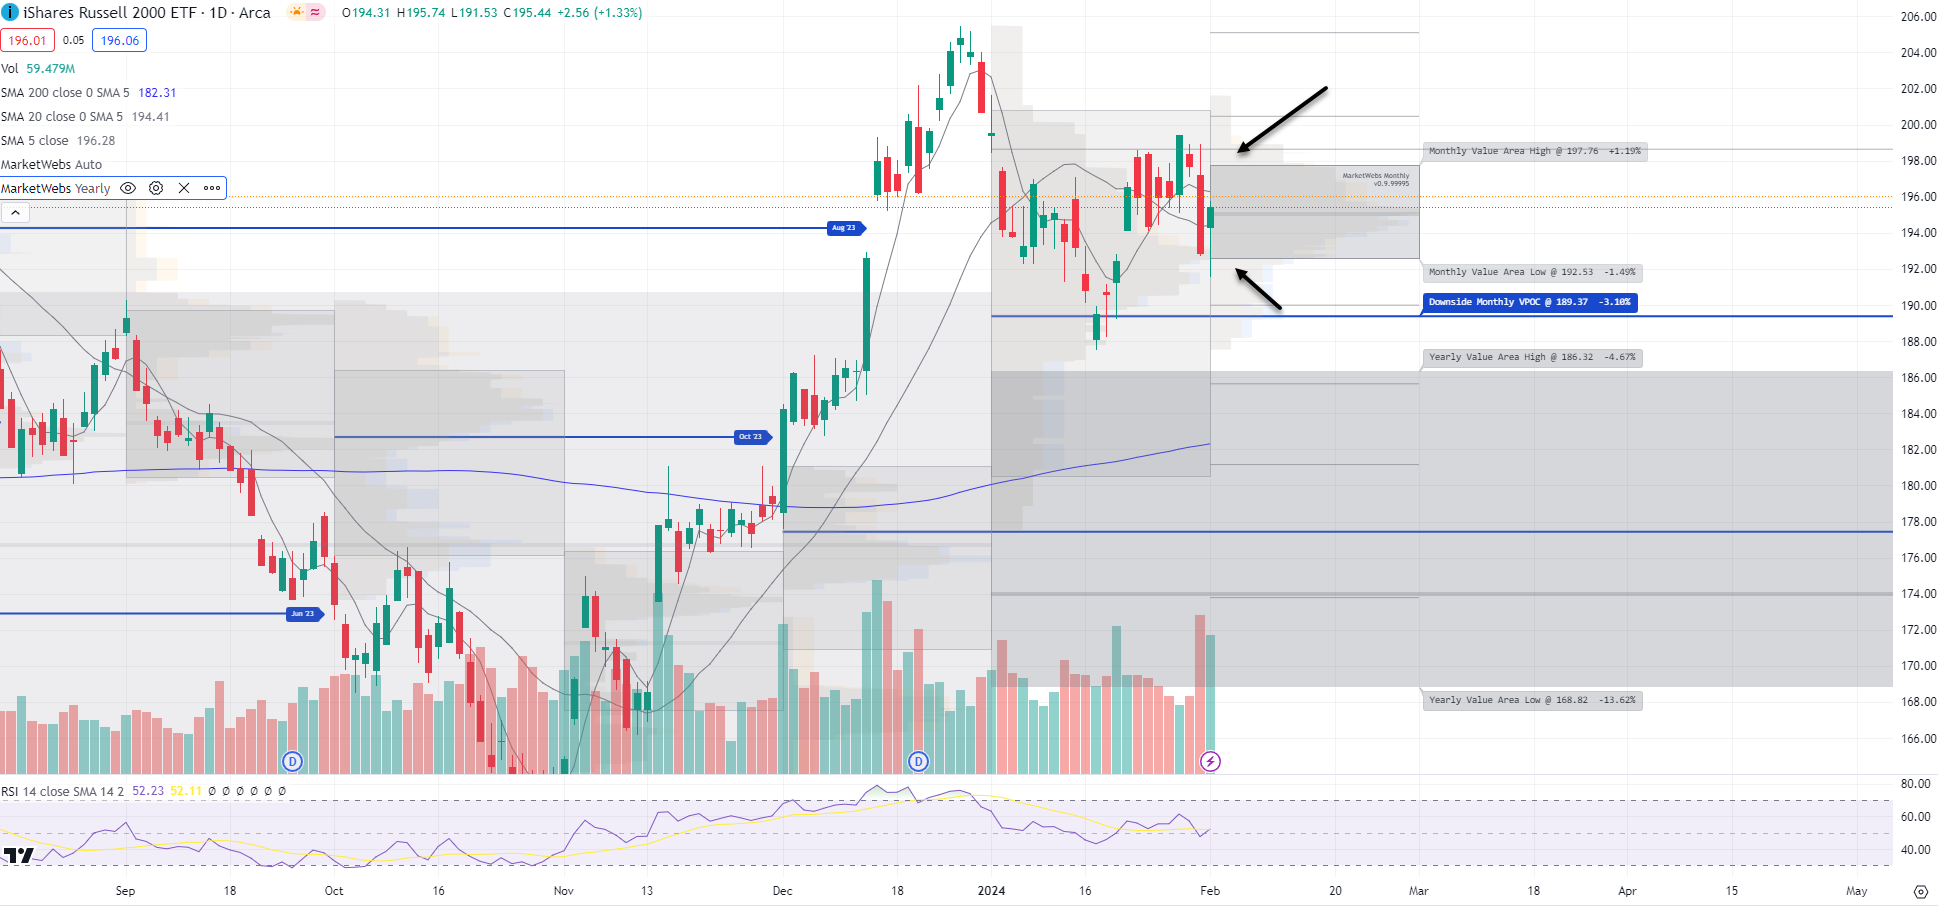
IWM - Russell Small Cap ETF- Price ind. +0.2% and is right in the middle of its Feb Value Area indicating range bound / sideways for now
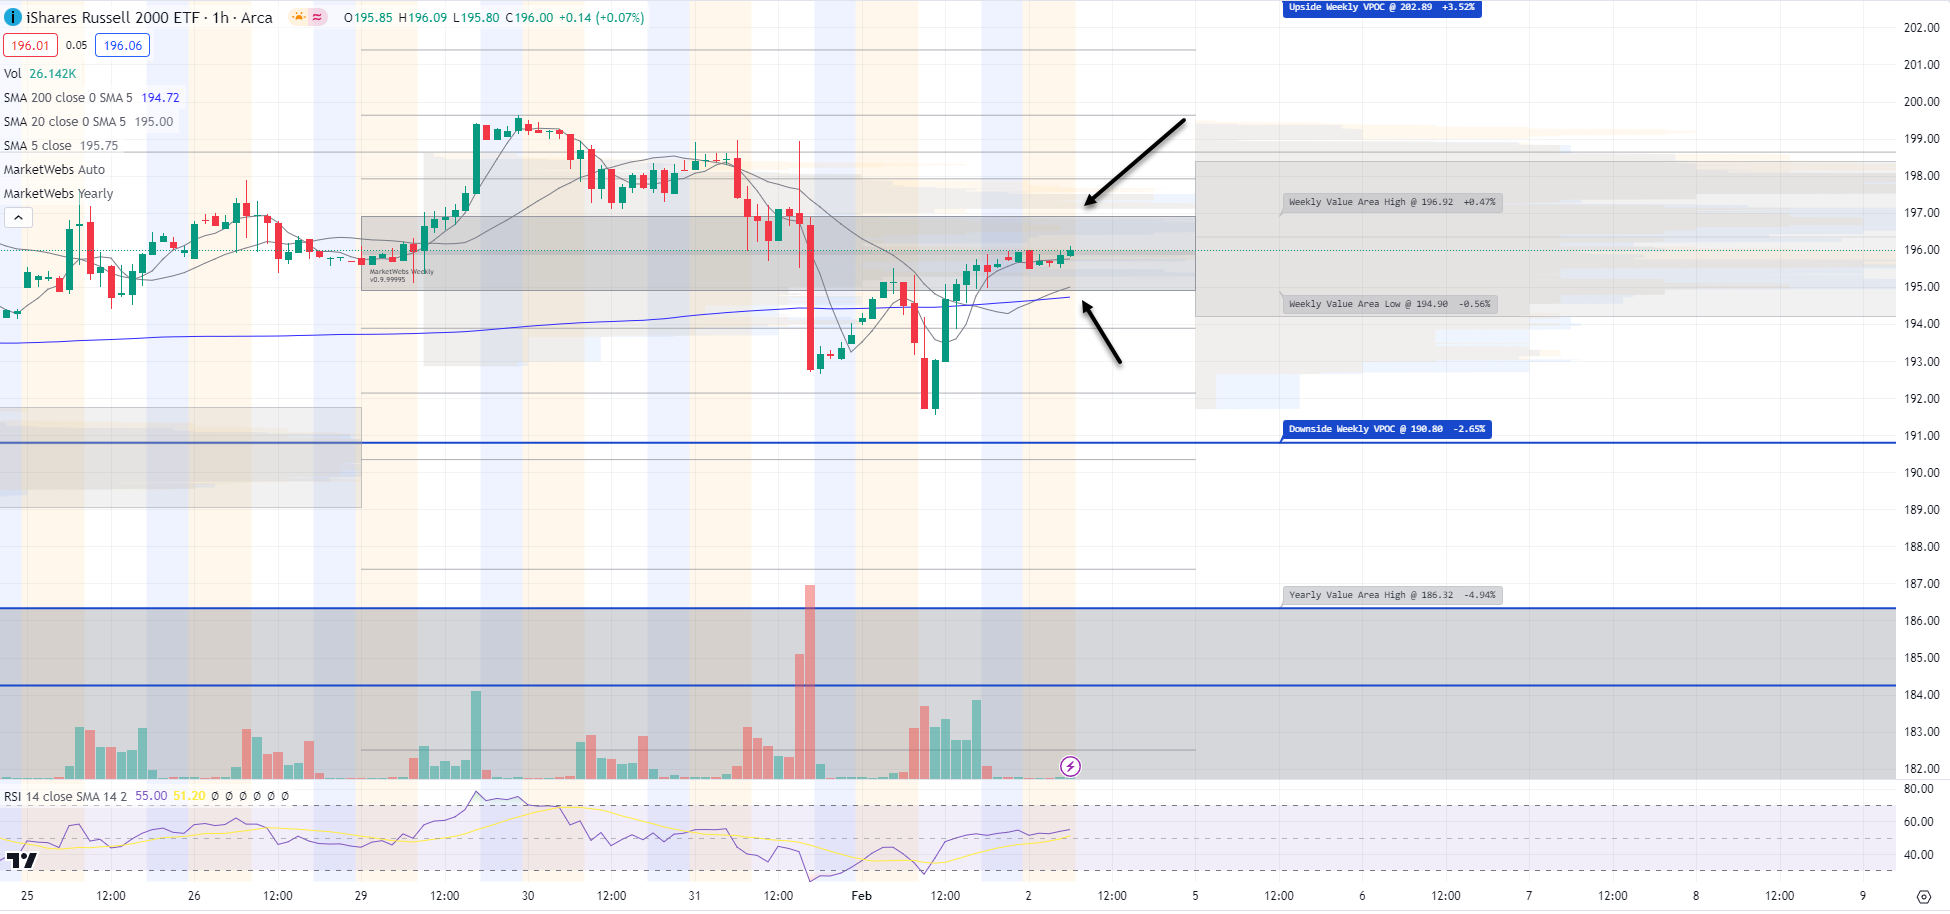
1hr chart: Price also inside its Value Area for the week so range bound on multiple timeframes
Here is today’s TTG Proprietary Stock Screen “Out of the Box” using Volume At Price
names trending above their Value Areas (on 3 multiple timeframes & not super extended)
Keep reading with a 7-day free trial
Subscribe to The Tribeca Trade Group to keep reading this post and get 7 days of free access to the full post archives.