TTG Index Charts & Out of the Box Stock Screen 7/14/23 $AVT $APD
Out of the Box MarketWebs Screen
Index Updates
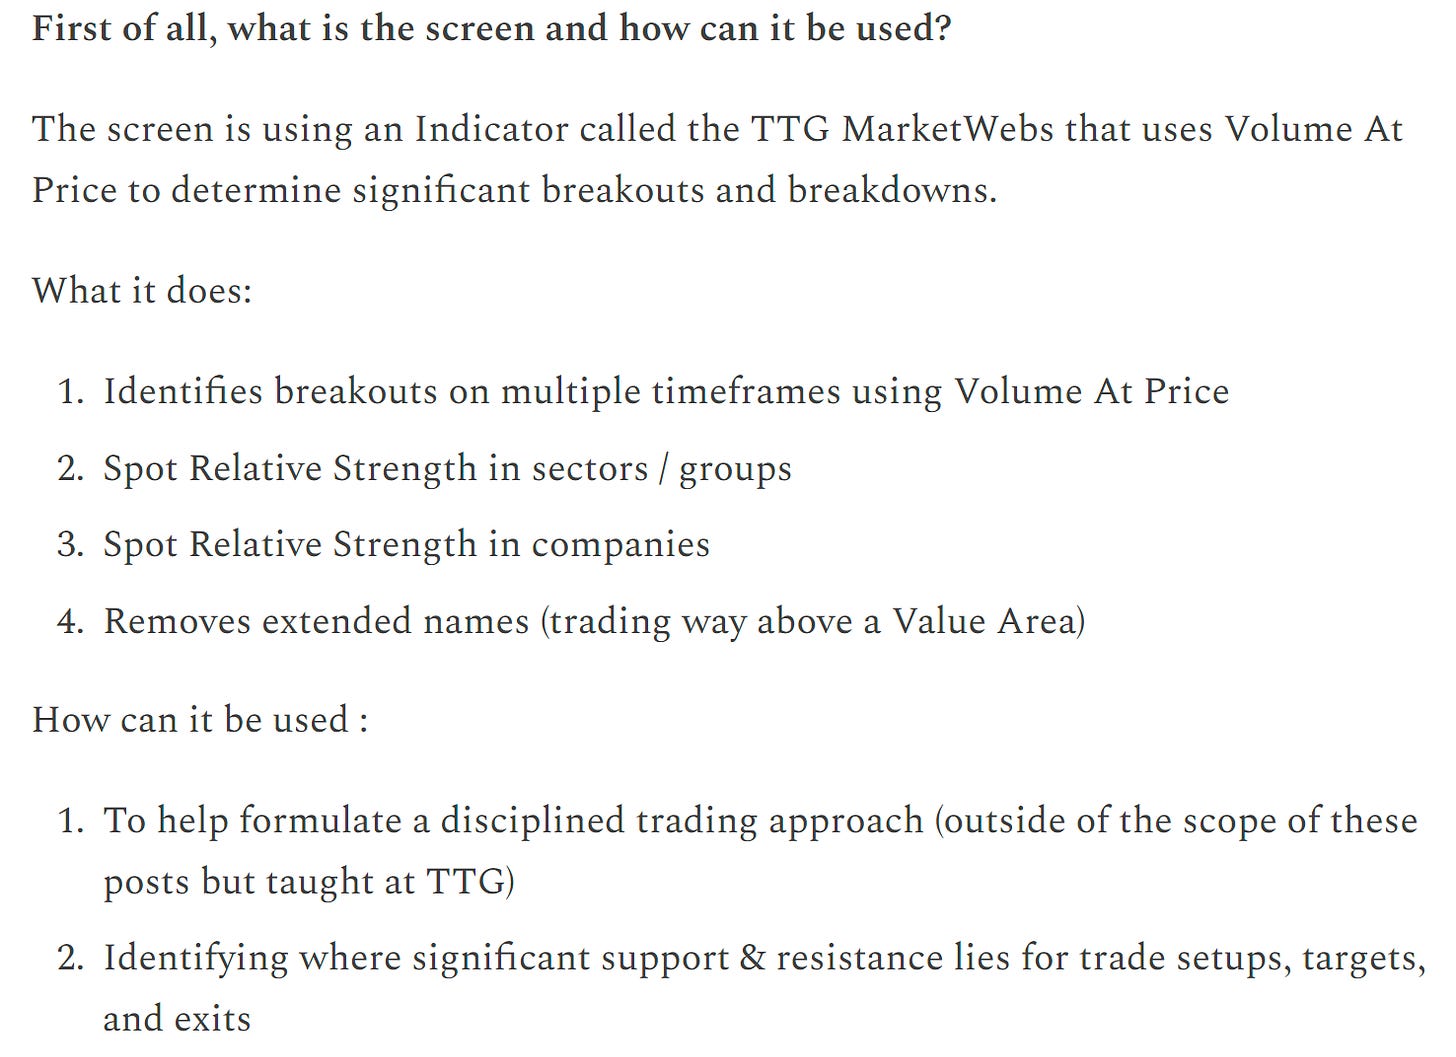
At TTG, I use Volume At Price in my chart analysis and I use the MarketWebs Indicator to provide Value Areas which indicate significant support & resistance levels. Learn More Here about Volume At Price and the MarketWebs.
US Dollar +0.1% / 30yr Bonds -0.1% / Crude -0.1% & Nat Gas +1.5% Copper -0.1% / Cryptos lower BTC -1.5%
Upcoming Economics
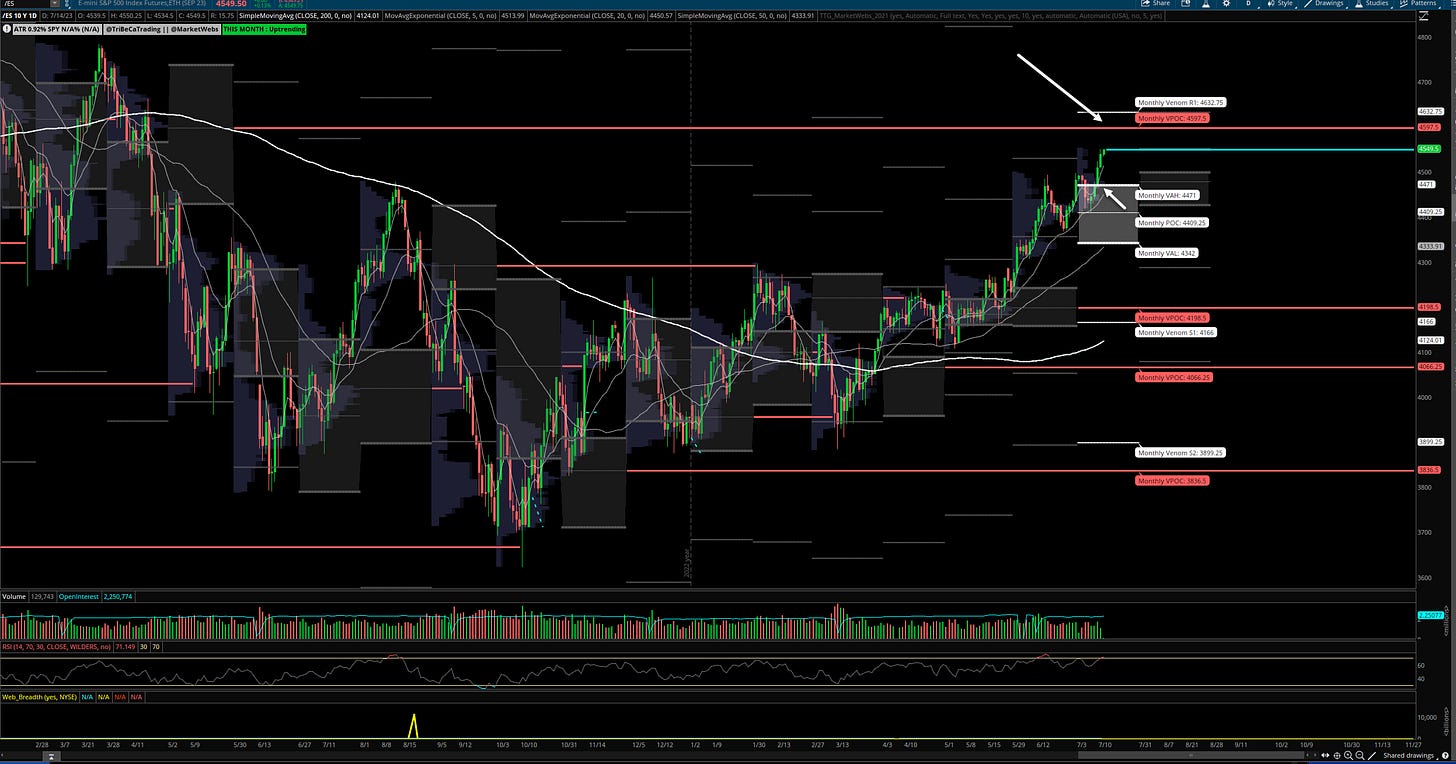
$ES_F - S&P futures - Daily chart: Daily chart: Impressive breakout of the July Value Area this week. Next upside level to target is 4597.5 VPOC (red line) / support is 4471
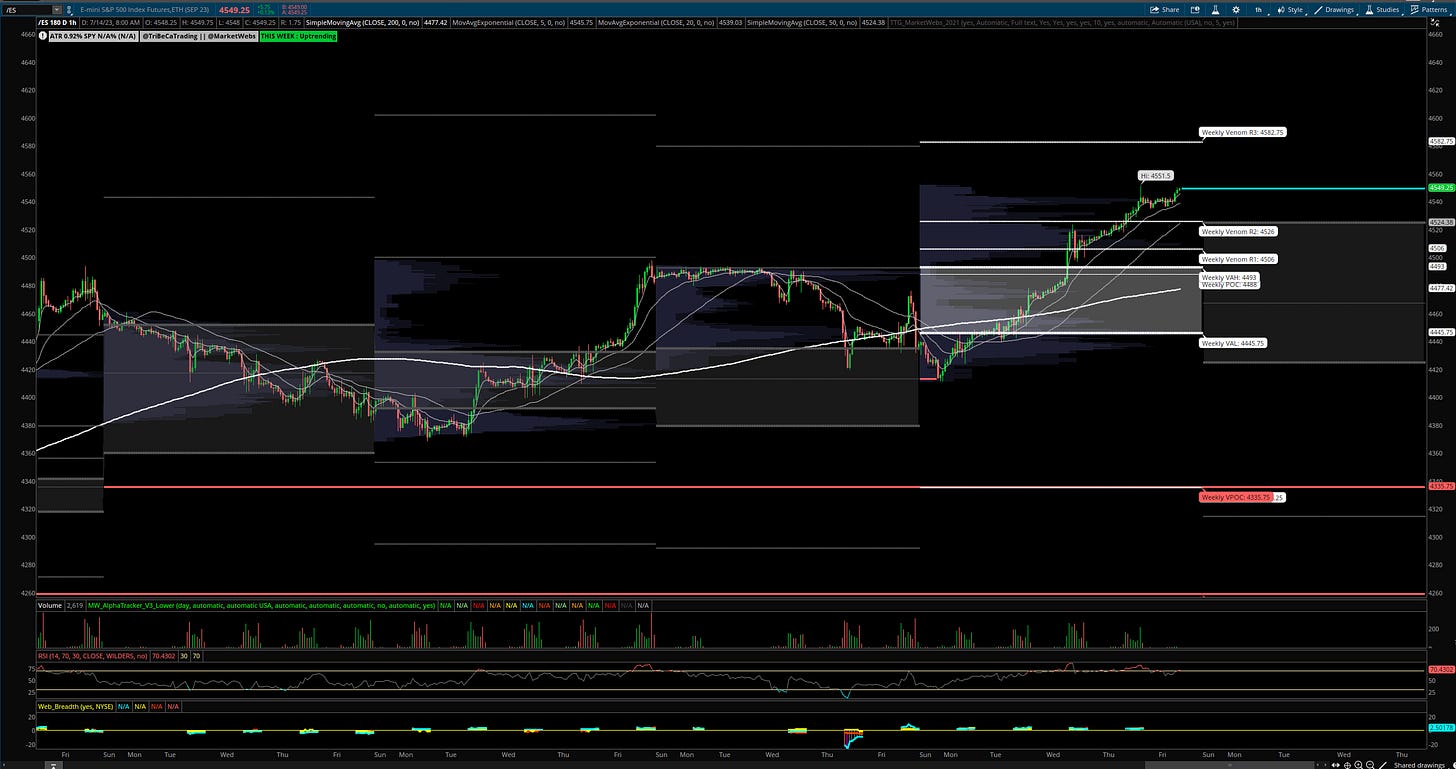
1hr chart: Price is above its Value Area for the week & trending
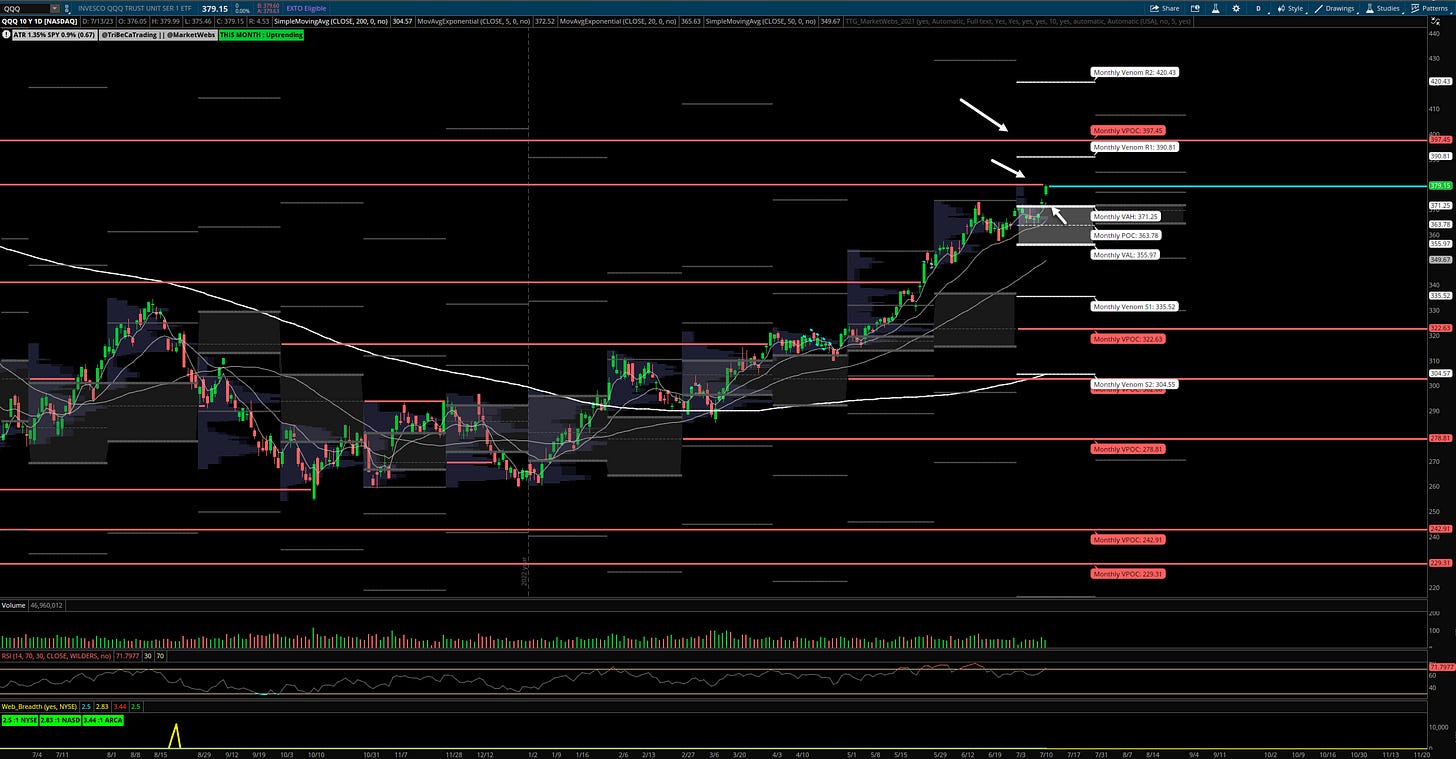
QQQ - NDX 100 ETF - Daily chart: Big move for the QQQs yesterday +1.7% and upside VPOC (red line) taken out. A logical place for digestion / consolidation but this market has momentum right now, keep an eye on $397.45
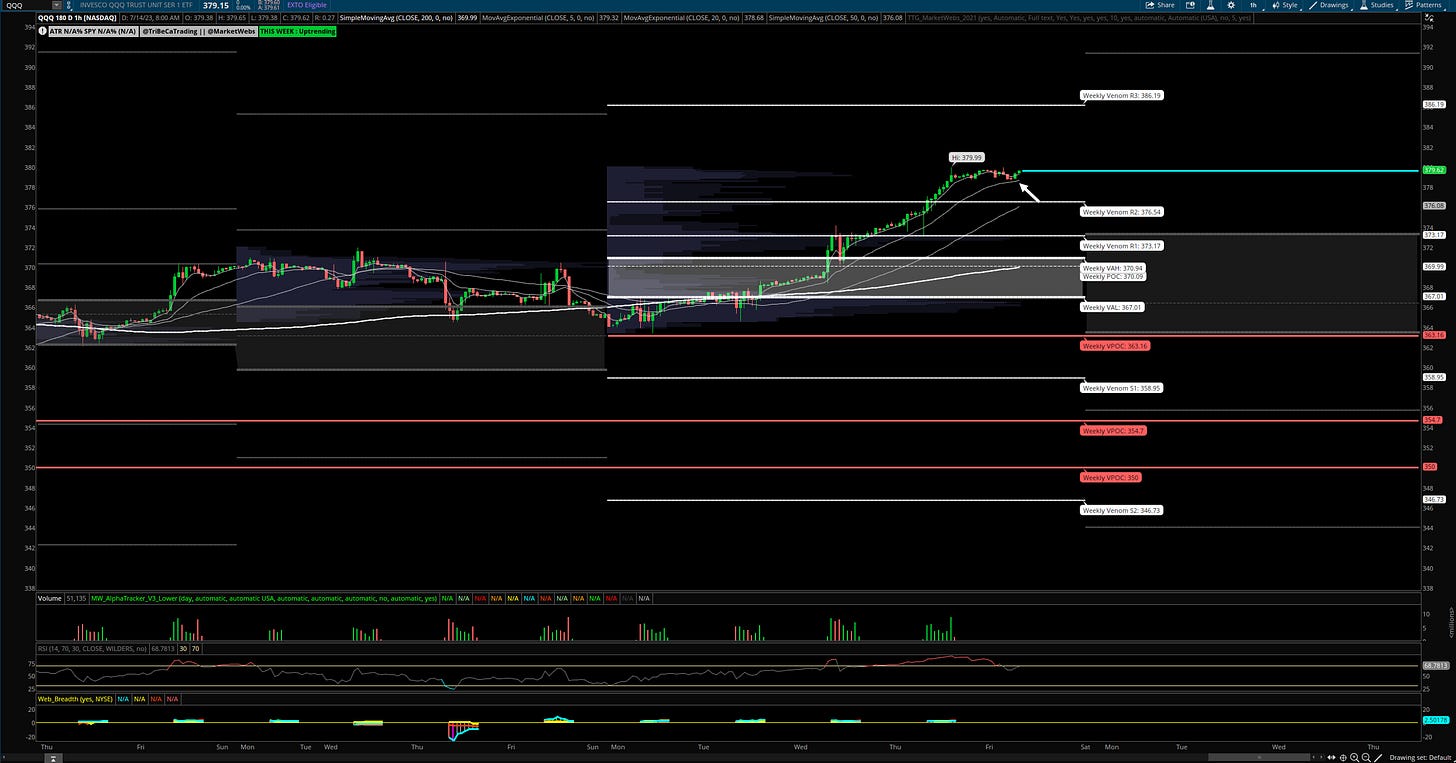
1hr chart: Price continues to trend above value and short term MAs
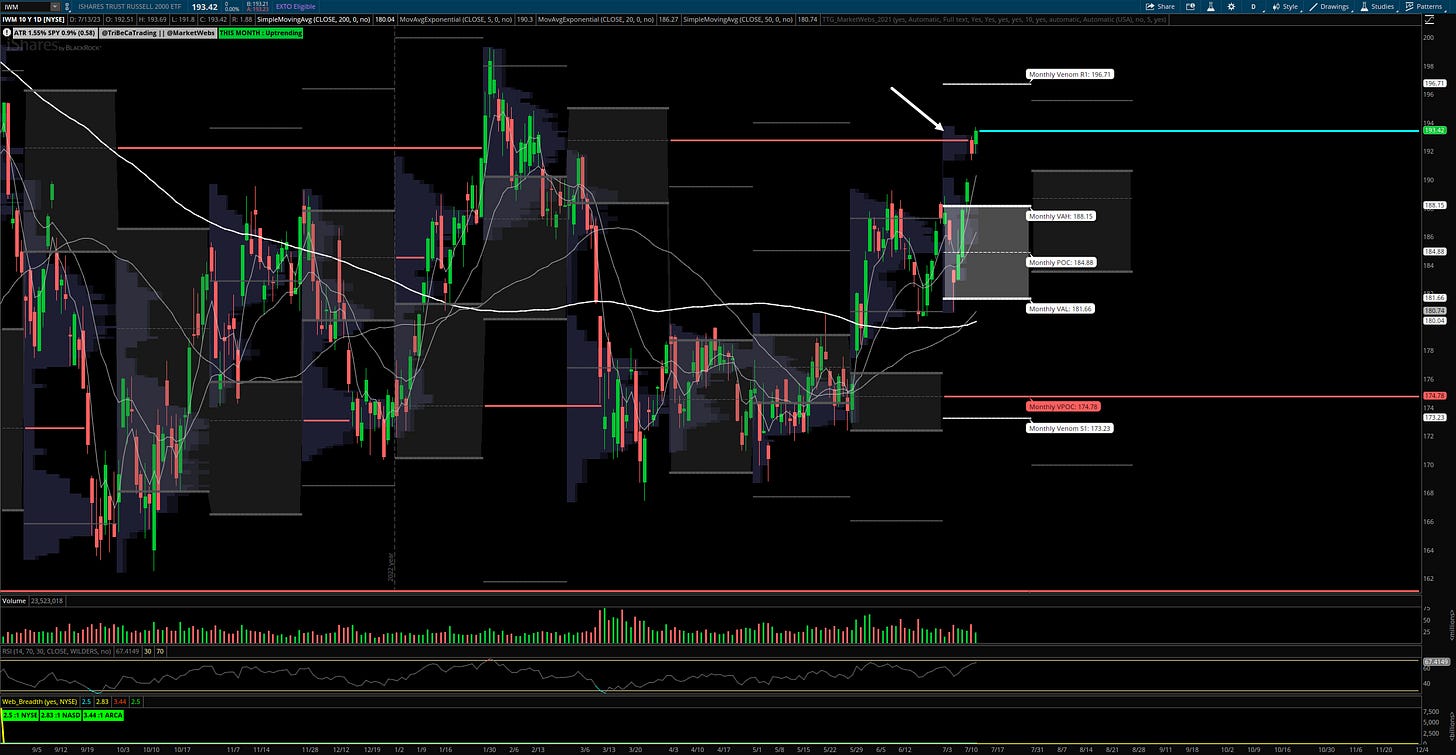
IWM- Russell Small Cap ETF- Daily Chart: Price took out an upside VPOC on Wed and is hanging around this $192.8 level which I think will be important to see price stay above, if price fails here than supply is greater than demand at a big previous volume area
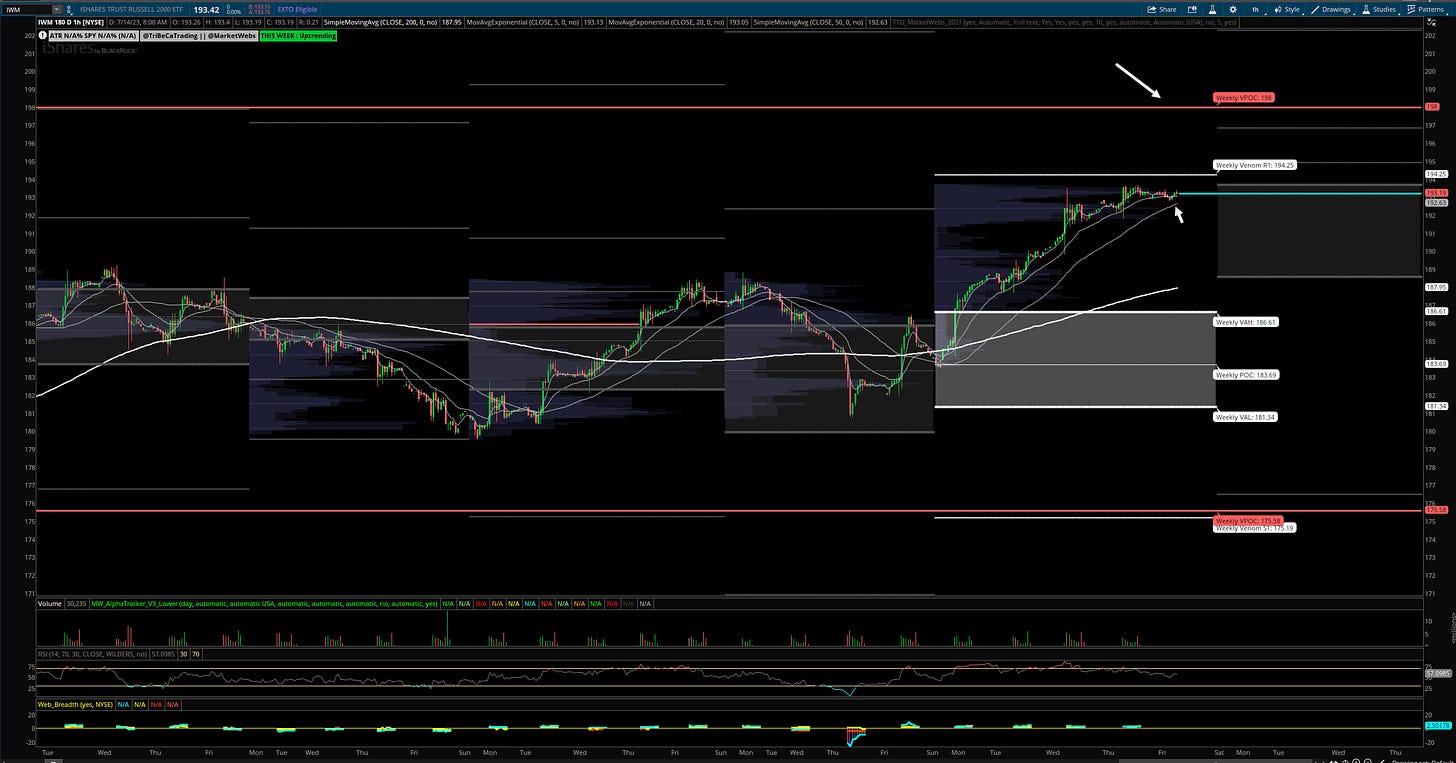
1hr chart: 1hr chart: Price pausing a little , watch the short term MAs for a clue on direction and if price can continue higher, watch $198 VPOC (red line)
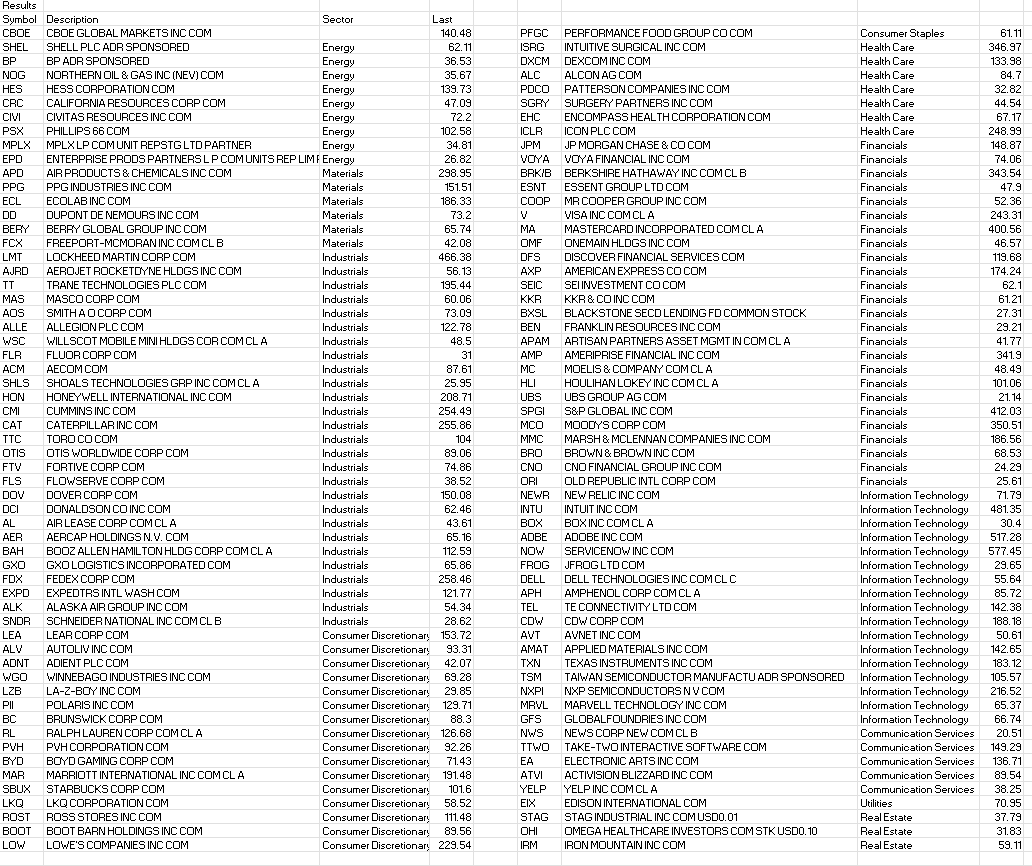
Here is today’s TTG Proprietary Stock Screen “Out of the Box” using Volume At Price
Remember, I am only showing a few setups from the list here and review more in the TTG Trading Room. I provide a more detailed watchlist every weekend to start the week at TTG.
Charts
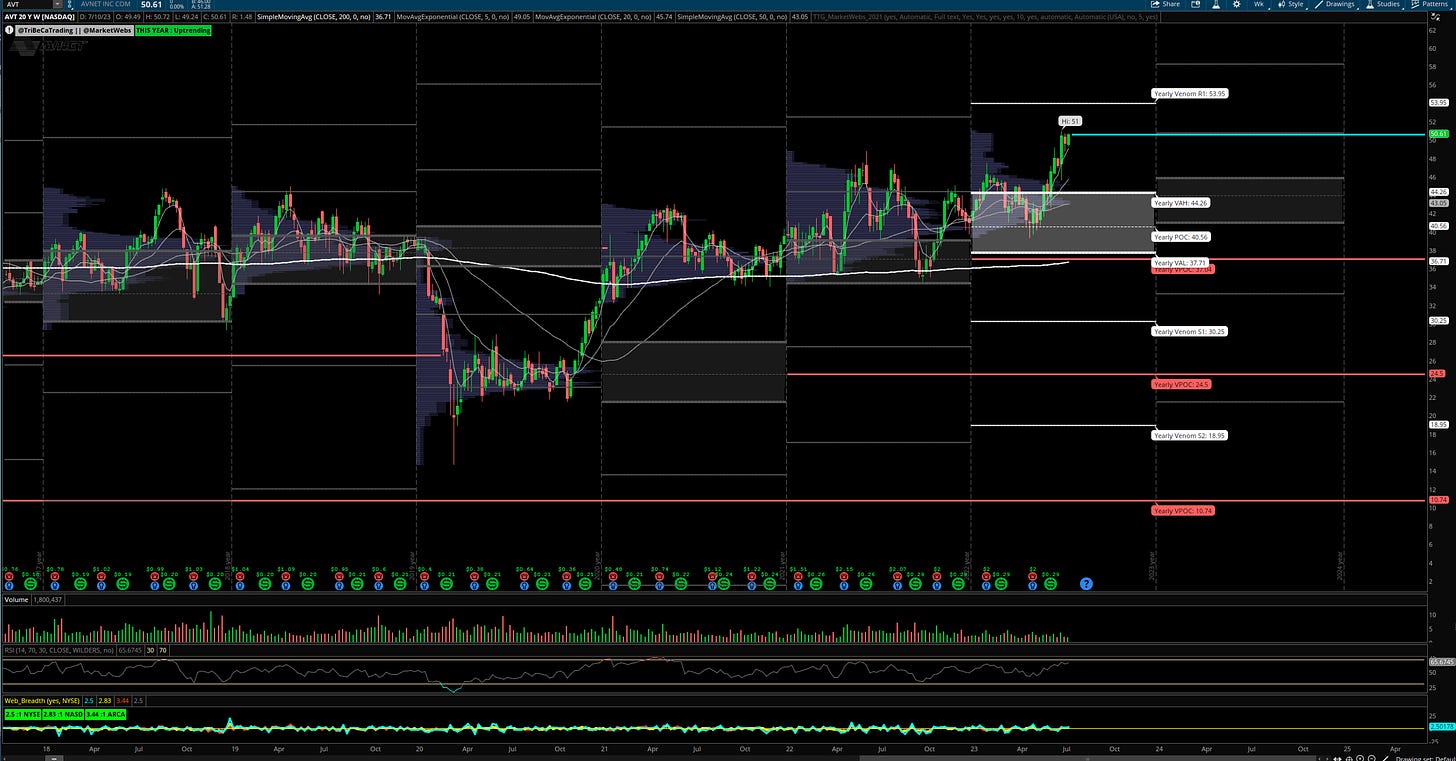
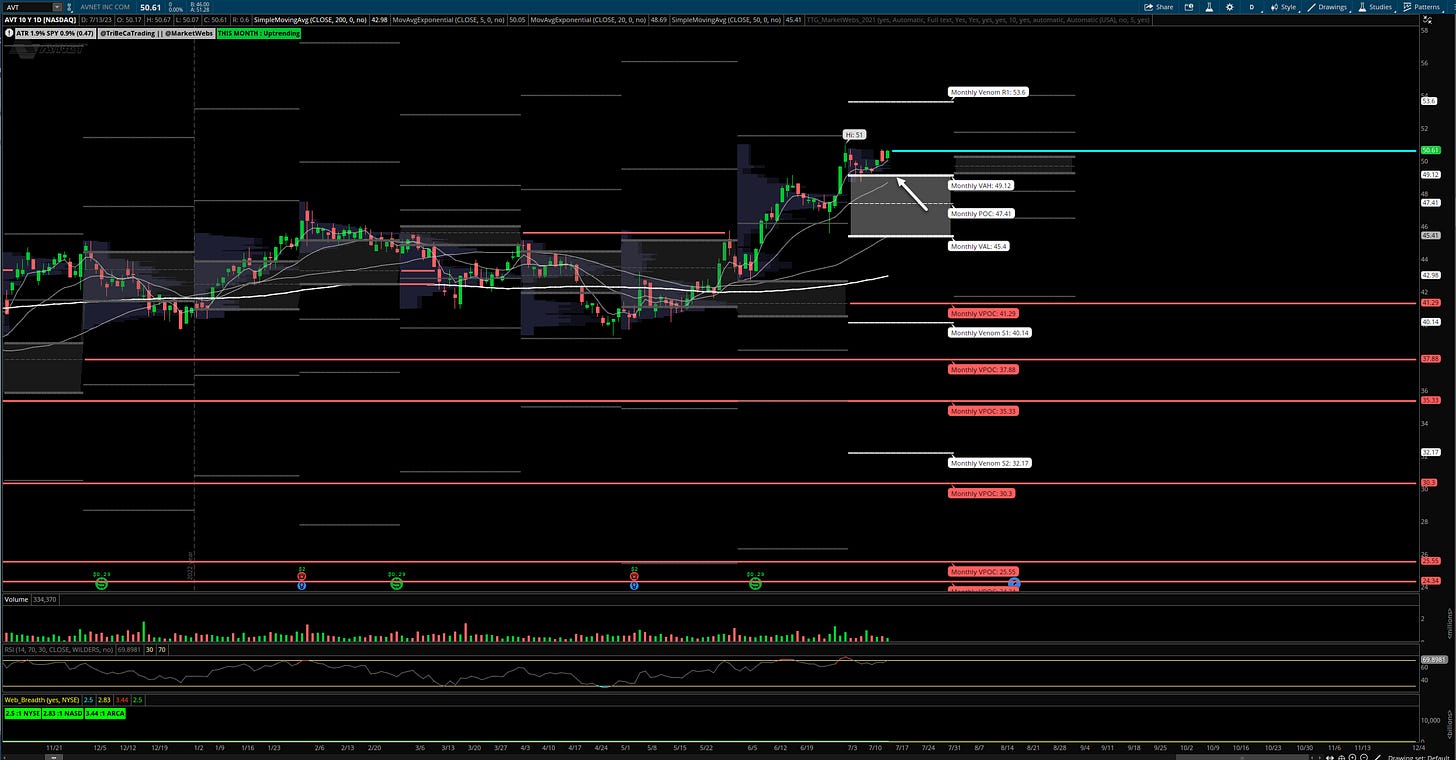
AVT Weekly & Daily chart
Avnet, Inc. distributes computer products and semiconductors, as well as interconnect, passive, and electromechanical components. The Company markets and distributes these products and provides supply-chain integration, engineering design, and technical services. Avnet serves customers in countries around the world. (Bloomberg)
-suggested stop price $49 the TTG MarketWebs
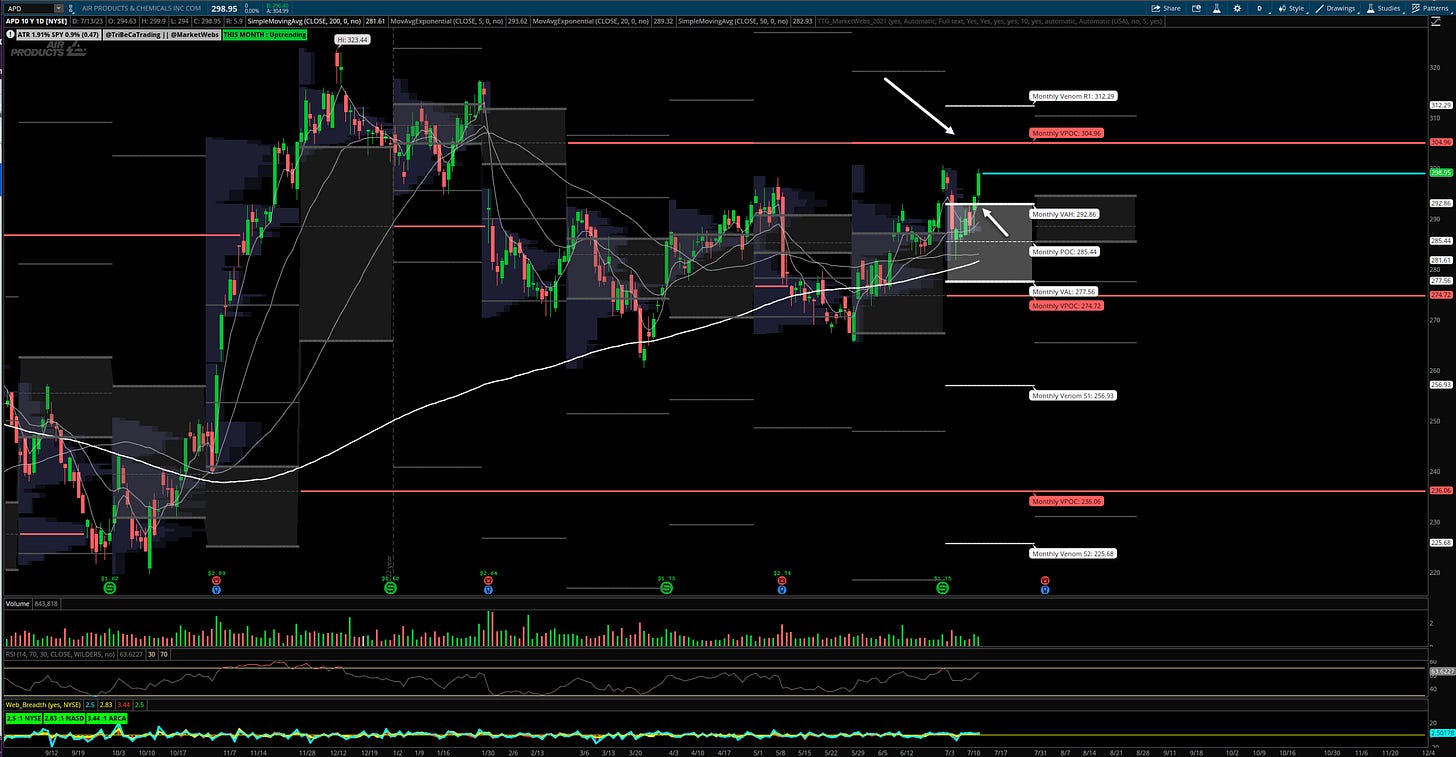
APD Weekly & Daily chart
Air Products and Chemicals, Inc. produces industrial atmospheric and specialty gases and performance materials and equipment. The Company's products include oxygen, nitrogen, argon, helium, specialty surfactants and amines, polyurethane, epoxy curatives, and resins. Air Products and Chemicals products are used in the beverage, health, and semiconductors fields. (Bloomberg)
-suggested stop price $292 the TTG MarketWebs
- note the call sizable call buyer yesterday:
>> 1339 APD Aug23 300 Calls $8.198 Above Ask! [MULTI] 13:49:45.293 IV=22.2% Delta=50%, Impact=67k/$20.0m,APD=297.85 Ref, OI=155 Premium=$1.10m
Remember, this is just one type of screen / setup that I focus on in my analysis!
Copyright © Tribeca Trade Group. All of the information in this newsletter is for entertainment and educational purposes only and is not to be construed as investment or trading advice. None of the information in this newsletter is guaranteed to be accurate, complete, useful or timely. IMPORTANT NOTICES AND DISCLAIMERS TriBeCa Trade Group is not an investment advisor and is not registered with the U.S. Securities and Exchange Commission or the Financial Industry Regulatory Authority. Further, owners, employees, agents or representatives of TriBeCa Trade Group are not acting as investment advisors and might not be registered with the U.S. Securities Authority


