

TTG Index Charts & Out of the Box Stock Screen 4/24/24 $PANW $SQSP
TTG Index Charts & Out of the Box Stock Screen 4/24/24 $PANW $SQSP
Out of the Box MarketWebs Screen
US Dollar +0.2% / 30yr Bonds -0.5% / Crude -0.4% & Nat Gas -1.3% / Gold -0.6% / Copper +0.7% / BTC +0.4%
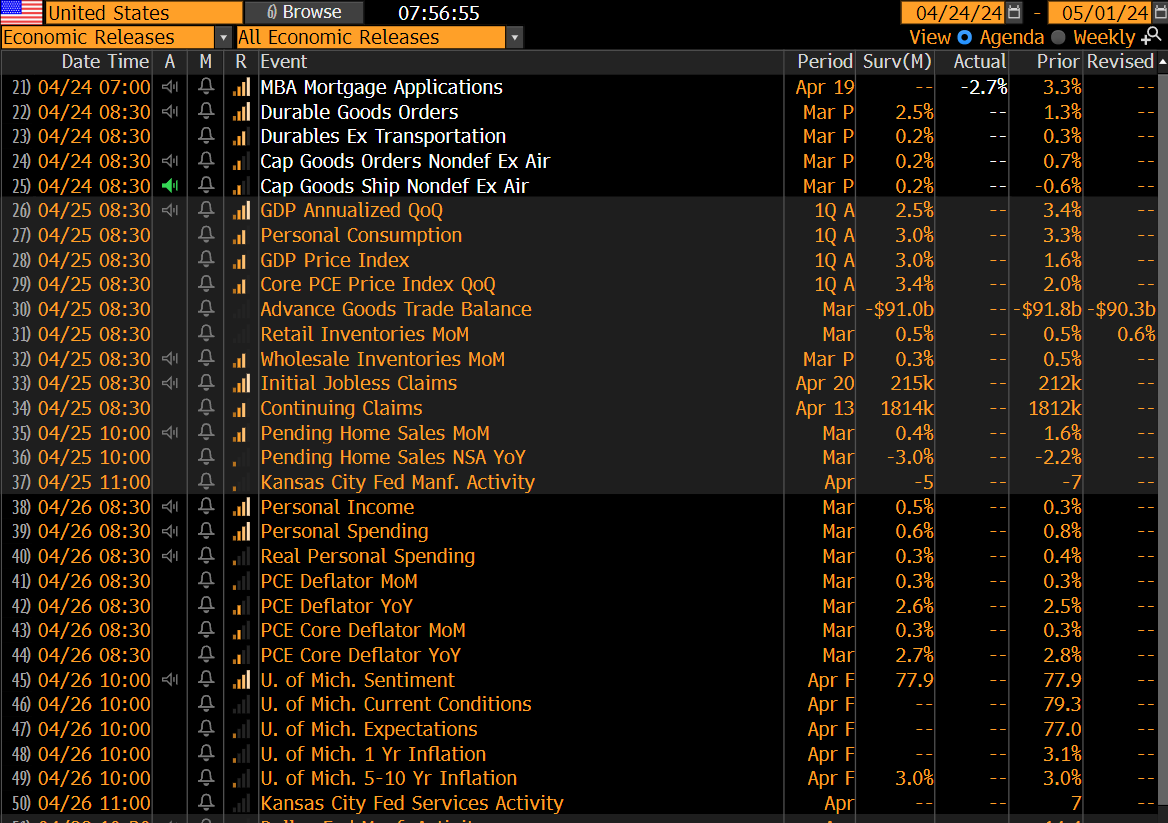
US Upcoming Economics
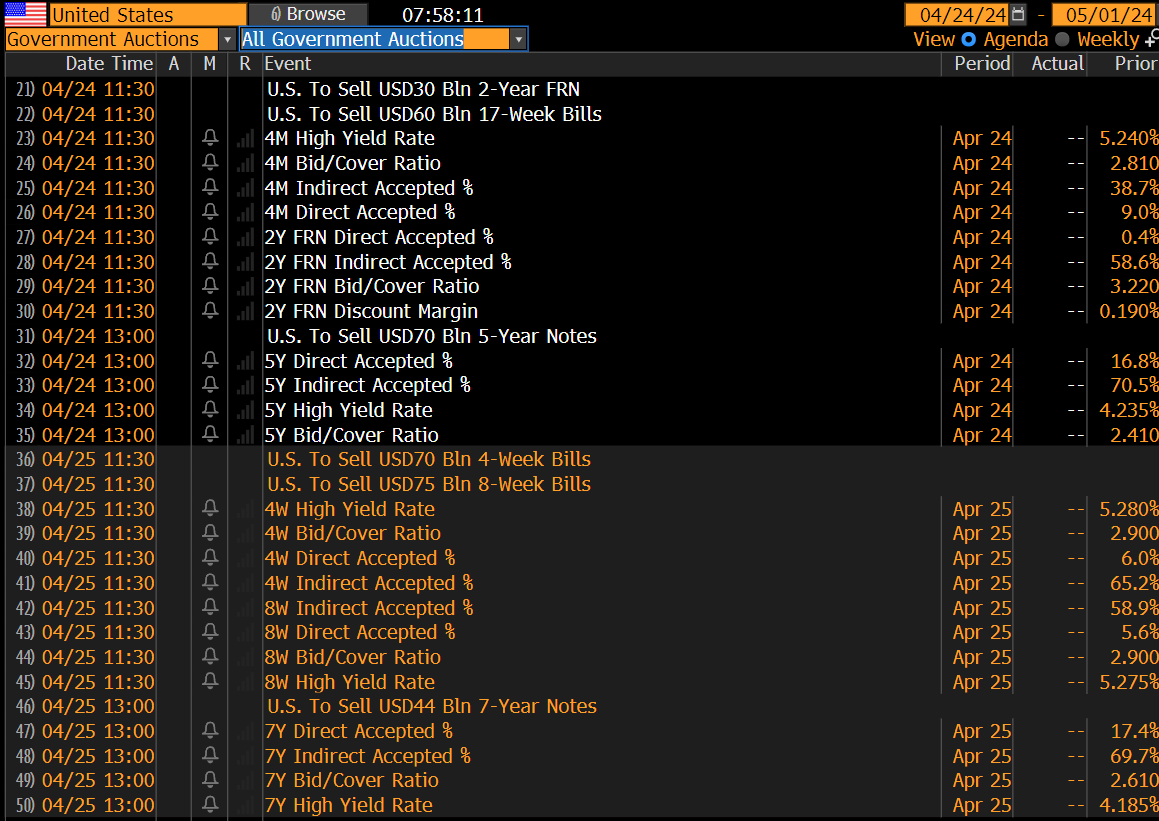
US Bond Yields & Upcoming Bond Auctions

Index Updates
At TTG, I use Volume At Price in my chart analysis and I use the MarketWebs Indicator to provide Value Areas & VPOCs which indicate significant support & resistance levels. Learn More Here about Volume At Price and the MarketWebs.

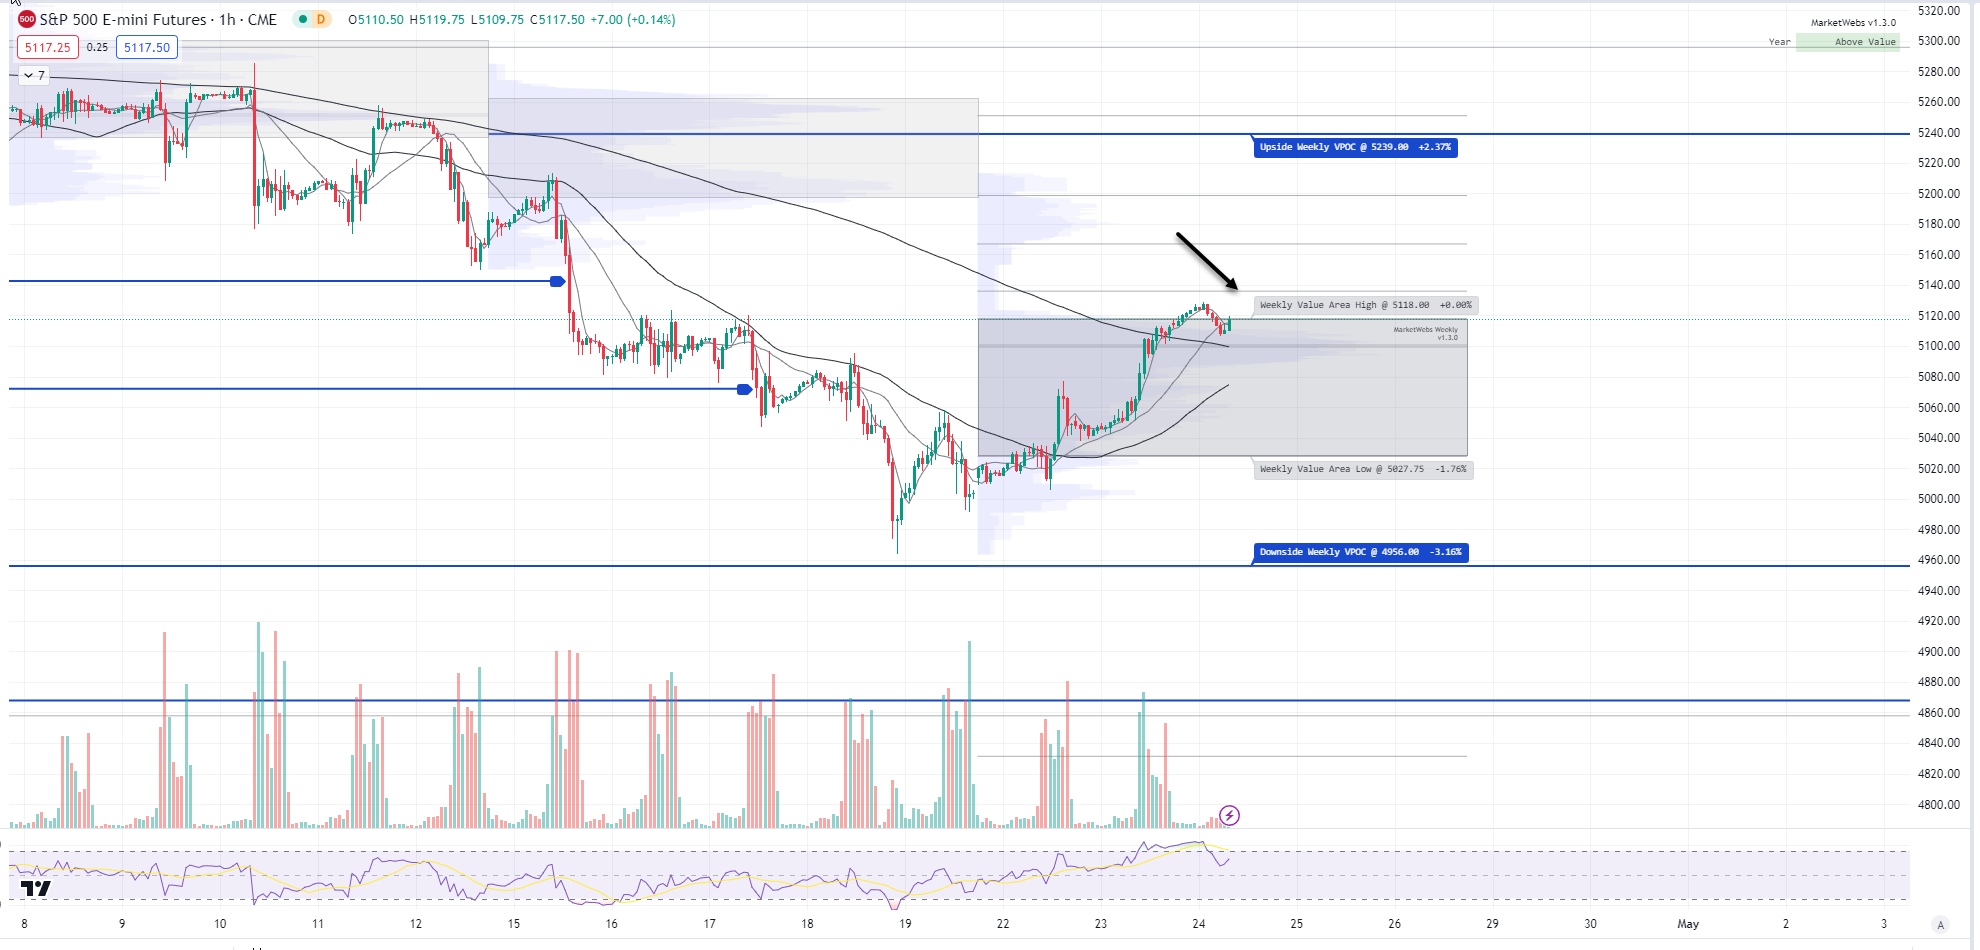
ES_F - SPX Futures - Daily chart: Price ind. +0.2% this morning, upside follow through and price is getting closer to that bottom of Apr Value Area (resistance) where price broke down on the 15th, level to watch here is 5157

1hr chart: The #Bullish 80% Rule is now complete as price traveled from one end of the Value Area to the other , the level for price to stay above is 5118
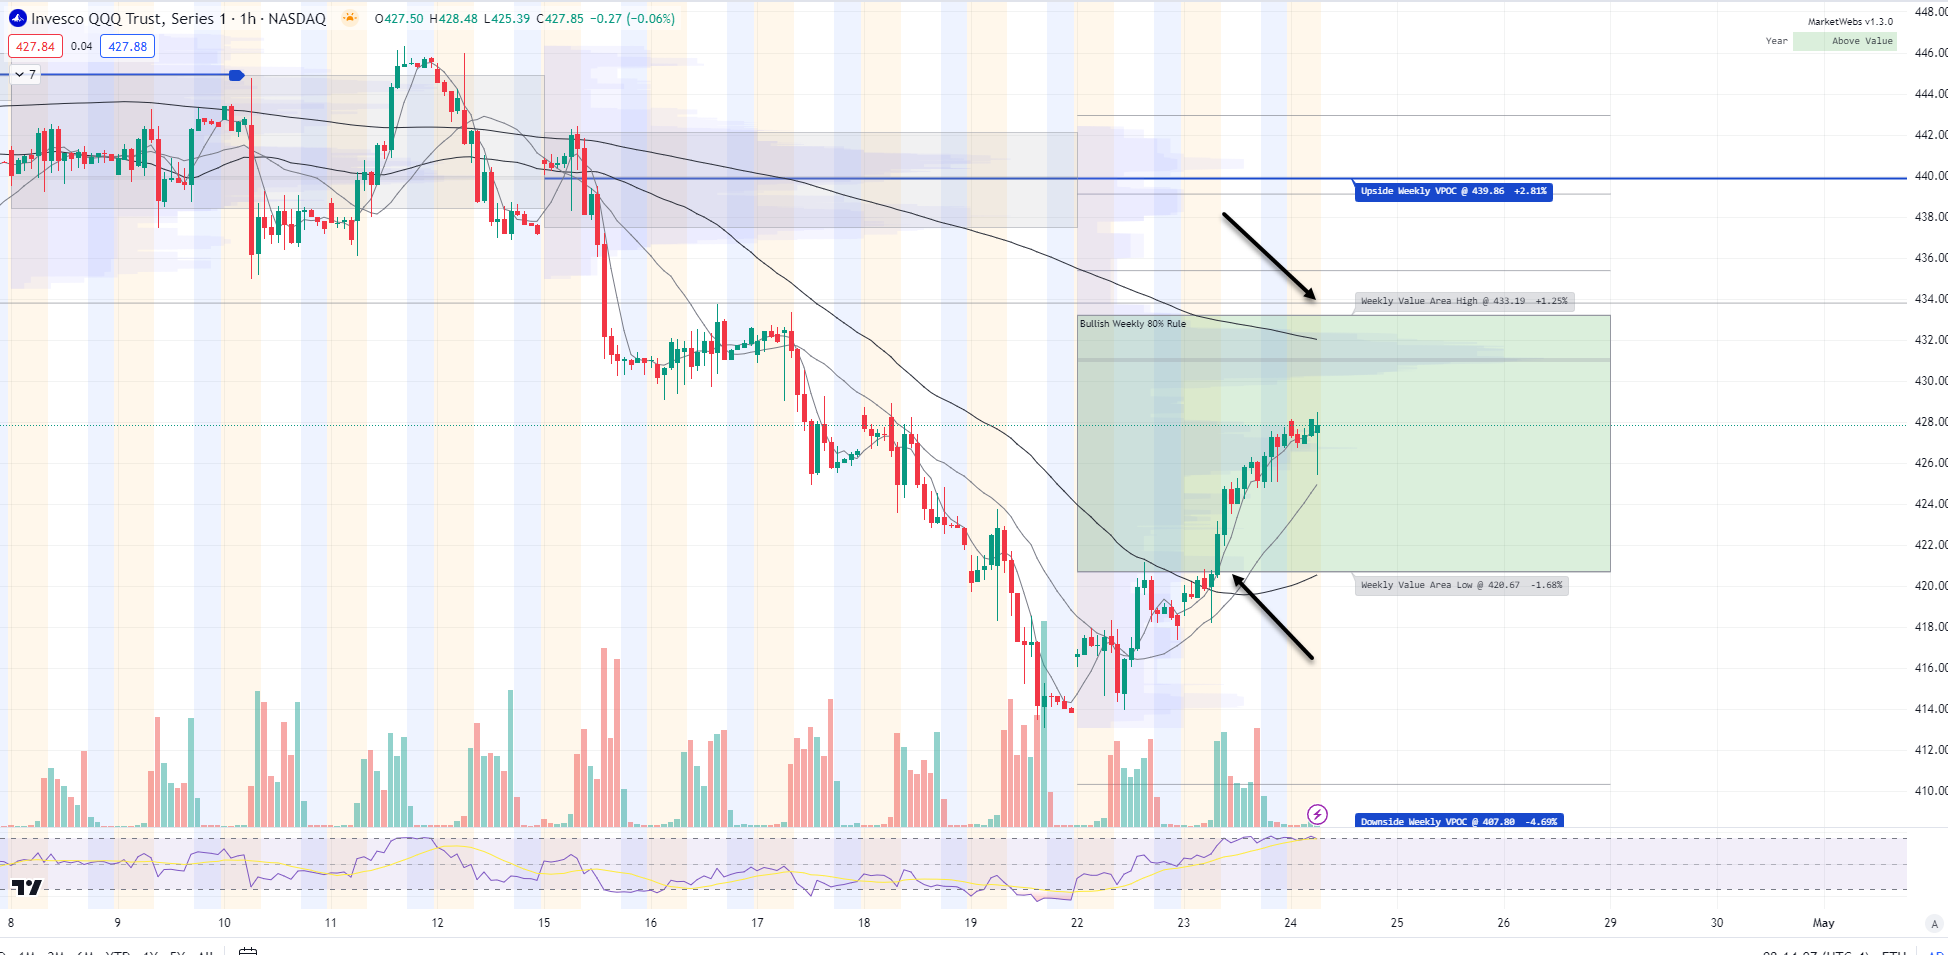
QQQ - NDX 100 ETF - Daily chart: Price ind. +0.6% outperforming this morning on the back of better than expected earnings reactions, i.e. TSLA TXN VRT BIIB . Price still has a decent way to go to overhead resistance , bottom of Apr Value Area $435.85
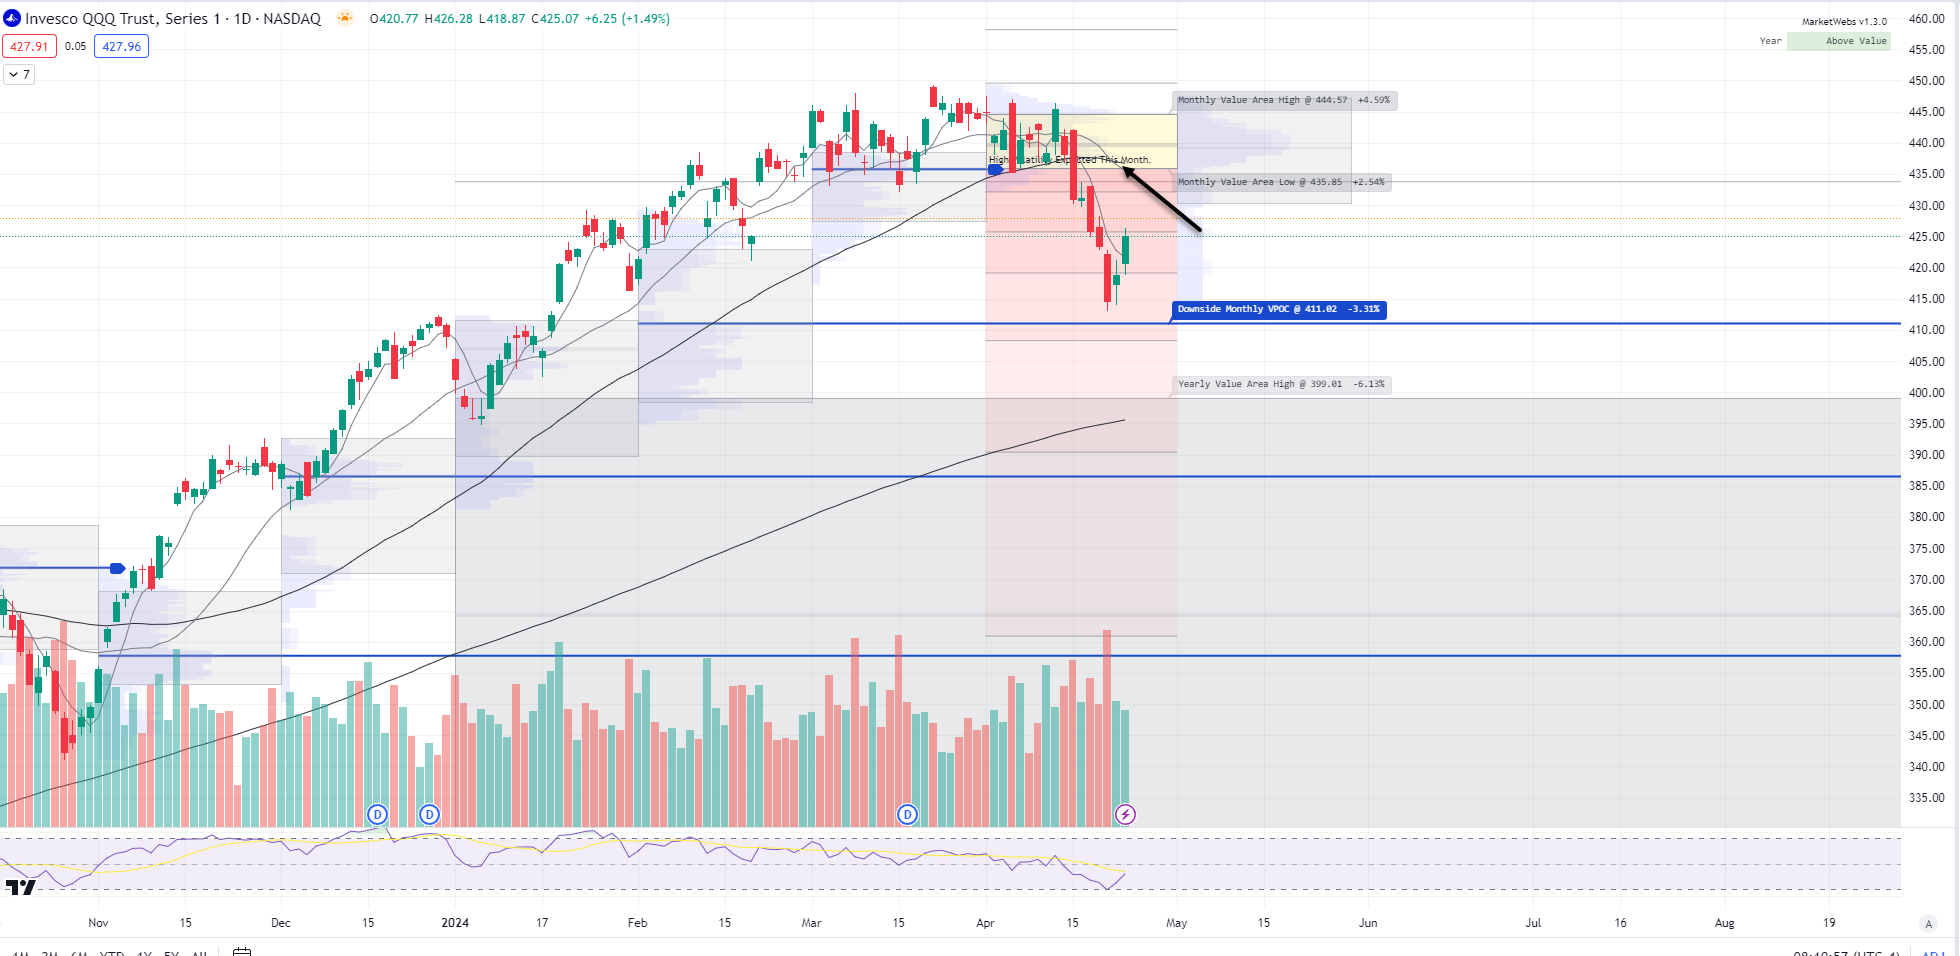
1hr chart: The #Bullish 80% rule is still in effect here for the week with resistance $433,19, ~ +1.2% away
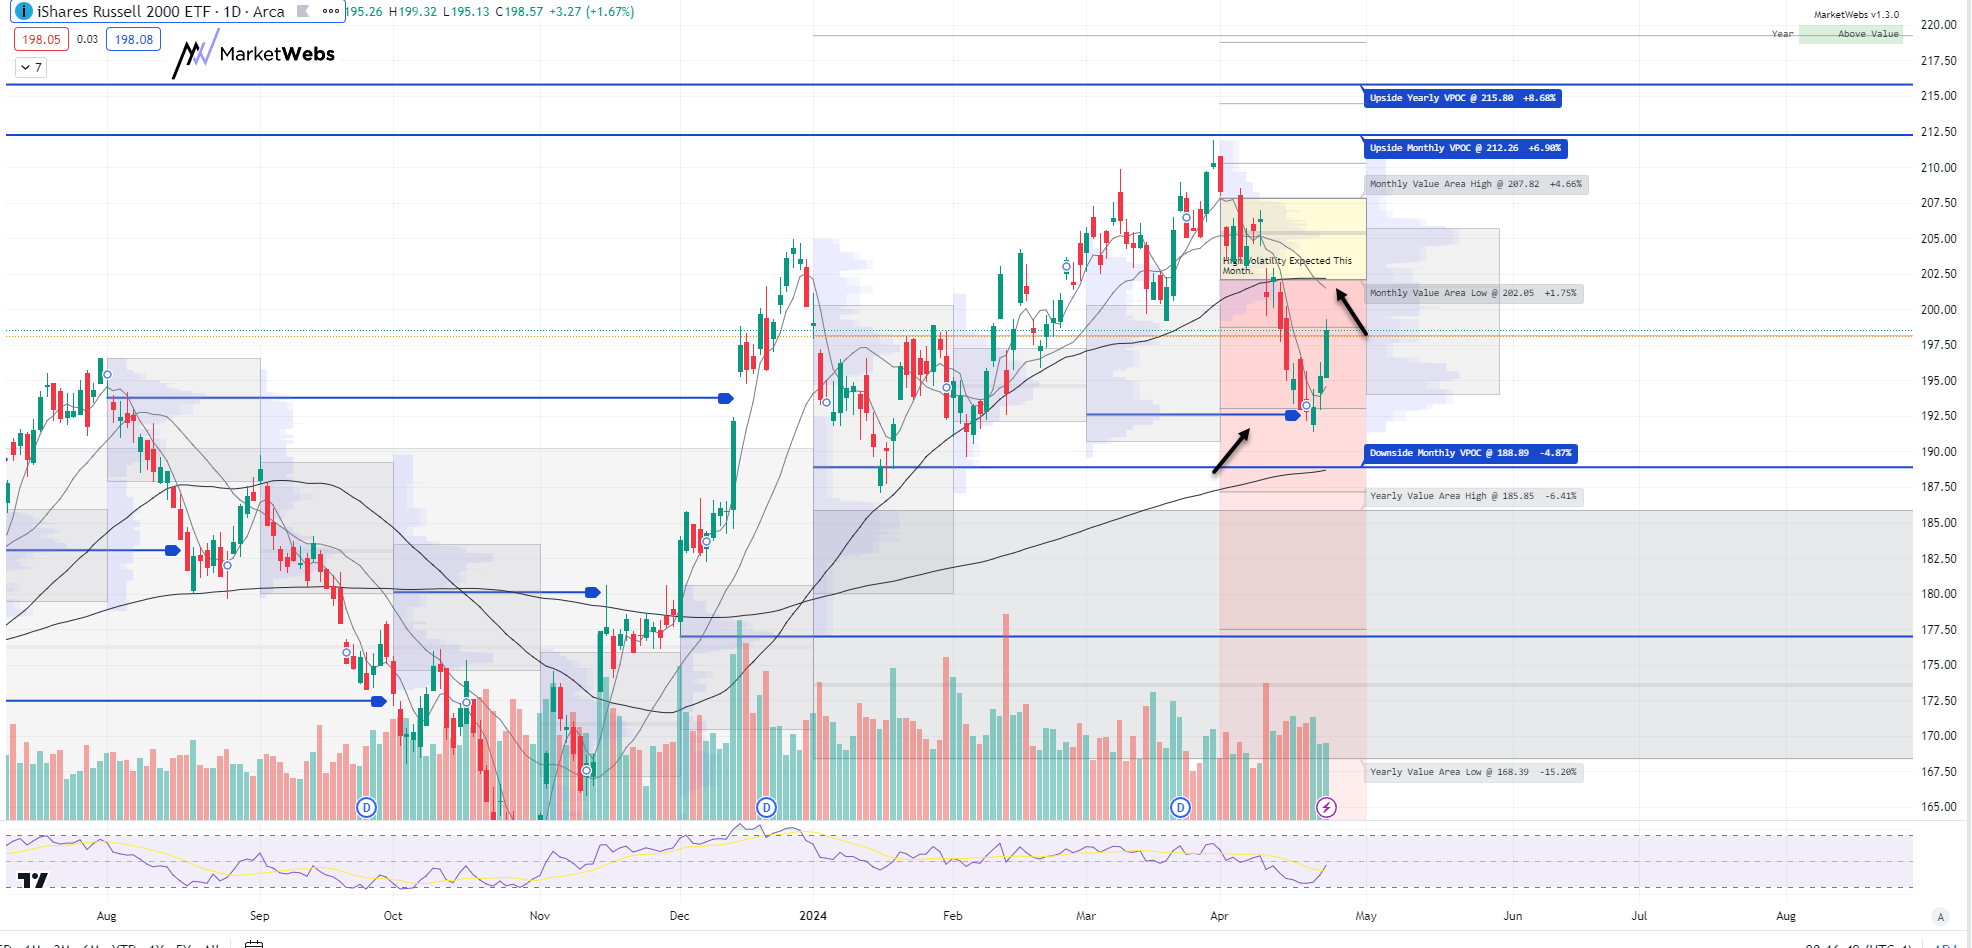
IWM - Russell Small Cap ETF- Daily Chart: Price underperforming this morning -0.2% as rates are higher. Upside resistance is $202.05
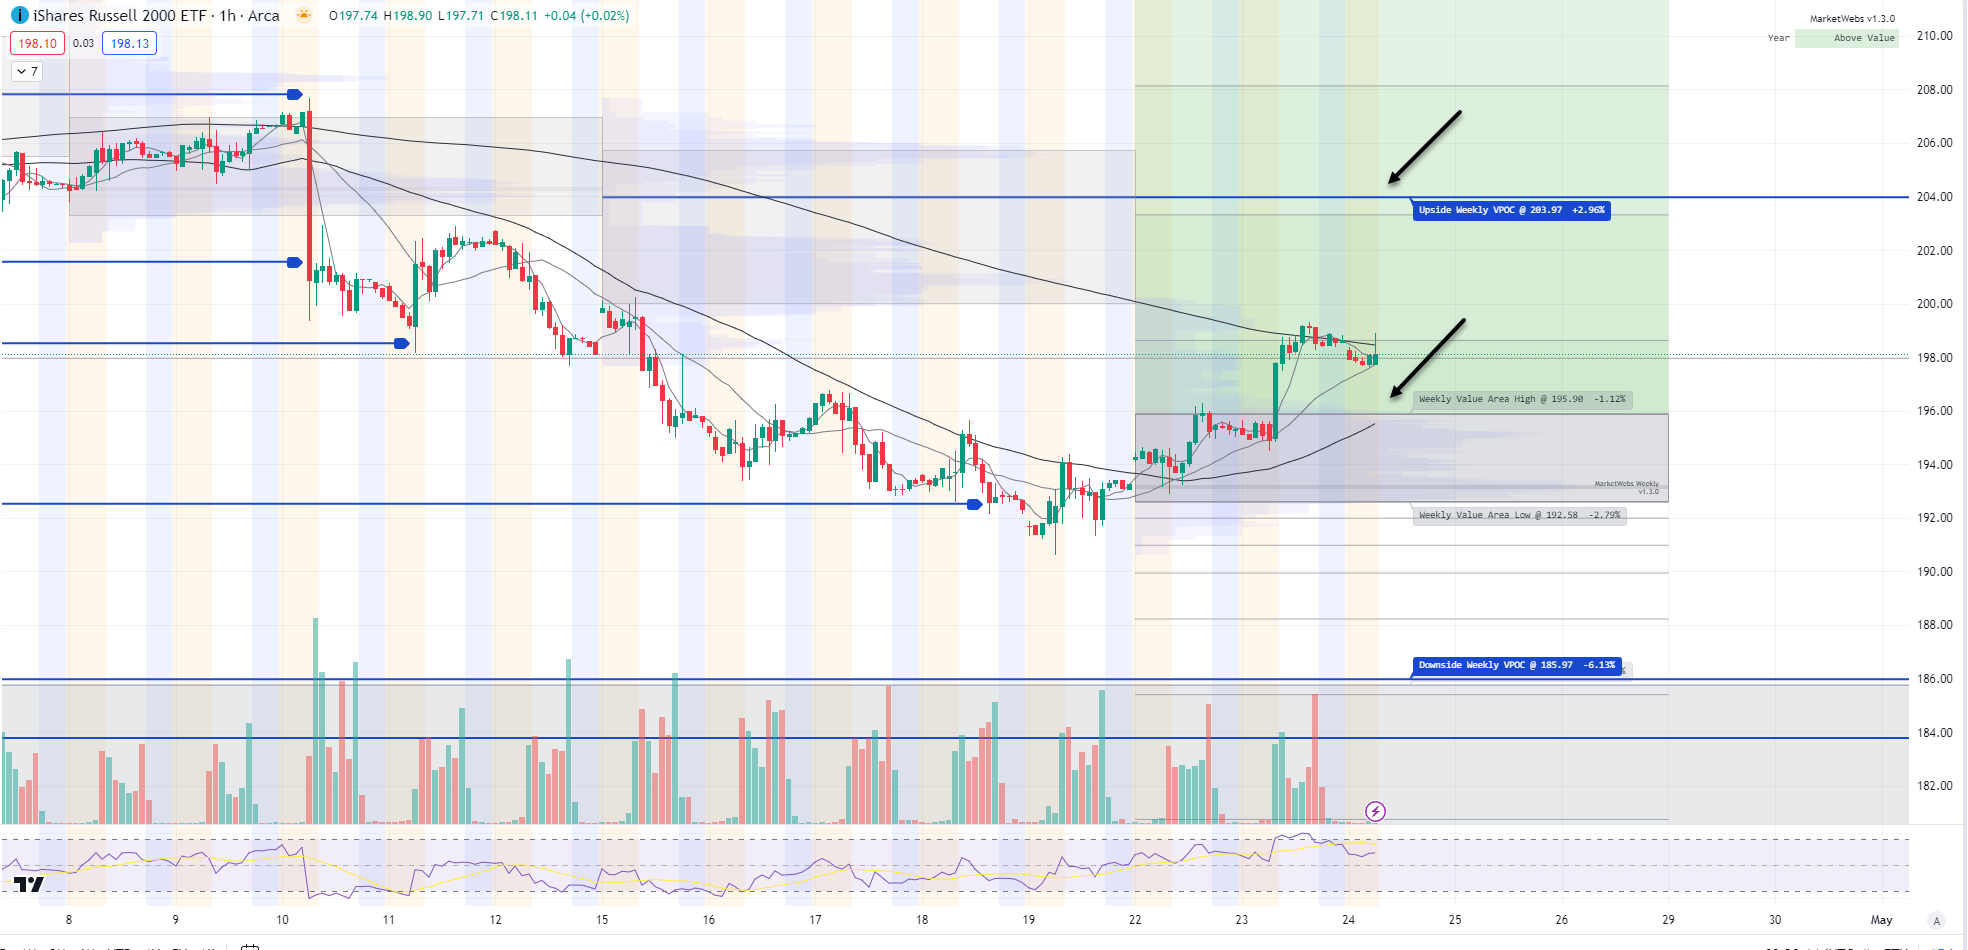
1hr chart: Price above this week's Value Area, support $195.9
Here is today’s TTG Proprietary Stock Screen “Out of the Box” using Volume At Price
names trending above their Value Areas (on 3 multiple timeframes & not super extended)
Keep reading with a 7-day free trial
Subscribe to The Tribeca Trade Group to keep reading this post and get 7 days of free access to the full post archives.