

TTG Index Charts & Out of the Box Stock Screen 2/14/24 $LOW
TTG Index Charts & Out of the Box Stock Screen 2/14/24 $LOW
Out of the Box MarketWebs Screen
US Dollar -0.1% / 30yr Bonds +0.1% / Crude +0.1% & Nat Gas -2.3% / Gold +0.2% / Copper +0.1% / BTC +4.5%
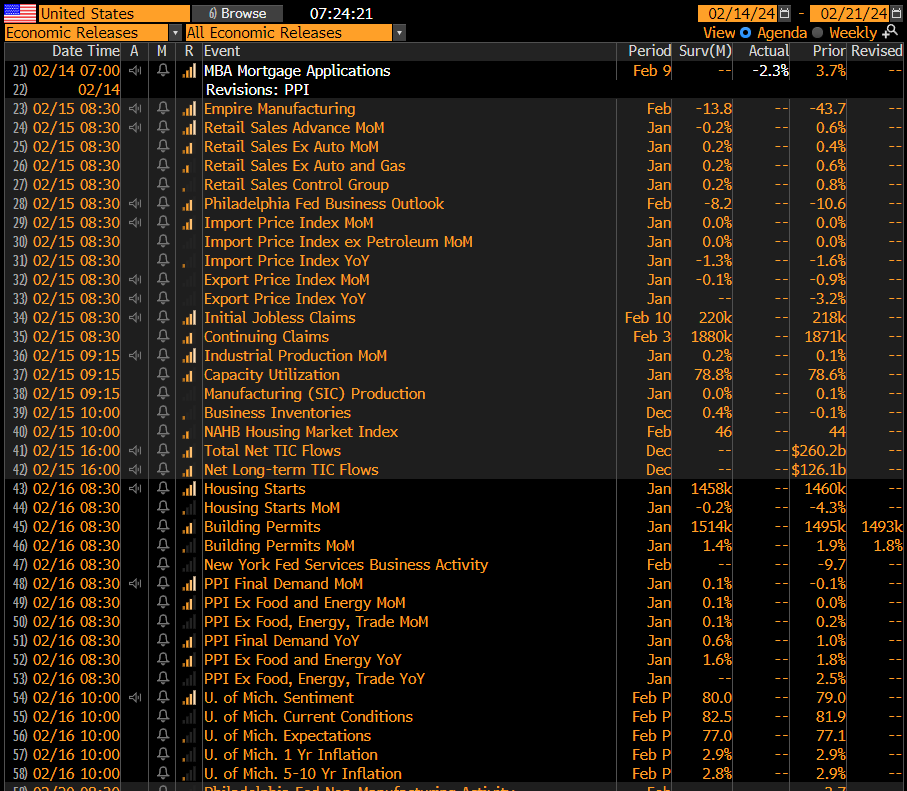
US Upcoming Economics
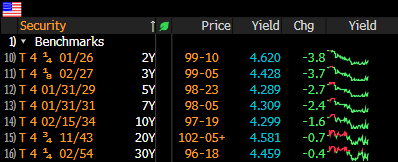
US Bond Yields
Index Updates
At TTG, I use Volume At Price in my chart analysis and I use the MarketWebs Indicator to provide Value Areas & VPOCs which indicate significant support & resistance levels. Learn More Here about Volume At Price and the MarketWebs.
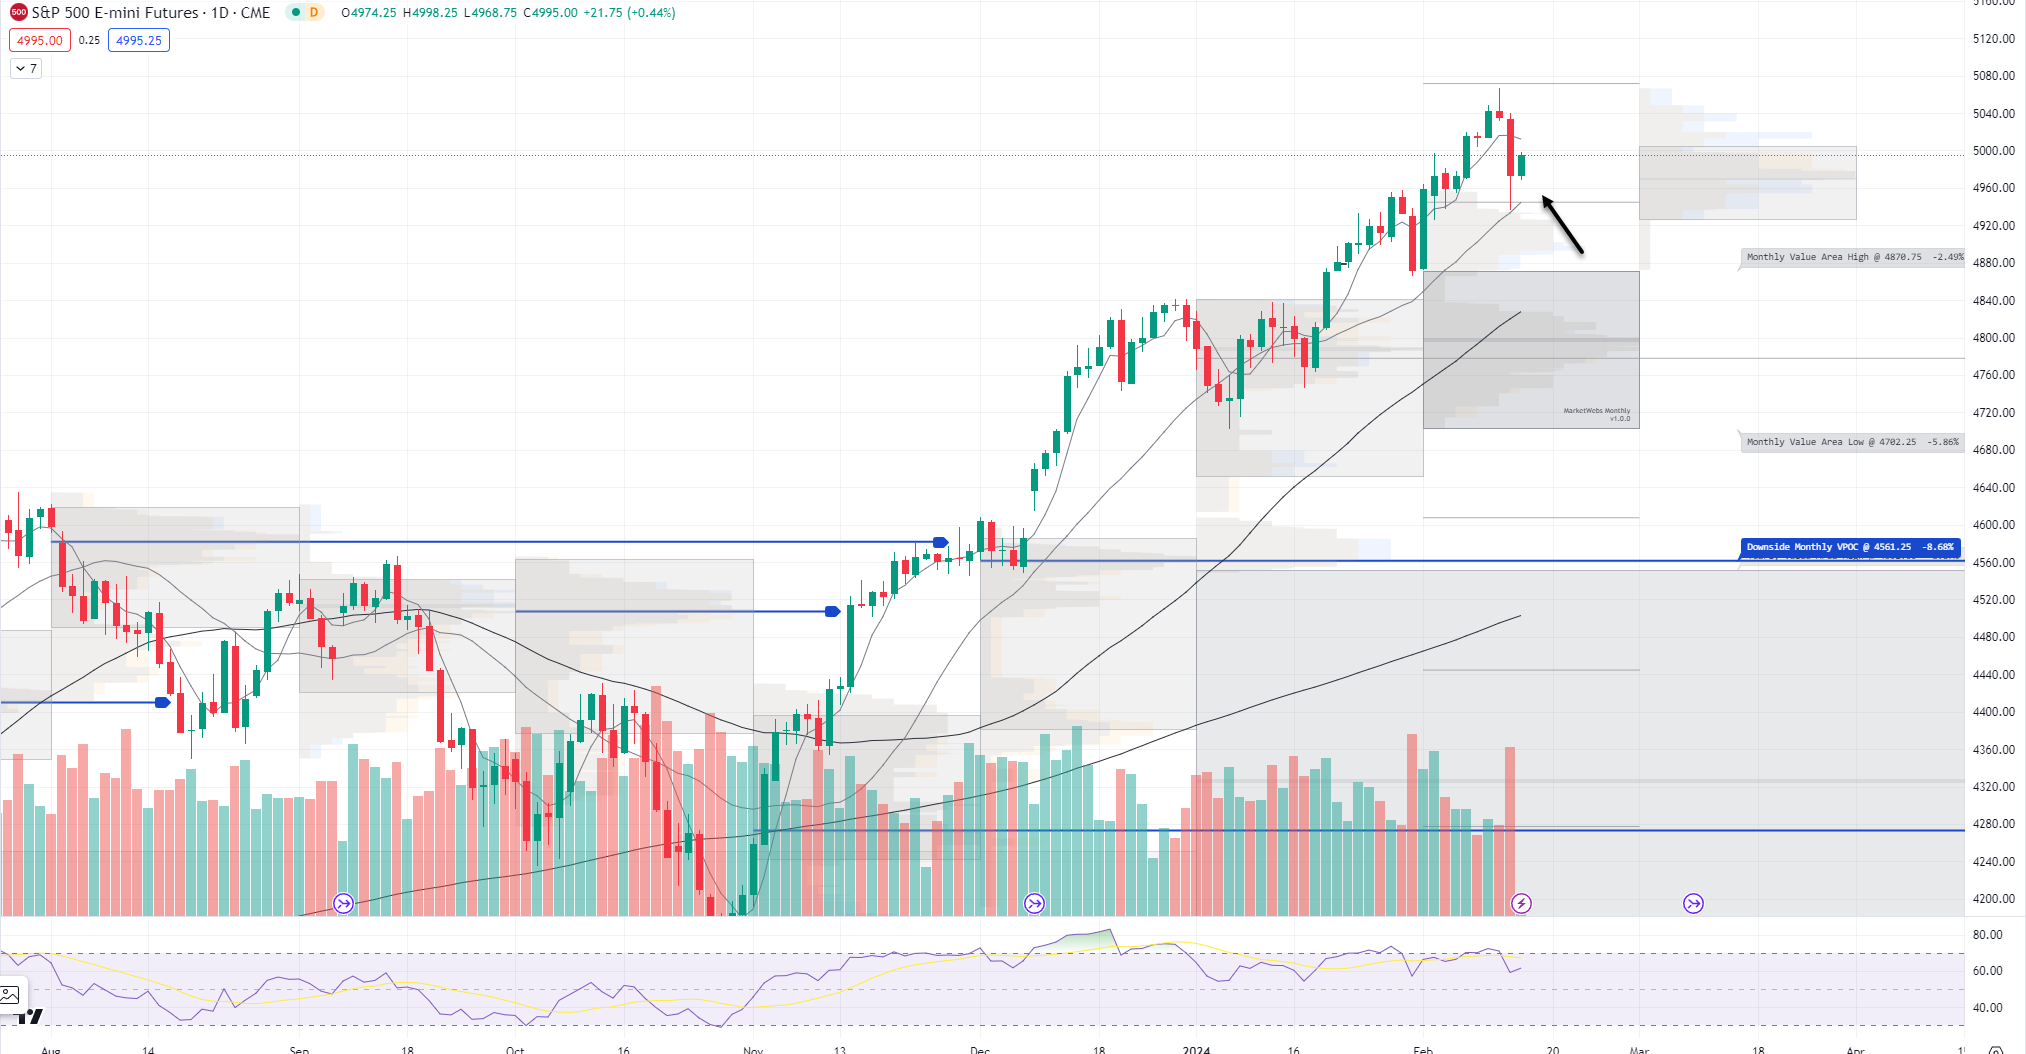
ES_F - SPX Futures - Price bouncing this morning ind. +0.4% and tested the 20d MA (Moving Average) yesterday. Today (and for the rest of the week I am watching to see if price can hold the 20d MA and perhaps retakes its 5d MA
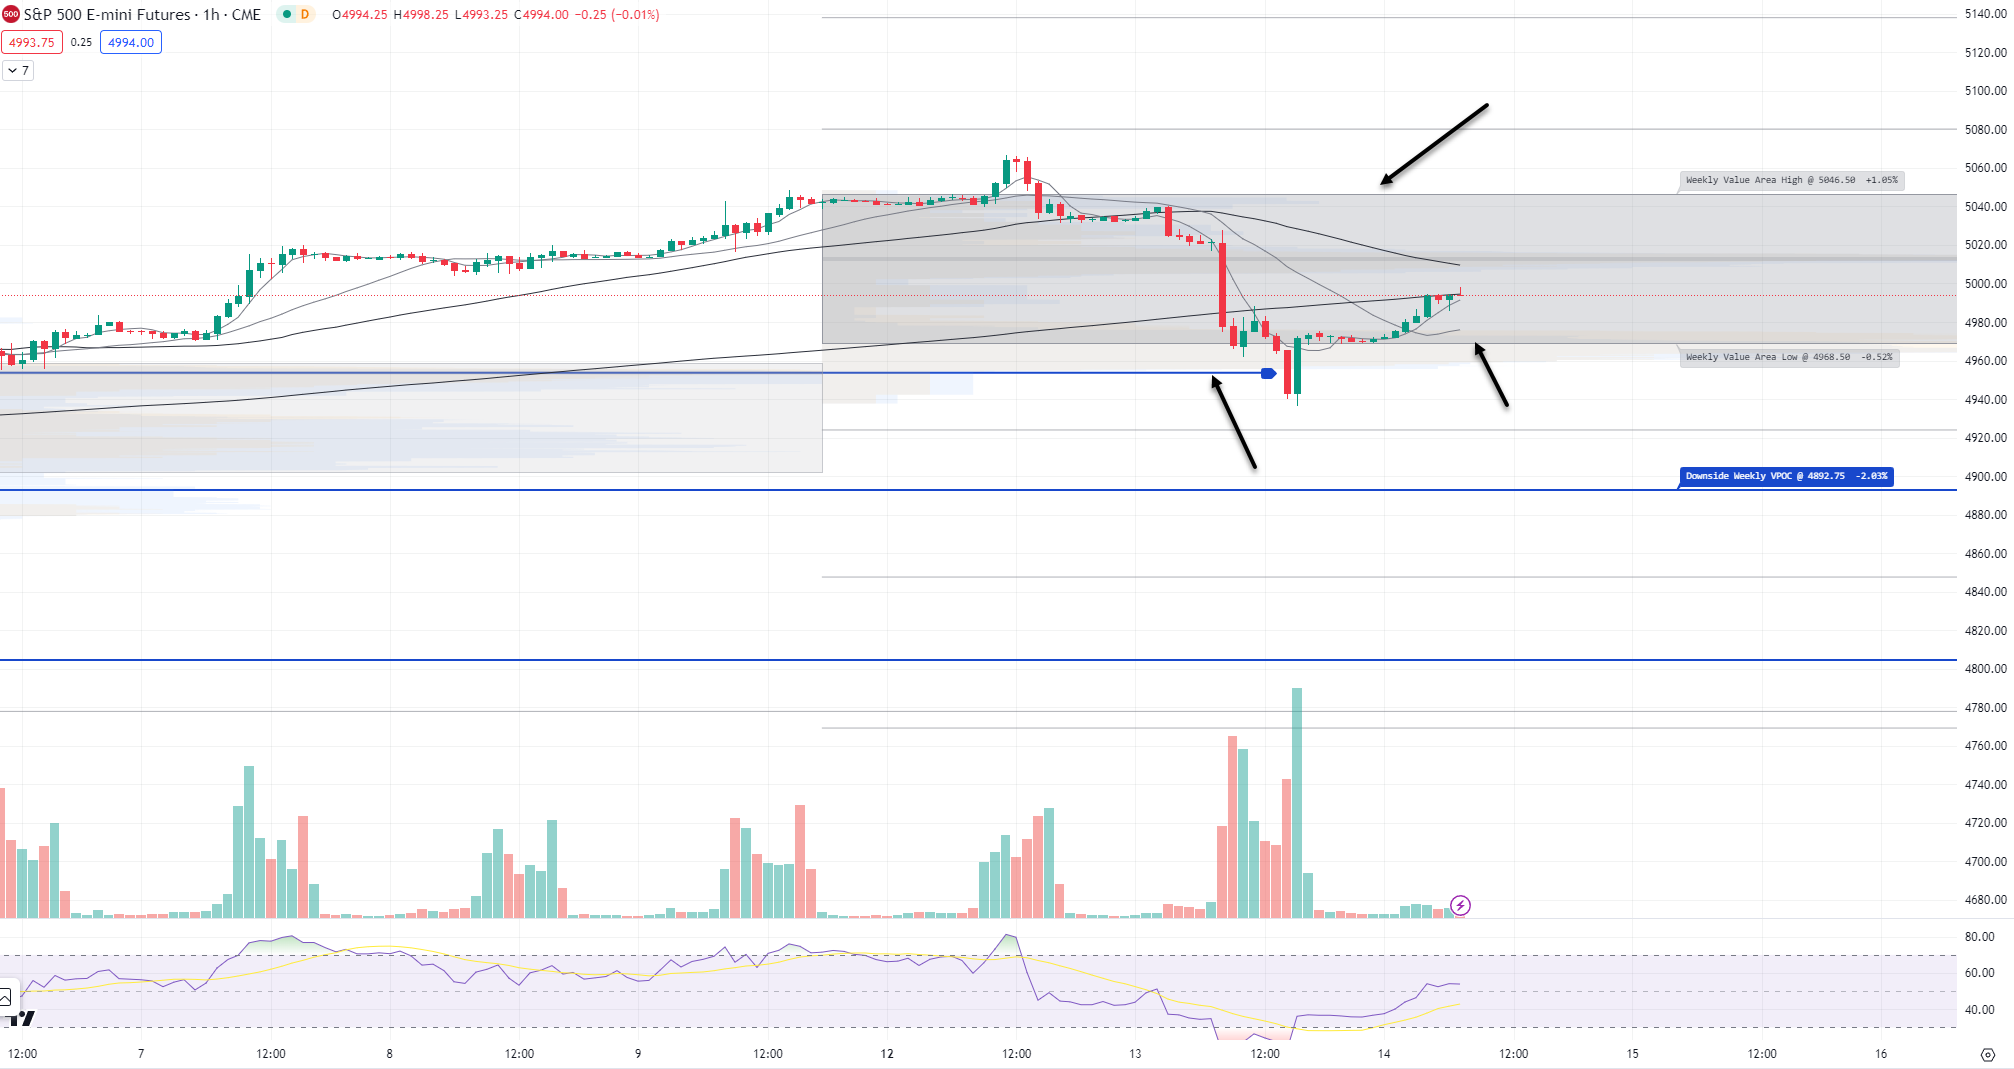
1hr chart: Price took out a lower VPOC (Blue Line) and reversed back into its Value Area for week, which is a positive development. Support to watch is 4968.5
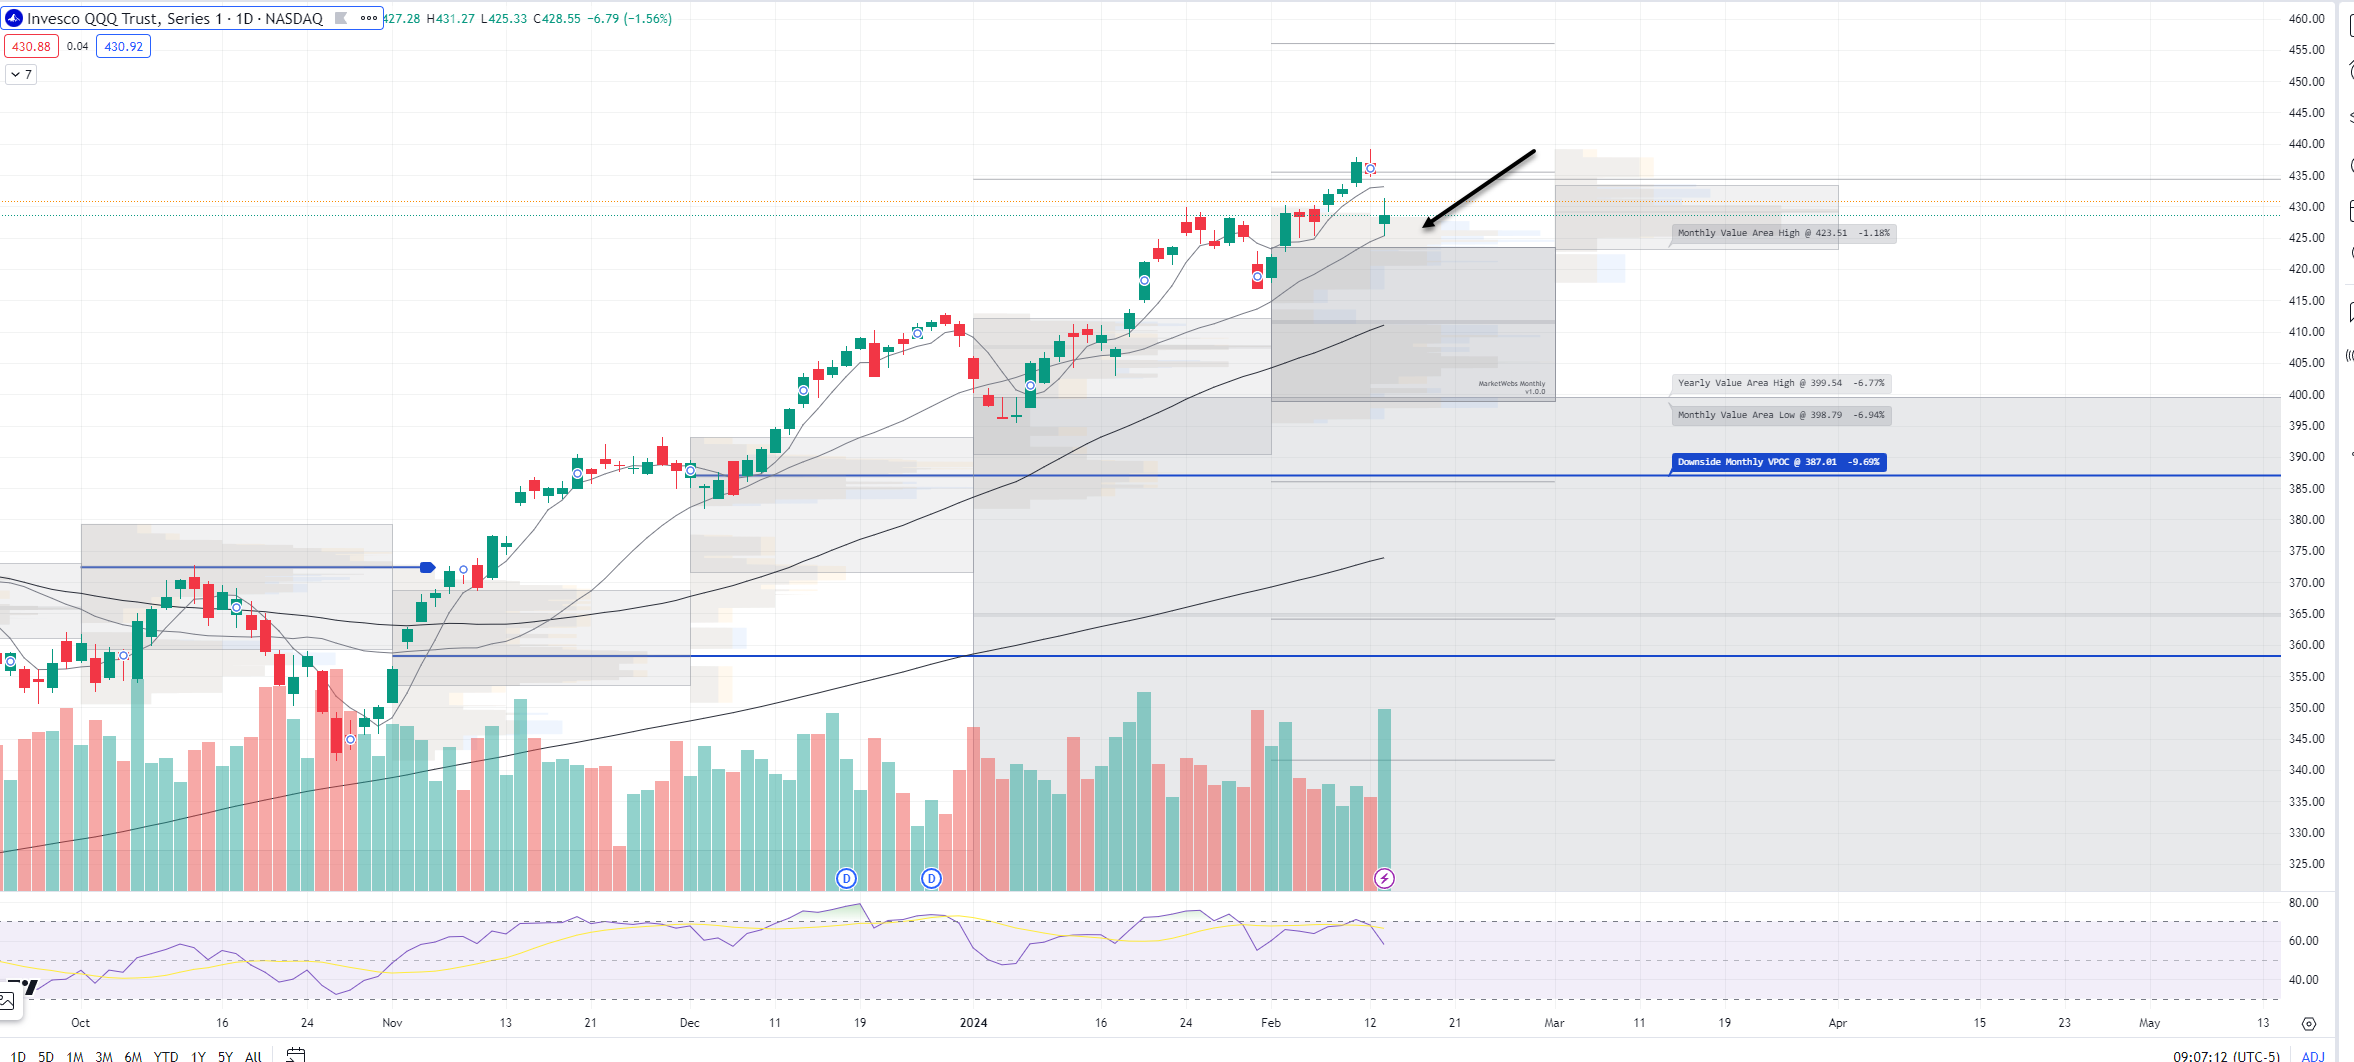
QQQ - NDX 100 ETF - Daily chart: Price ind. +0.6% and held its 20d MA yesterday. In the coming days I am watching both the 20d MA and top of Feb Value Area, $423.5
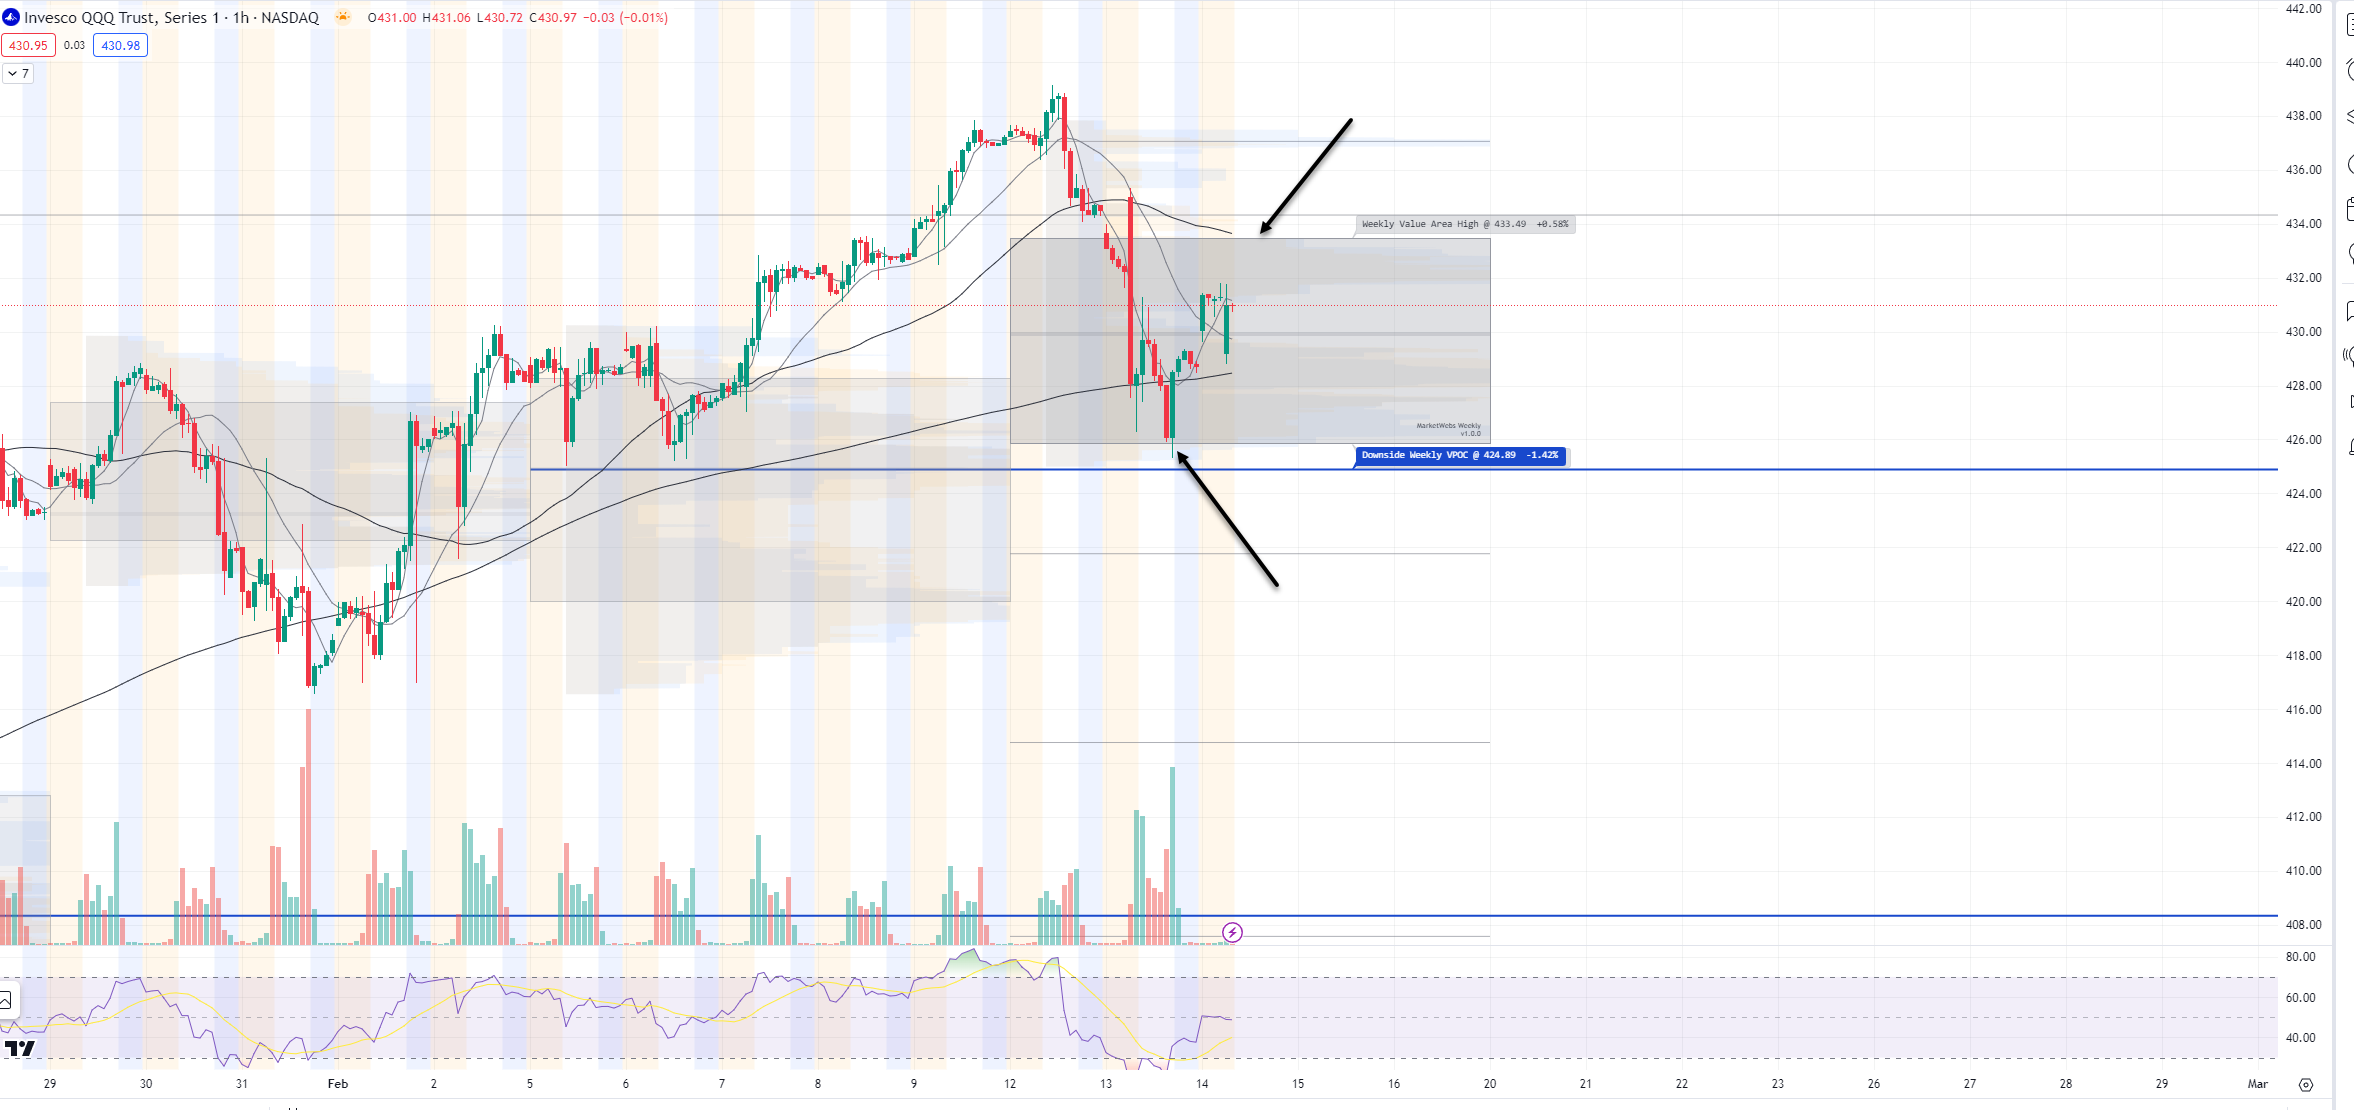
1hr chart: Price is inside its Value Area for week after the bearish 80% rule played out , levels to watch below
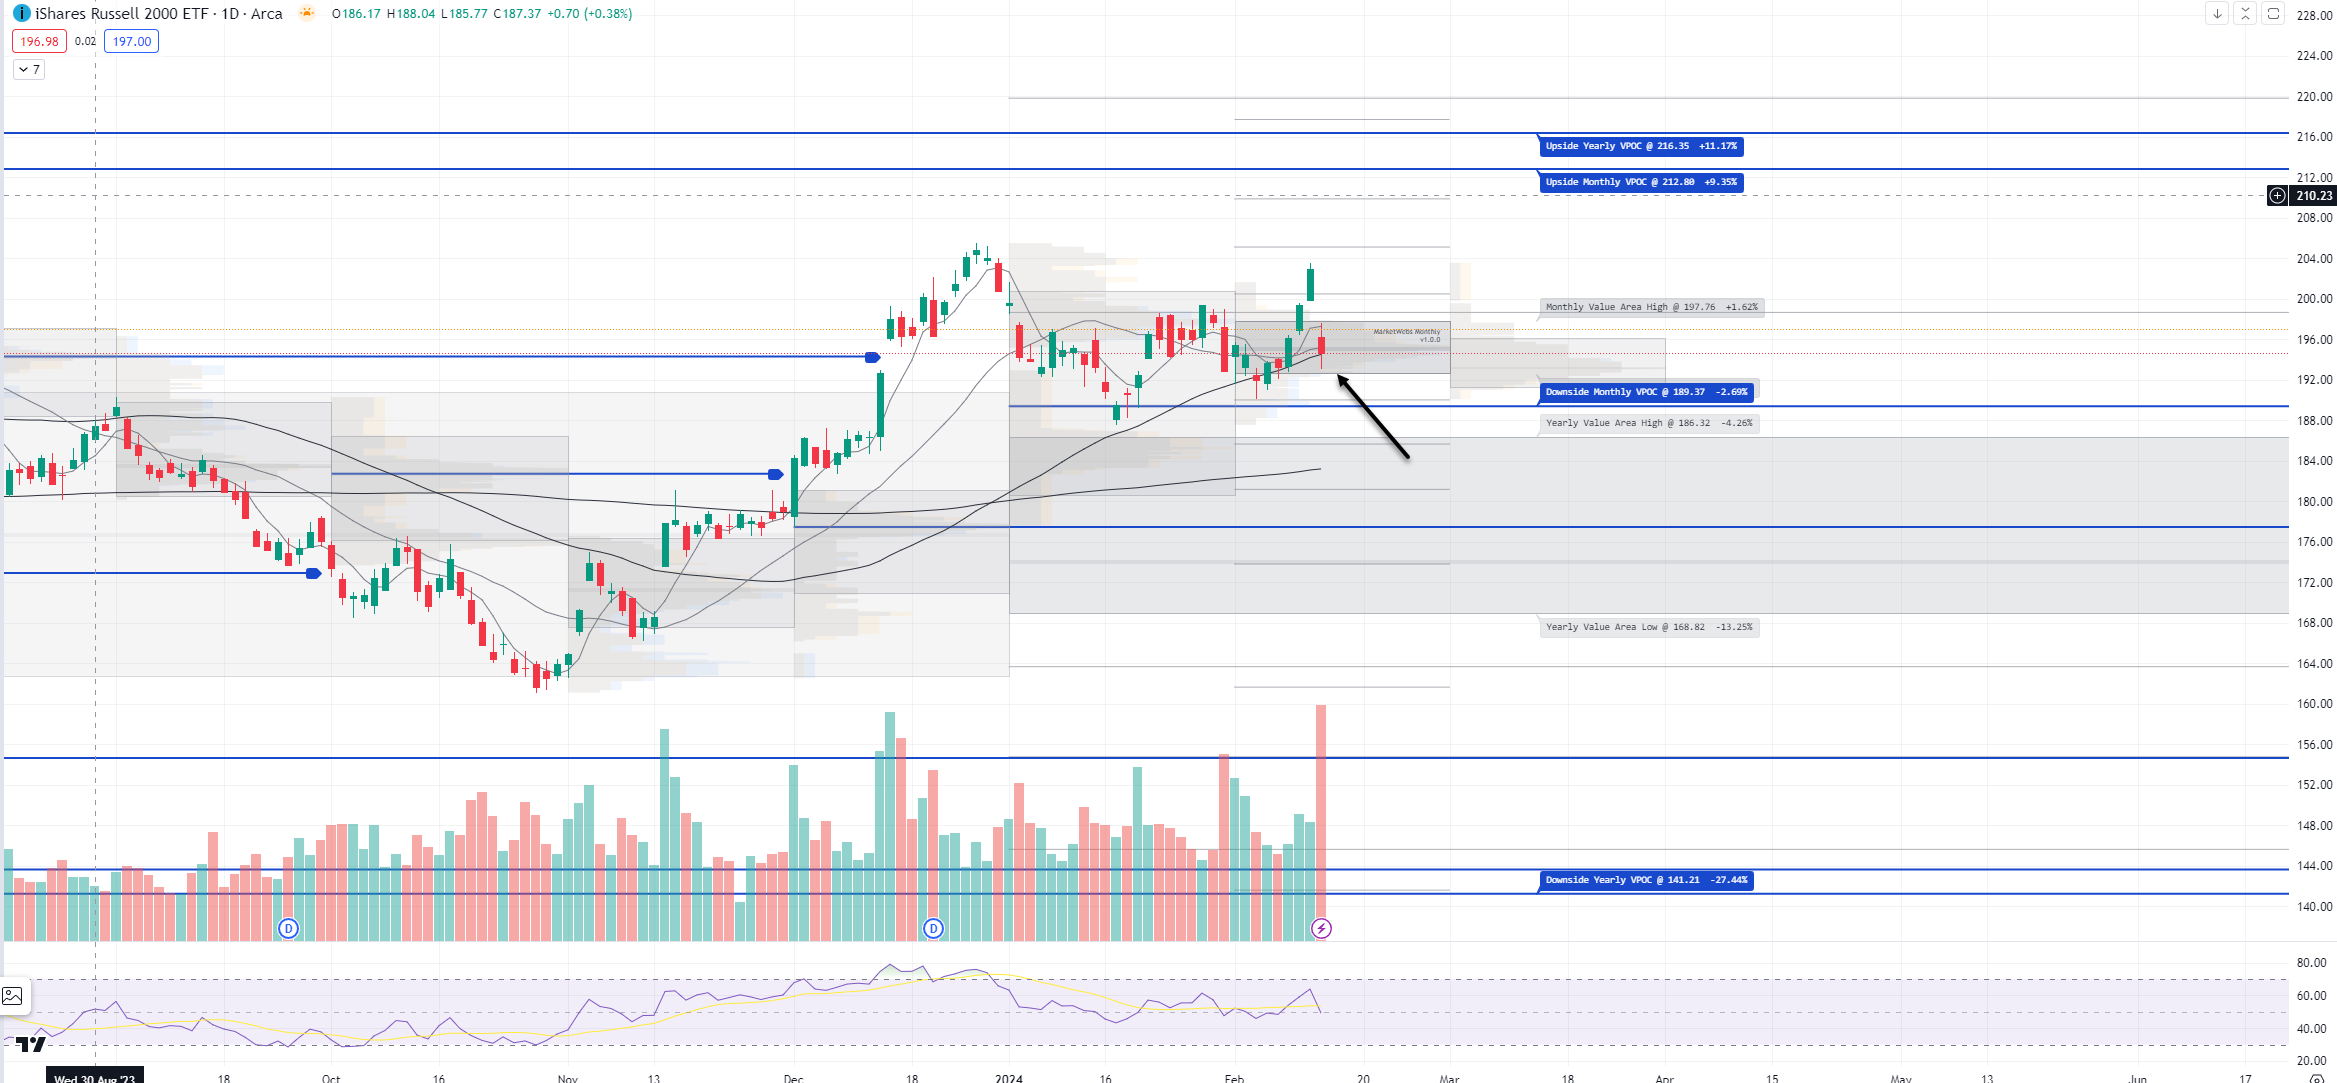
IWM - Russell Small Cap ETF- Price ind +1.3% and outperforming. Note , yesterday price found support at its 50d MA and bottom of Feb Value Area, support to watch $192.5
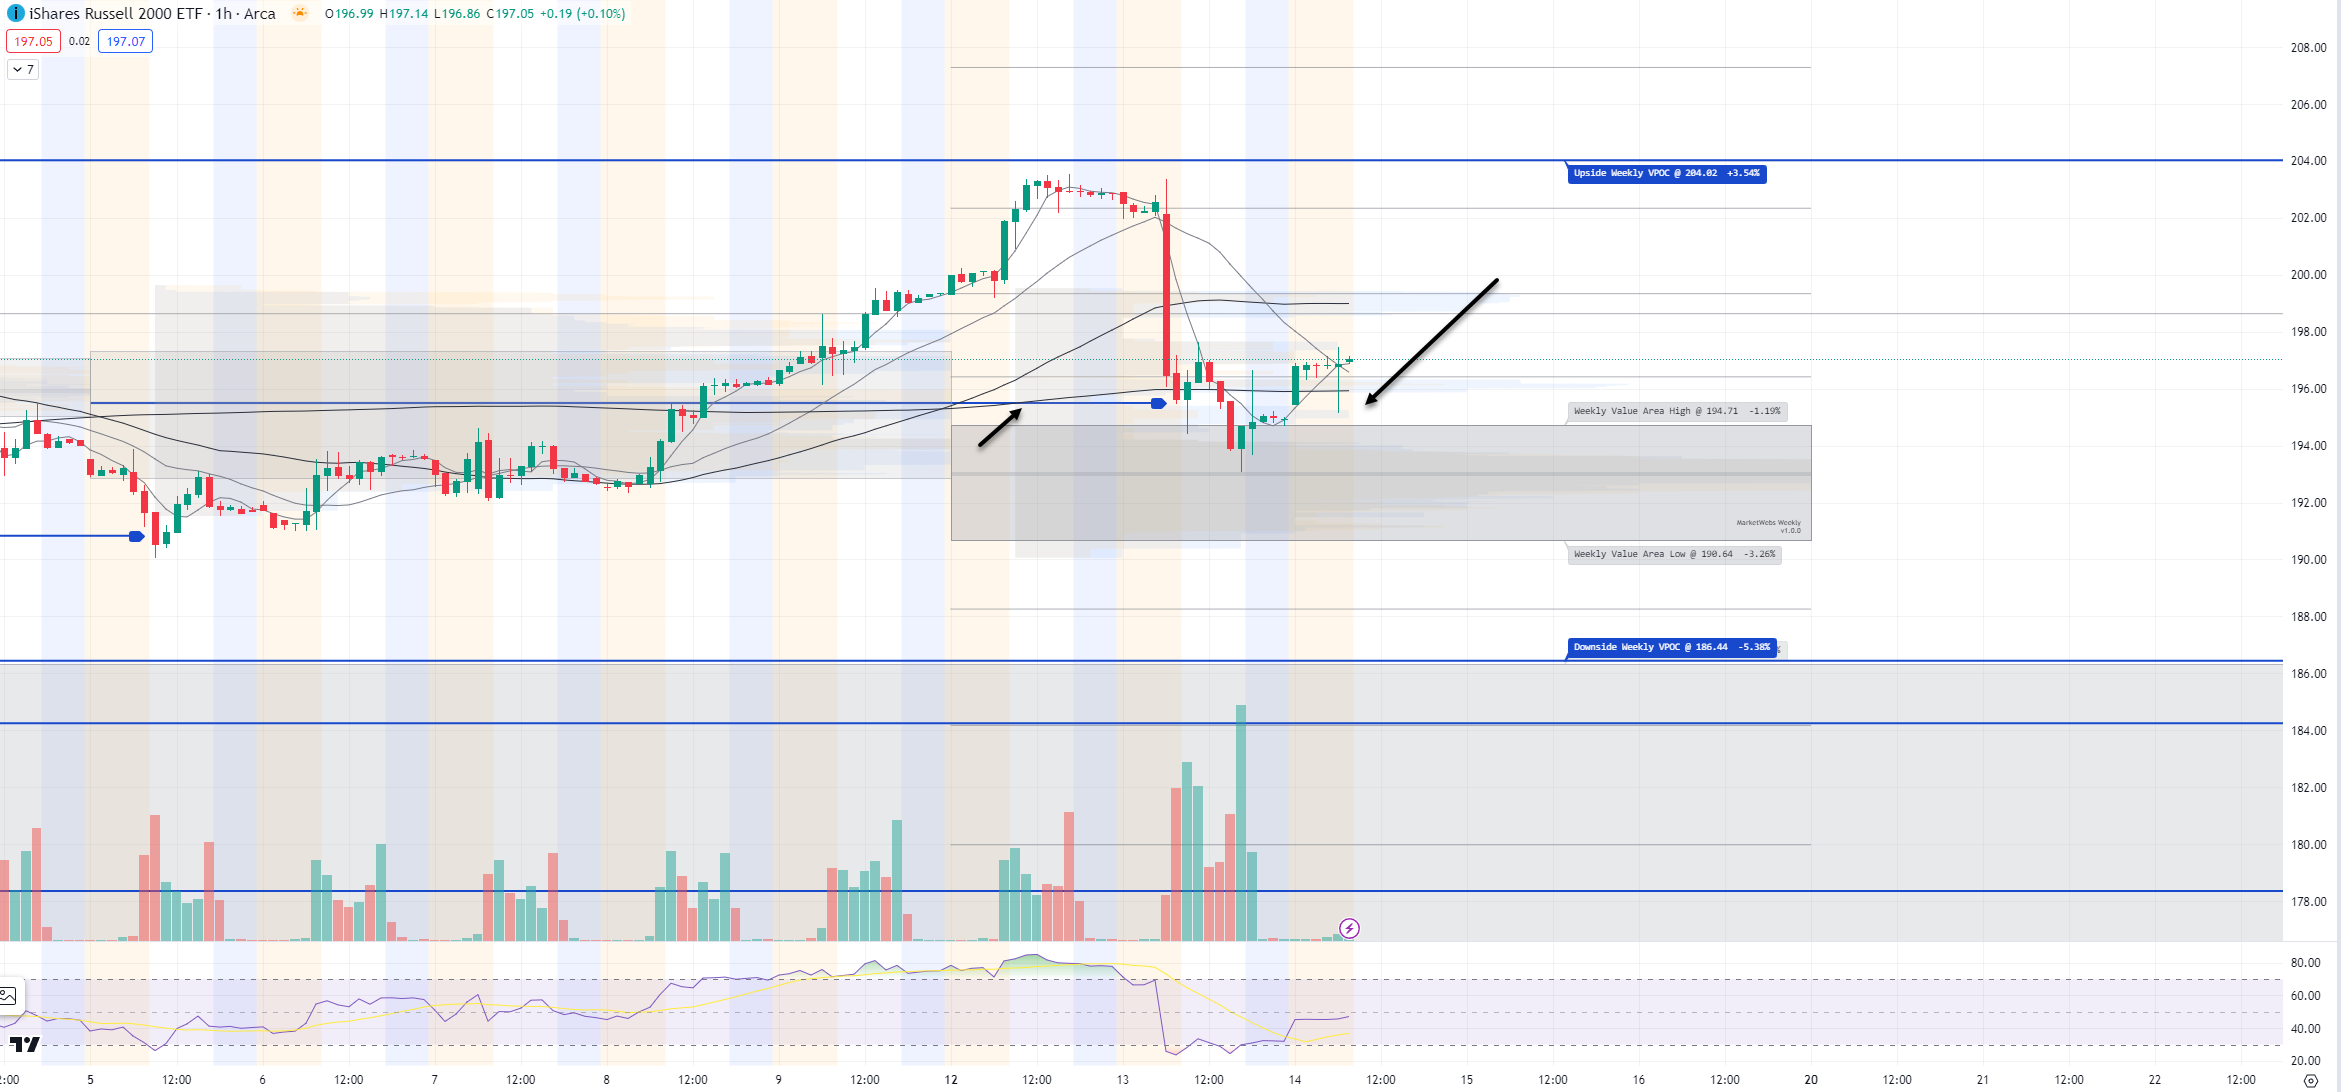
1hr chart: Price dipped into its Value Area yesterday, and now back above , support to watch $194.7
Here is today’s TTG Proprietary Stock Screen “Out of the Box” using Volume At Price
names trending above their Value Areas (on 3 multiple timeframes & not super extended)
Keep reading with a 7-day free trial
Subscribe to The Tribeca Trade Group to keep reading this post and get 7 days of free access to the full post archives.