

TTG Index Charts & Out of the Box Stock Screen 01/03/24 $DD $ABBV
TTG Index Charts & Out of the Box Stock Screen 01/03/24 $DD $ABBV
Out of the Box MarketWebs Screen
US Dollar +0.3% / 30yr Bonds -0.5% / Crude +1.1% & Nat Gas +2.3% / Gold -0.8% / Copper -0.9% / BTC -5.5%
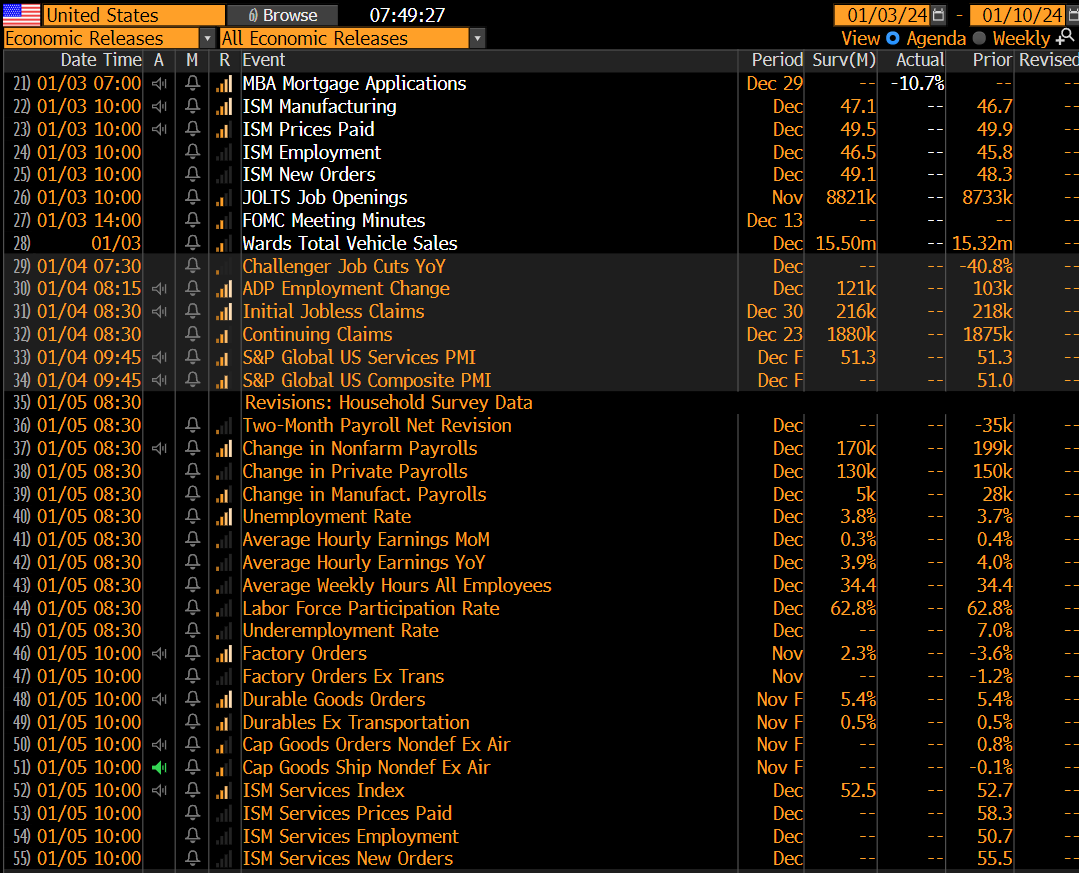
US Upcoming Economics
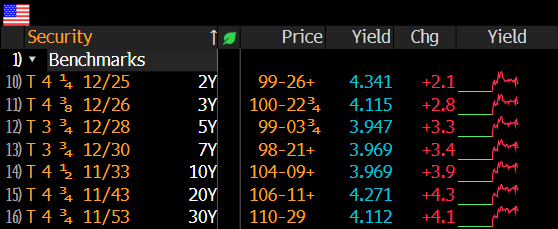
US Bond Yields
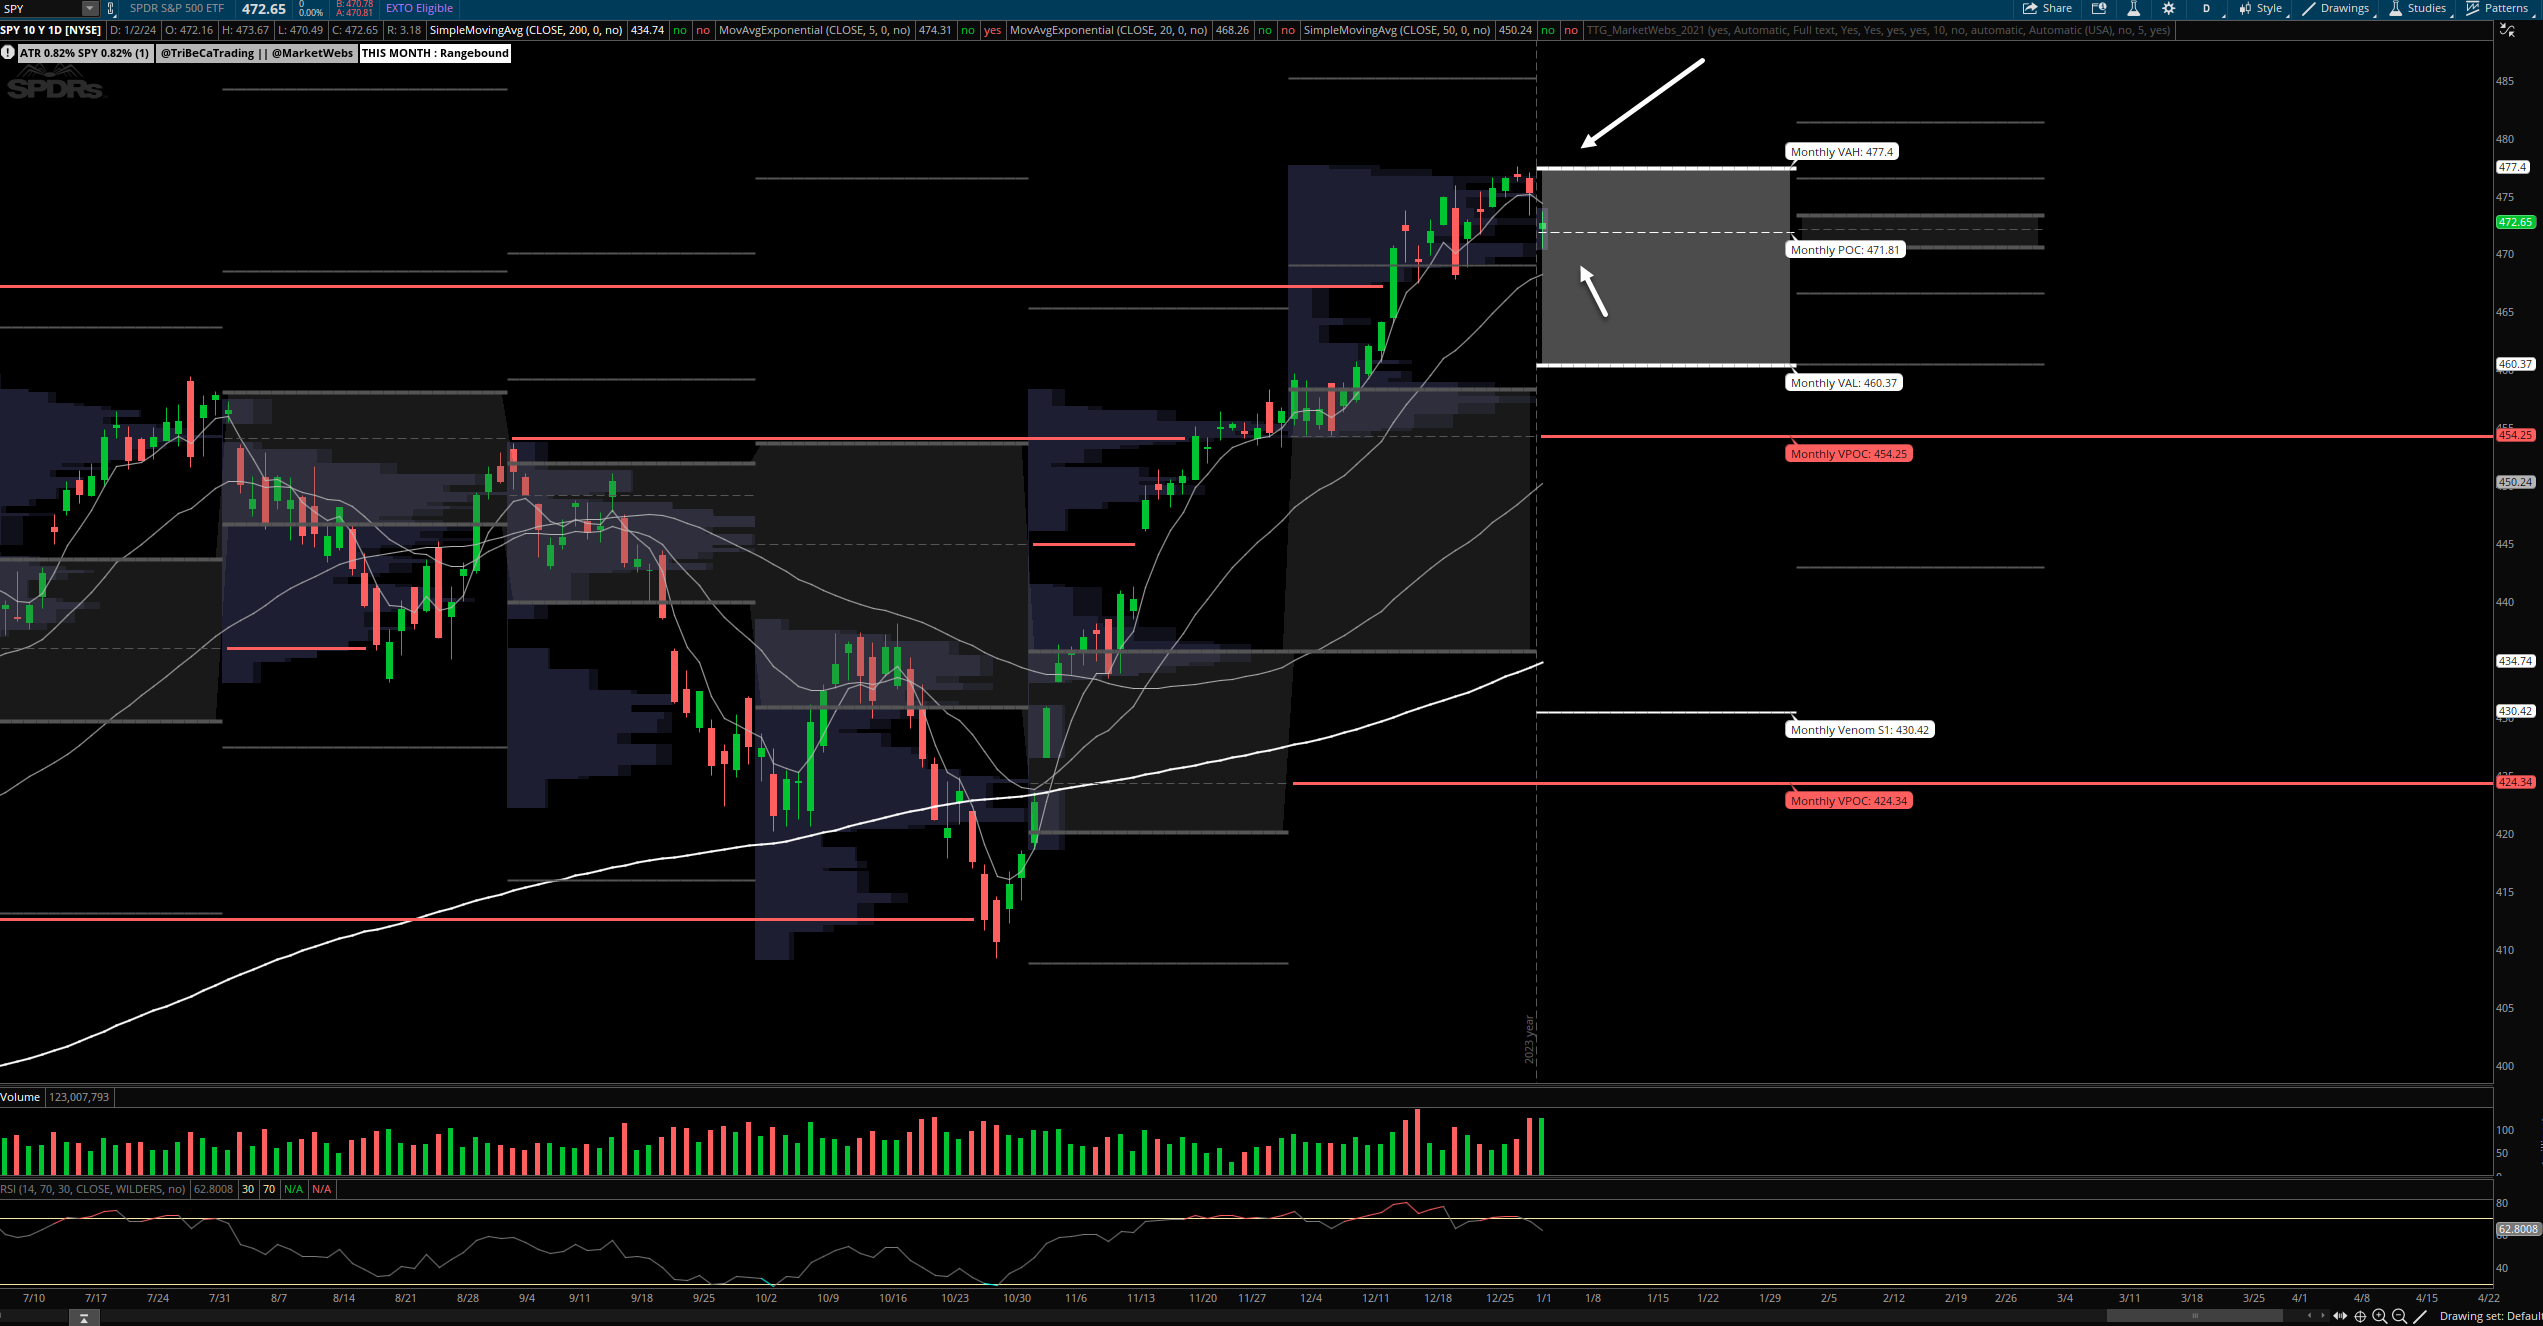
Index Updates
At TTG, I use Volume At Price in my chart analysis and I use the MarketWebs Indicator to provide Value Areas & VPOCs which indicate significant support & resistance levels. Learn More Here about Volume At Price and the MarketWebs.
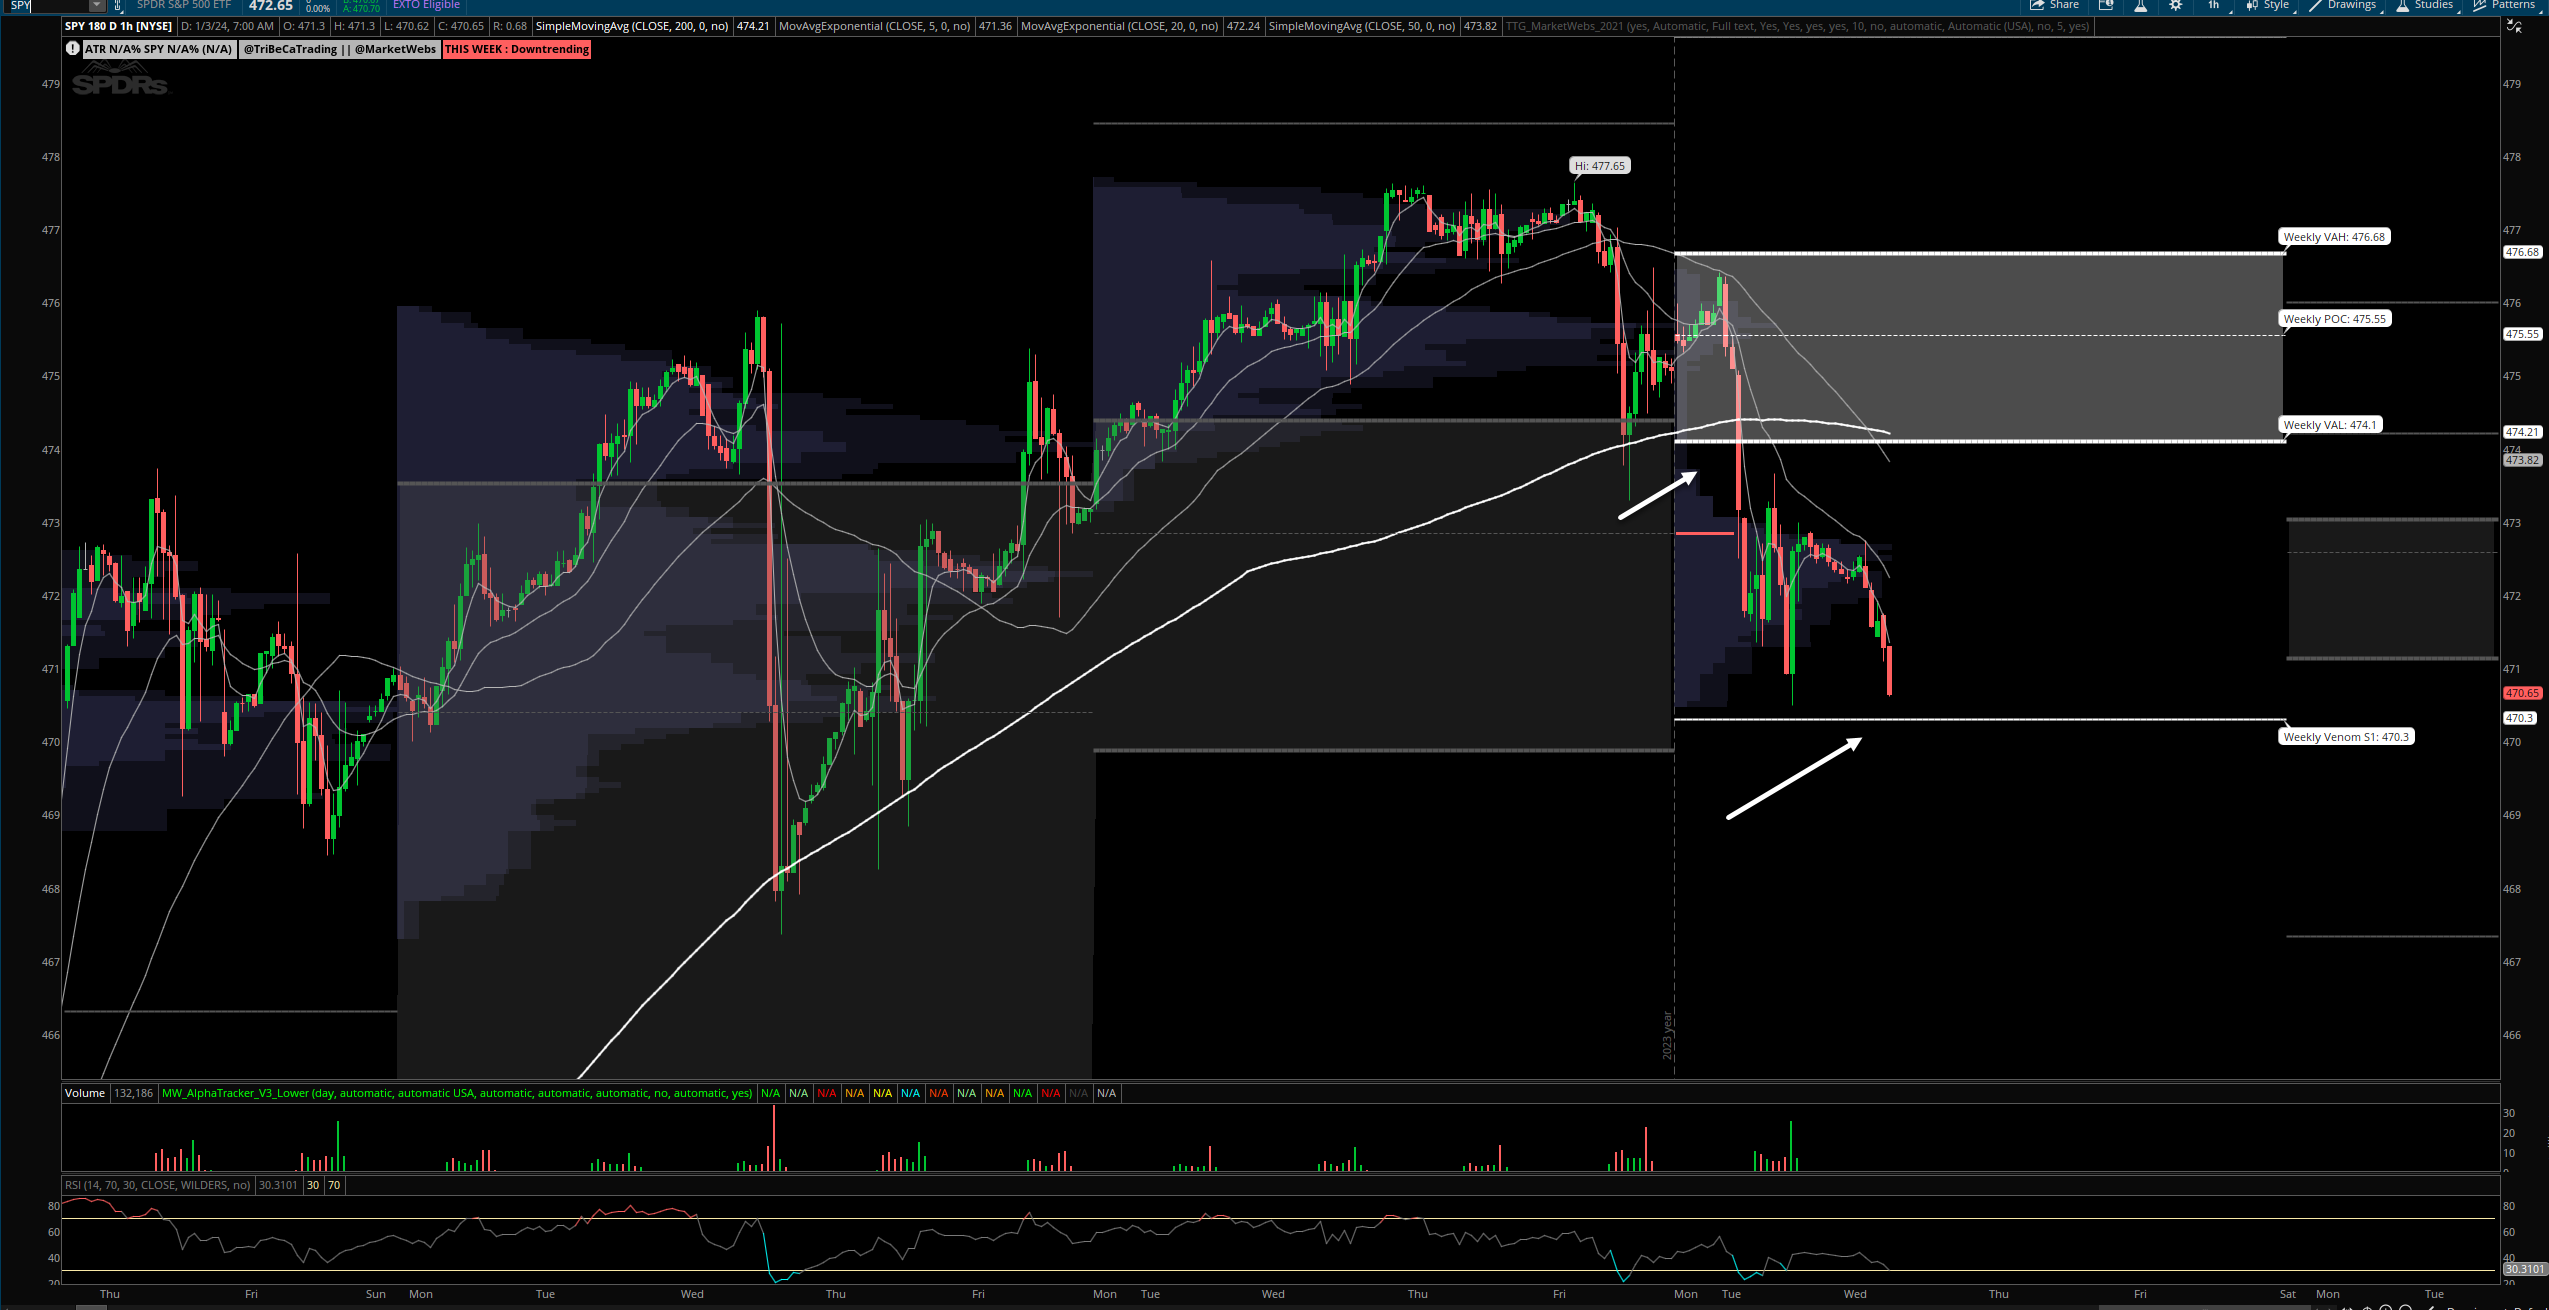
SPY- S&P ETF - Prices continuing to mover lower this morning, ind -0.4%. Price is inside its Jan Value Area and moving down towards its 20d EMA which will be its next test of support.
Note the Dollar is stronger & rates are higher again this morning which is indicating risk off for 2nd day in a row
1hr chart: Price close to taking out Monday's lows and not much support here in short term - for now, watch S1 (extension from this week's Value Area) $470.3
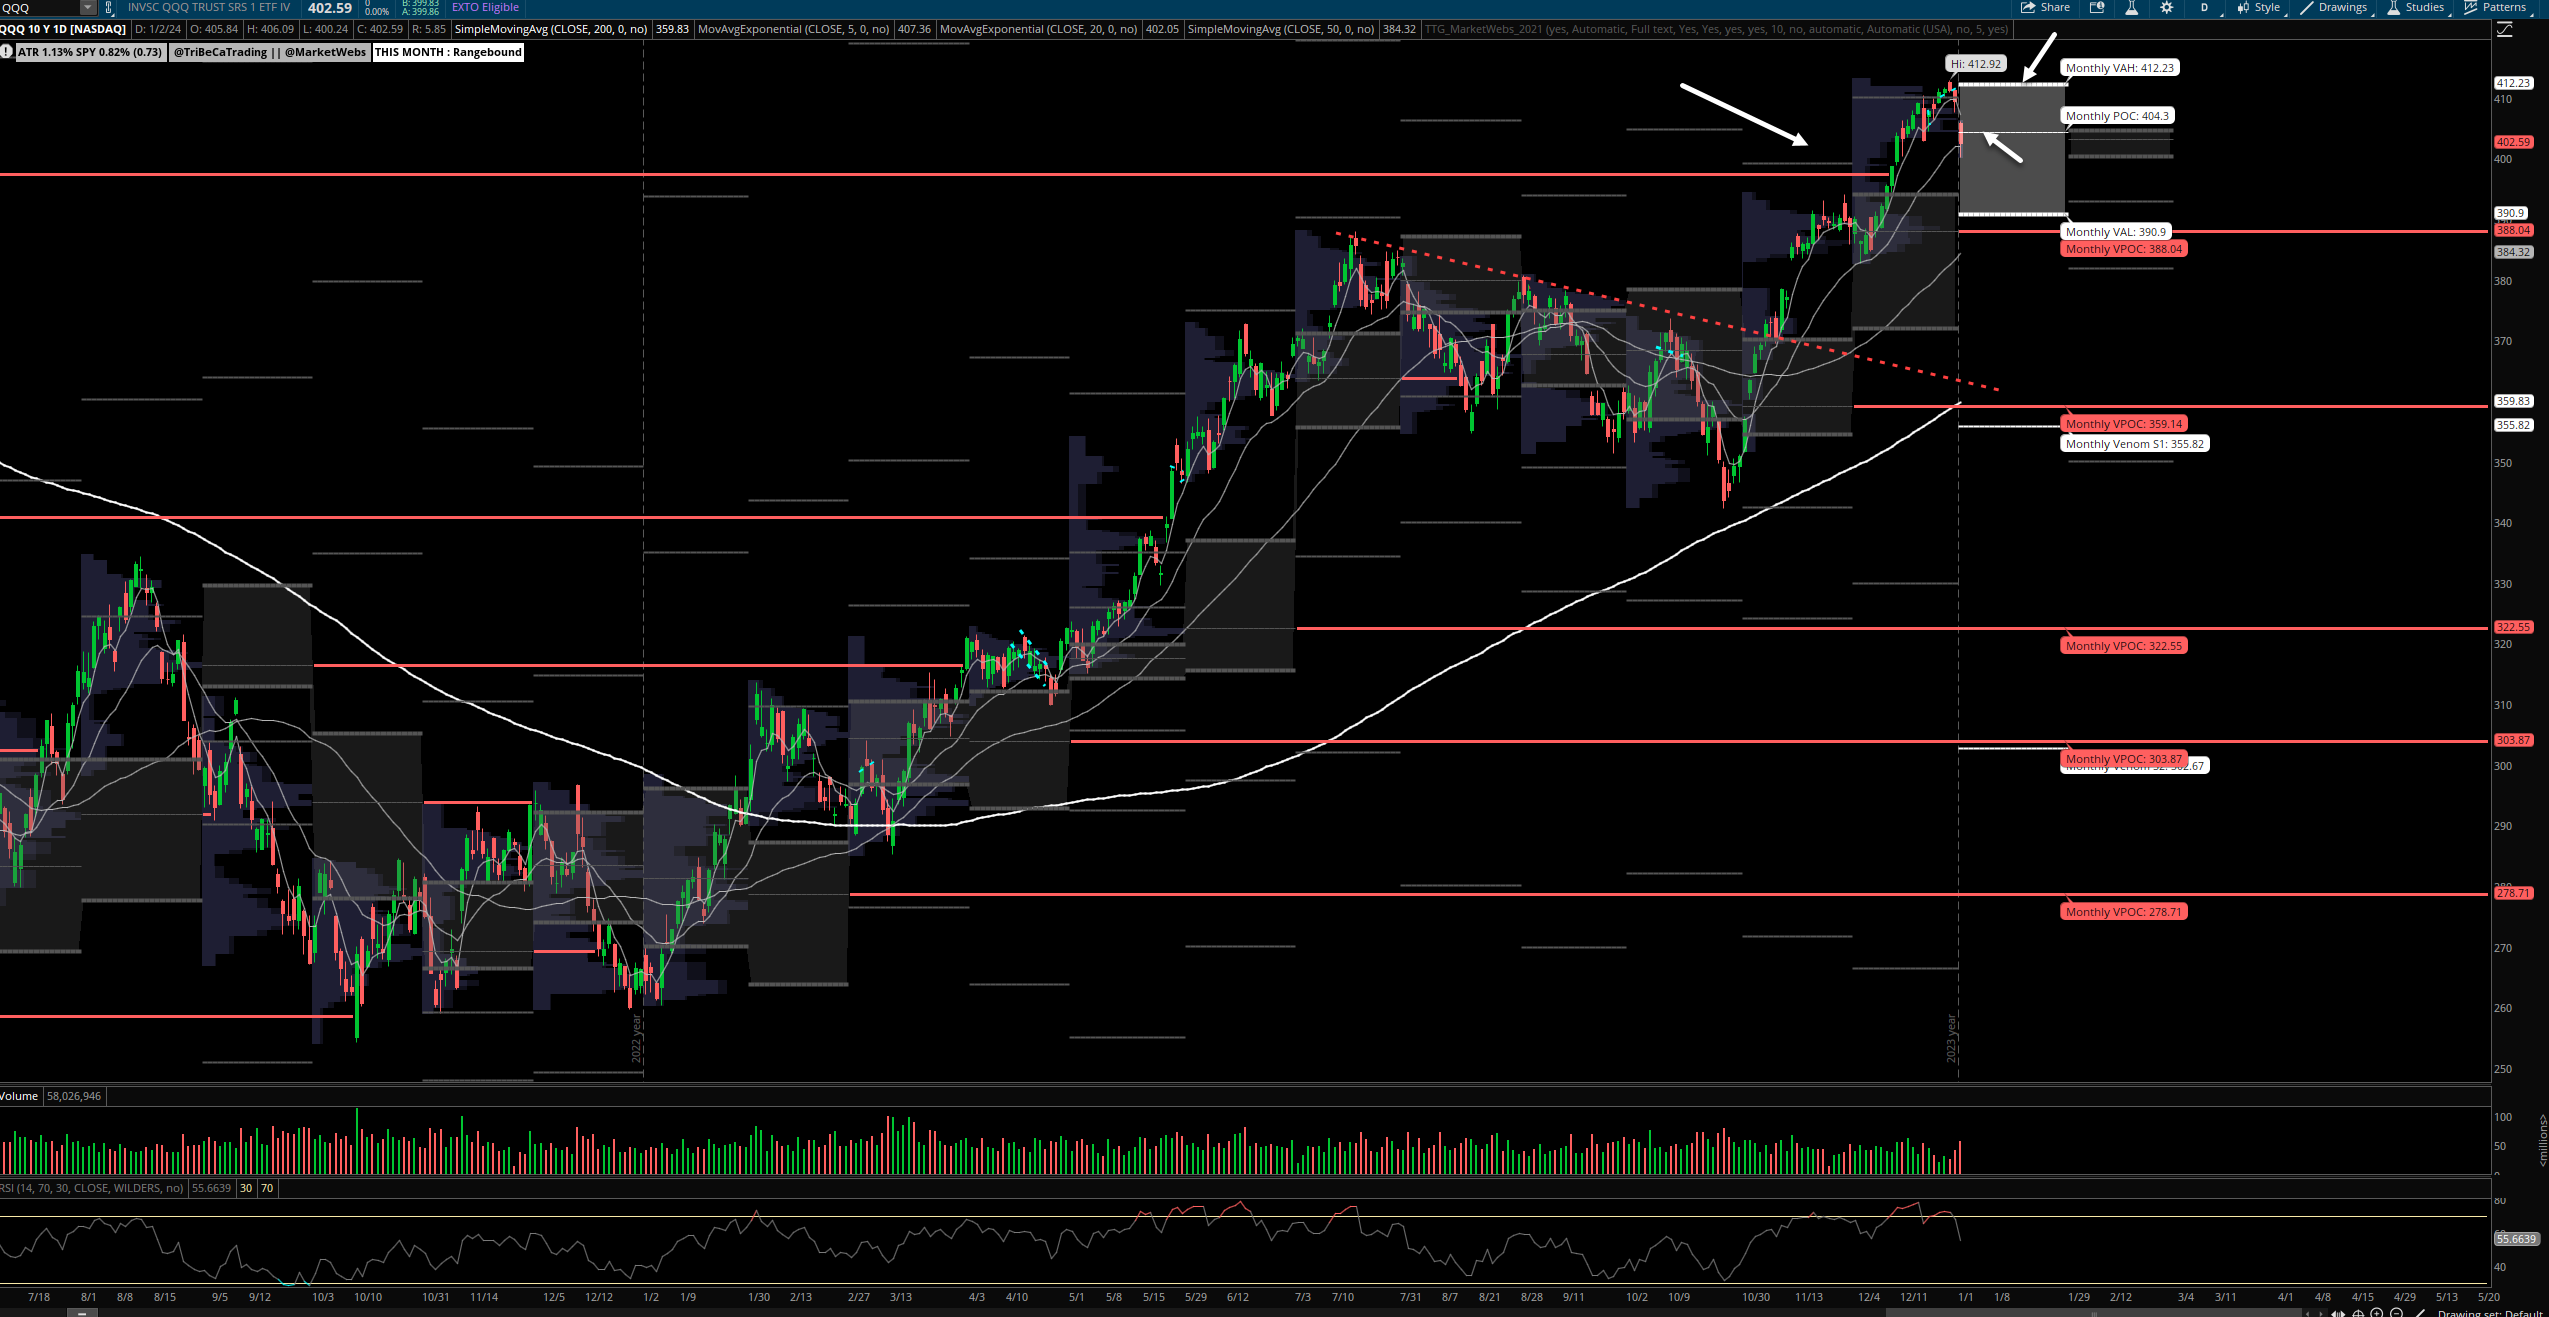
QQQ - NDX 100 ETF - Daily chart: Price ind -0.7% & through its 20d MA and yesterday's low & possibly may be returning down to that last VPOC (red line) takeout
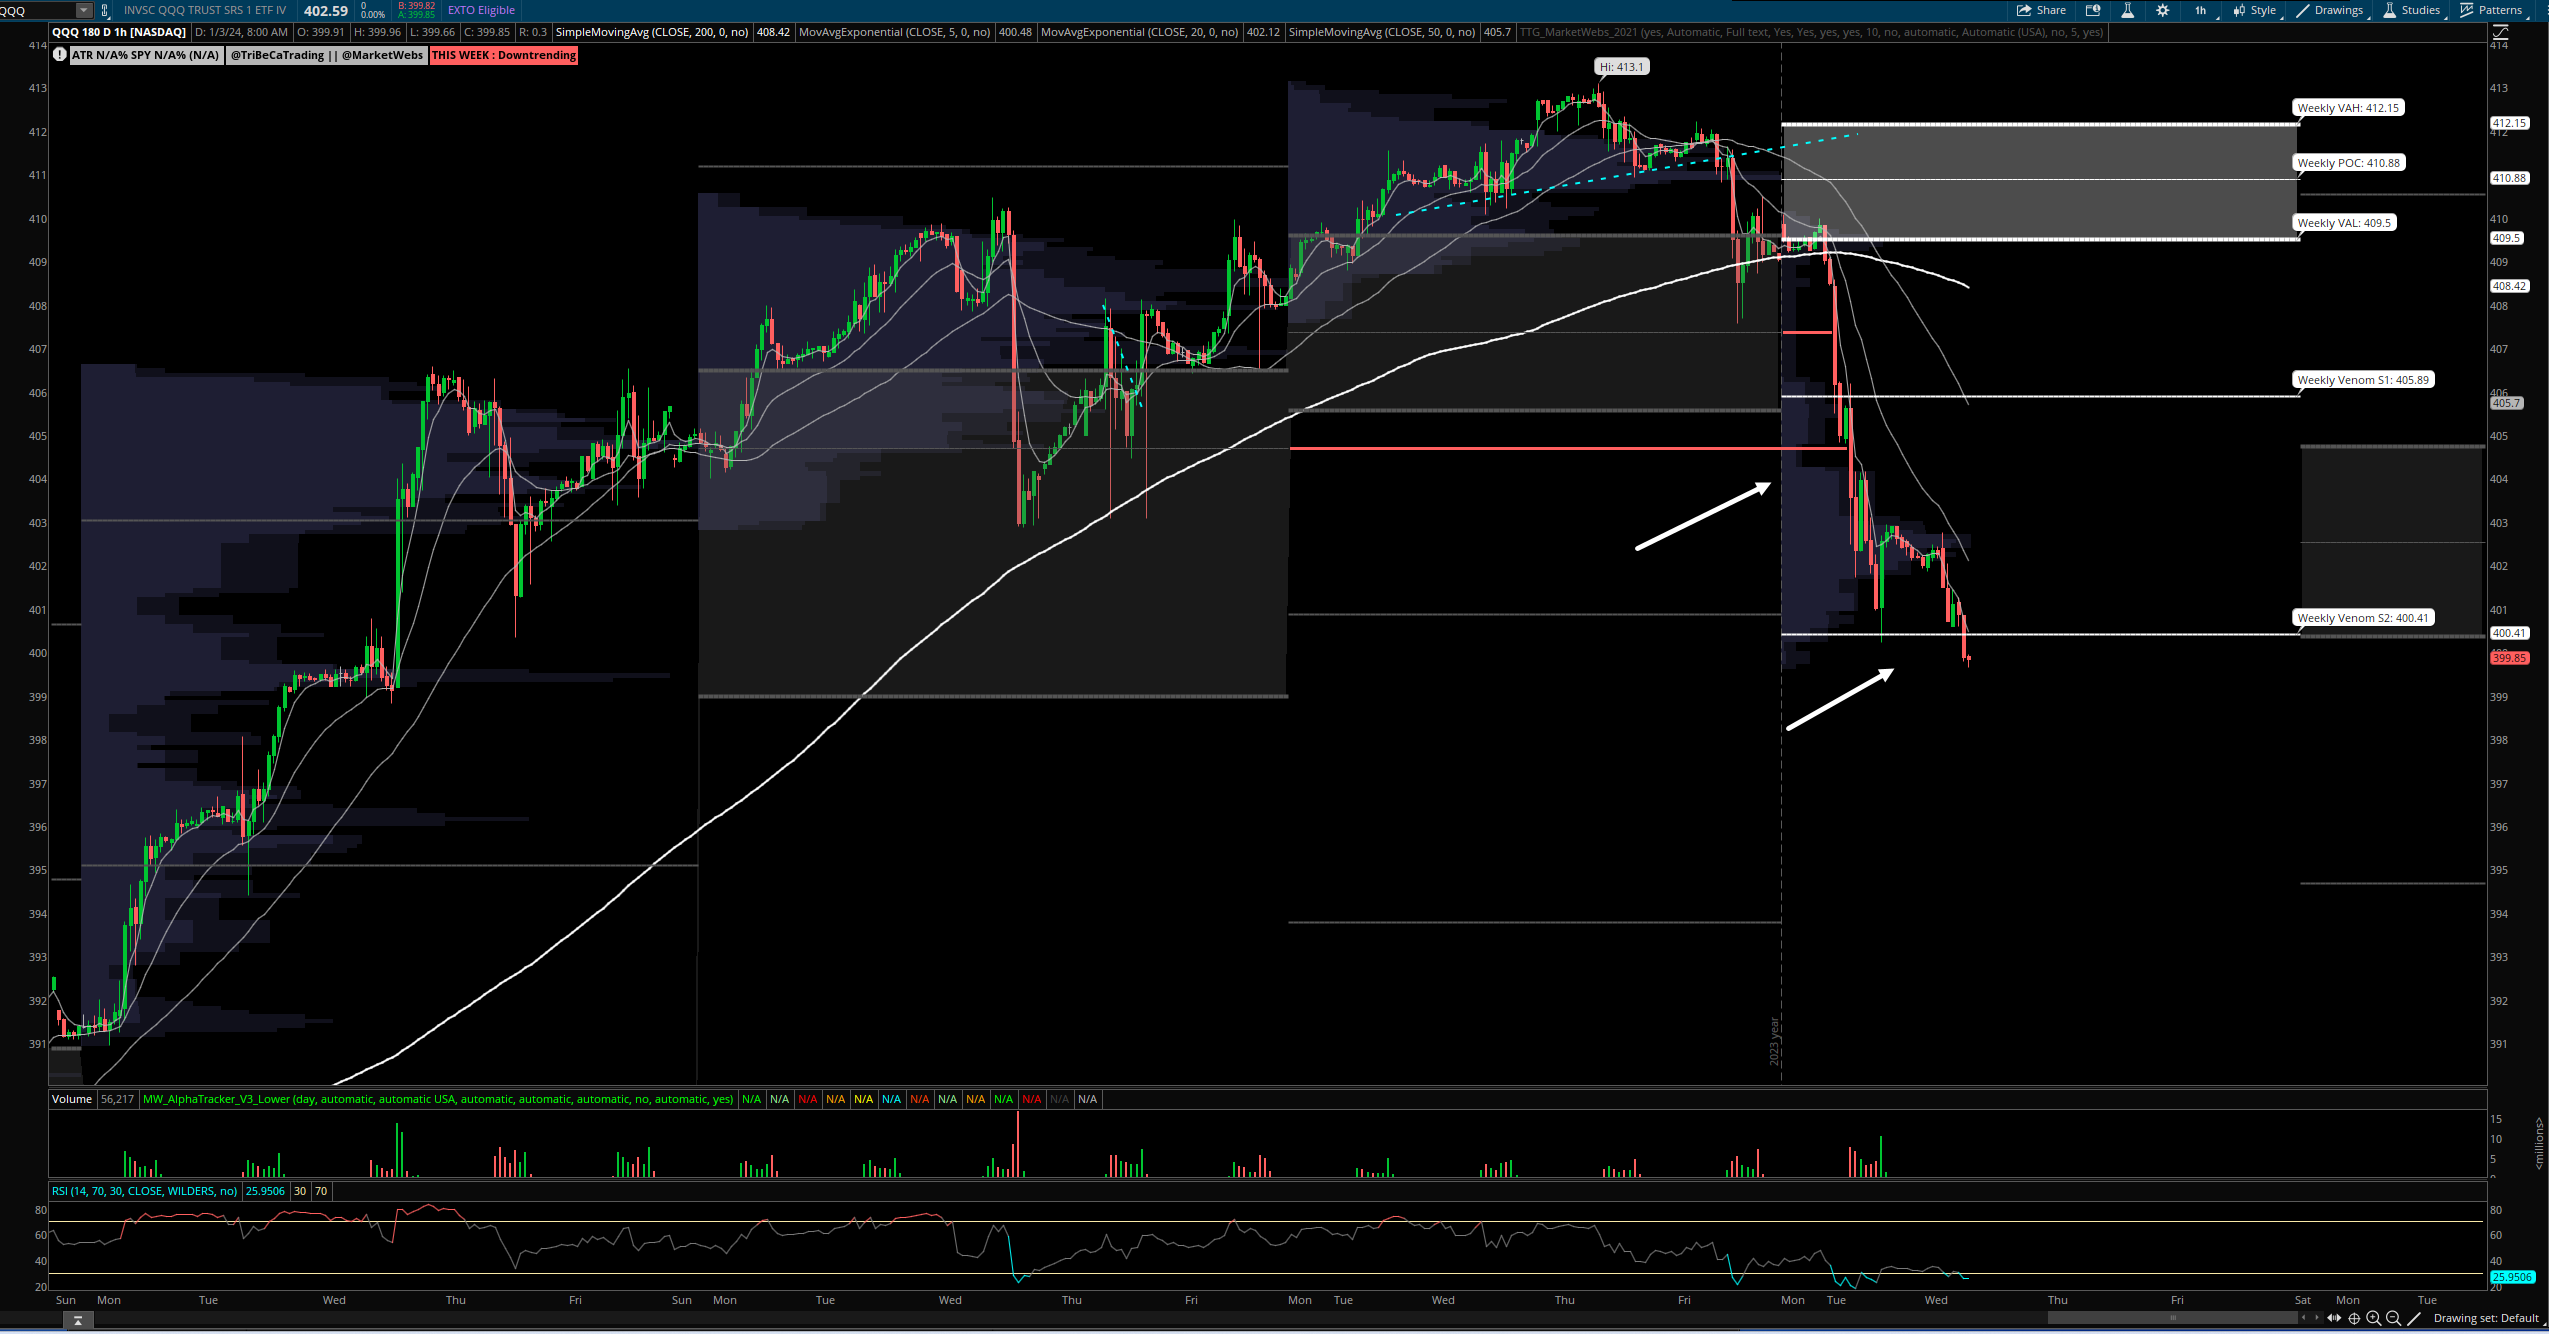
1hr chart: Price through its 2nd extension from this week's Value Area, keep an eye on $400.41 and yesterday's low as there is not a major support level nearby
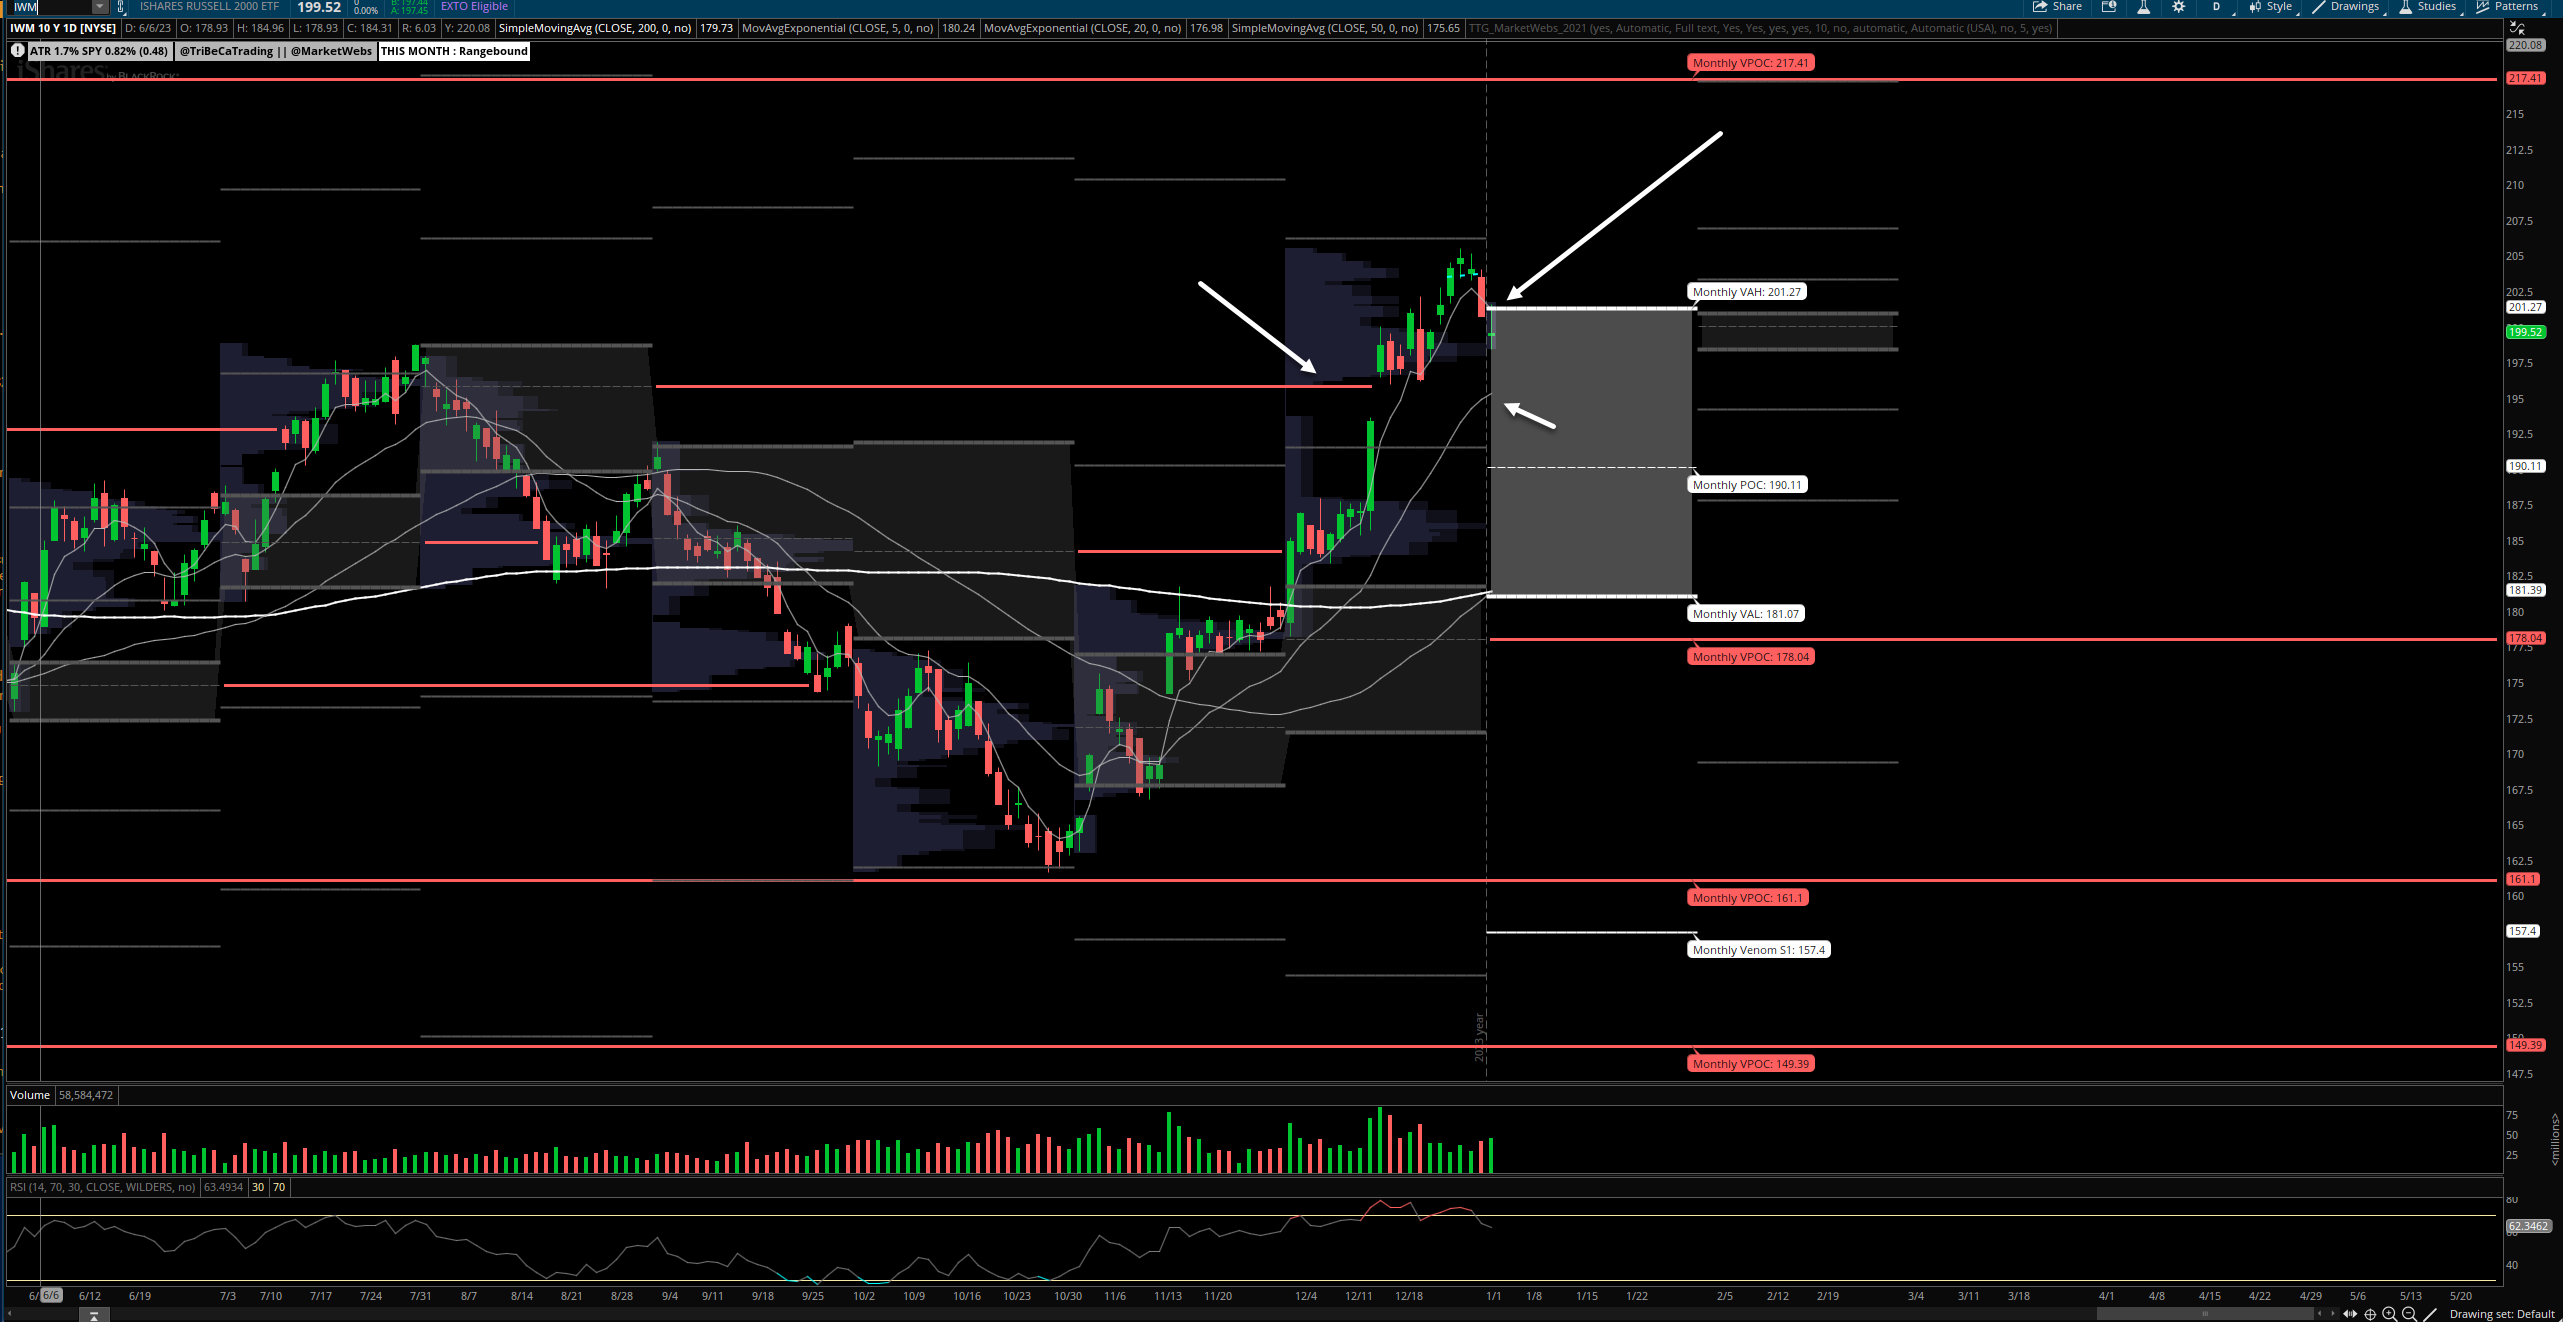
IWM - Russell Small Cap ETF- Daily Chart: Price ind -1% and moving towards its 20d EMA and previous VPOC (red line) takeout which may provide some support
1hr chart: Price has moved lower than the 1hr VPOC (red line) let's see if that can be retaken as the VPOCs usually provide some support as they represent a possible demand area on the downside
Here is today’s TTG Proprietary Stock Screen “Out of the Box” using Volume At Price
names trending above their Value Areas (on 3 multiple timeframes & not super extended)
Keep reading with a 7-day free trial
Subscribe to The Tribeca Trade Group to keep reading this post and get 7 days of free access to the full post archives.