

TTG Index Charts & Out of the Box Stock Screen 2/23/24 $AIG
TTG Index Charts & Out of the Box Stock Screen 2/23/24 $AIG
Out of the Box MarketWebs Screen
US Dollar -0.2% / 30yr Bonds +0.1% / Crude -1.7% & Nat Gas -4.9% / Gold +0.4% / Copper -0.5% / BTC -2.3%
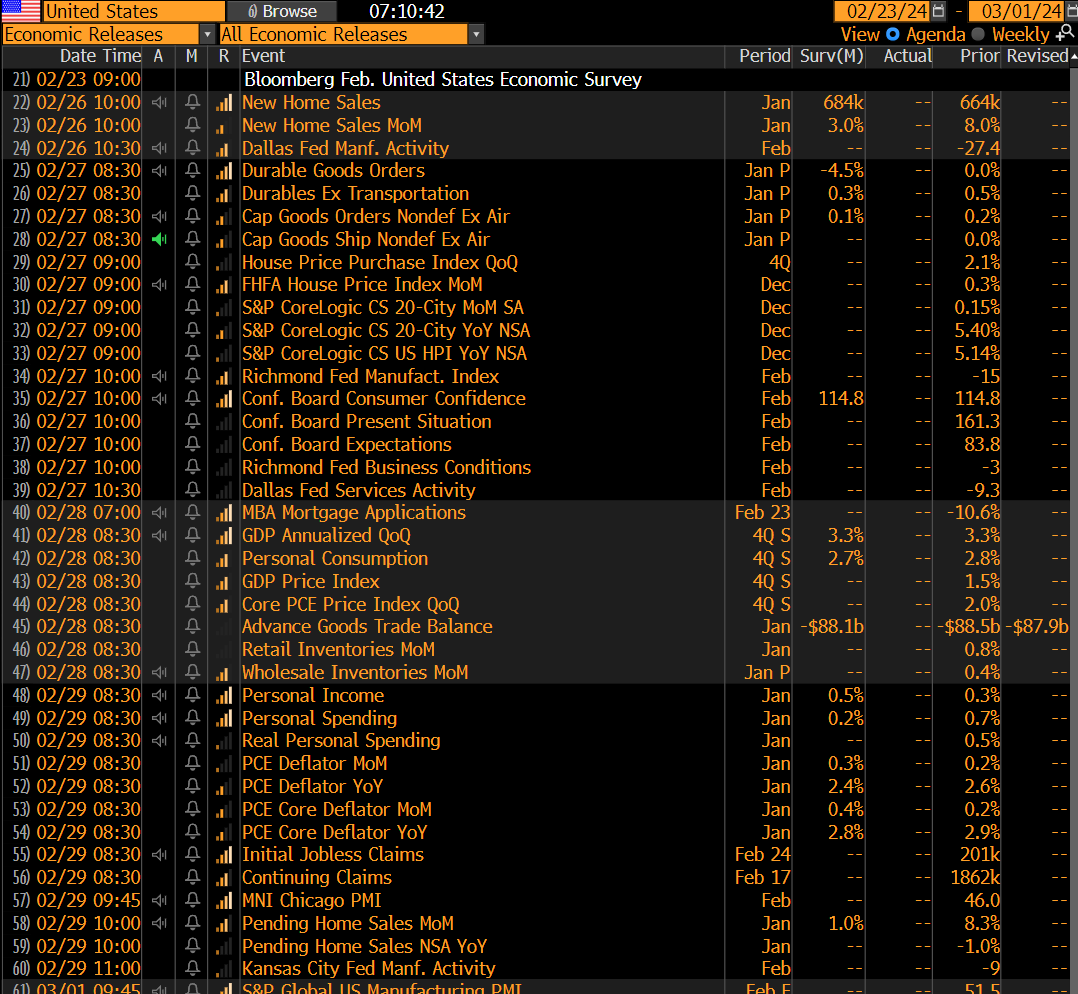
US Upcoming Economics
Index Updates
At TTG, I use Volume At Price in my chart analysis and I use the MarketWebs Indicator to provide Value Areas & VPOCs which indicate significant support & resistance levels. Learn More Here about Volume At Price and the MarketWebs.
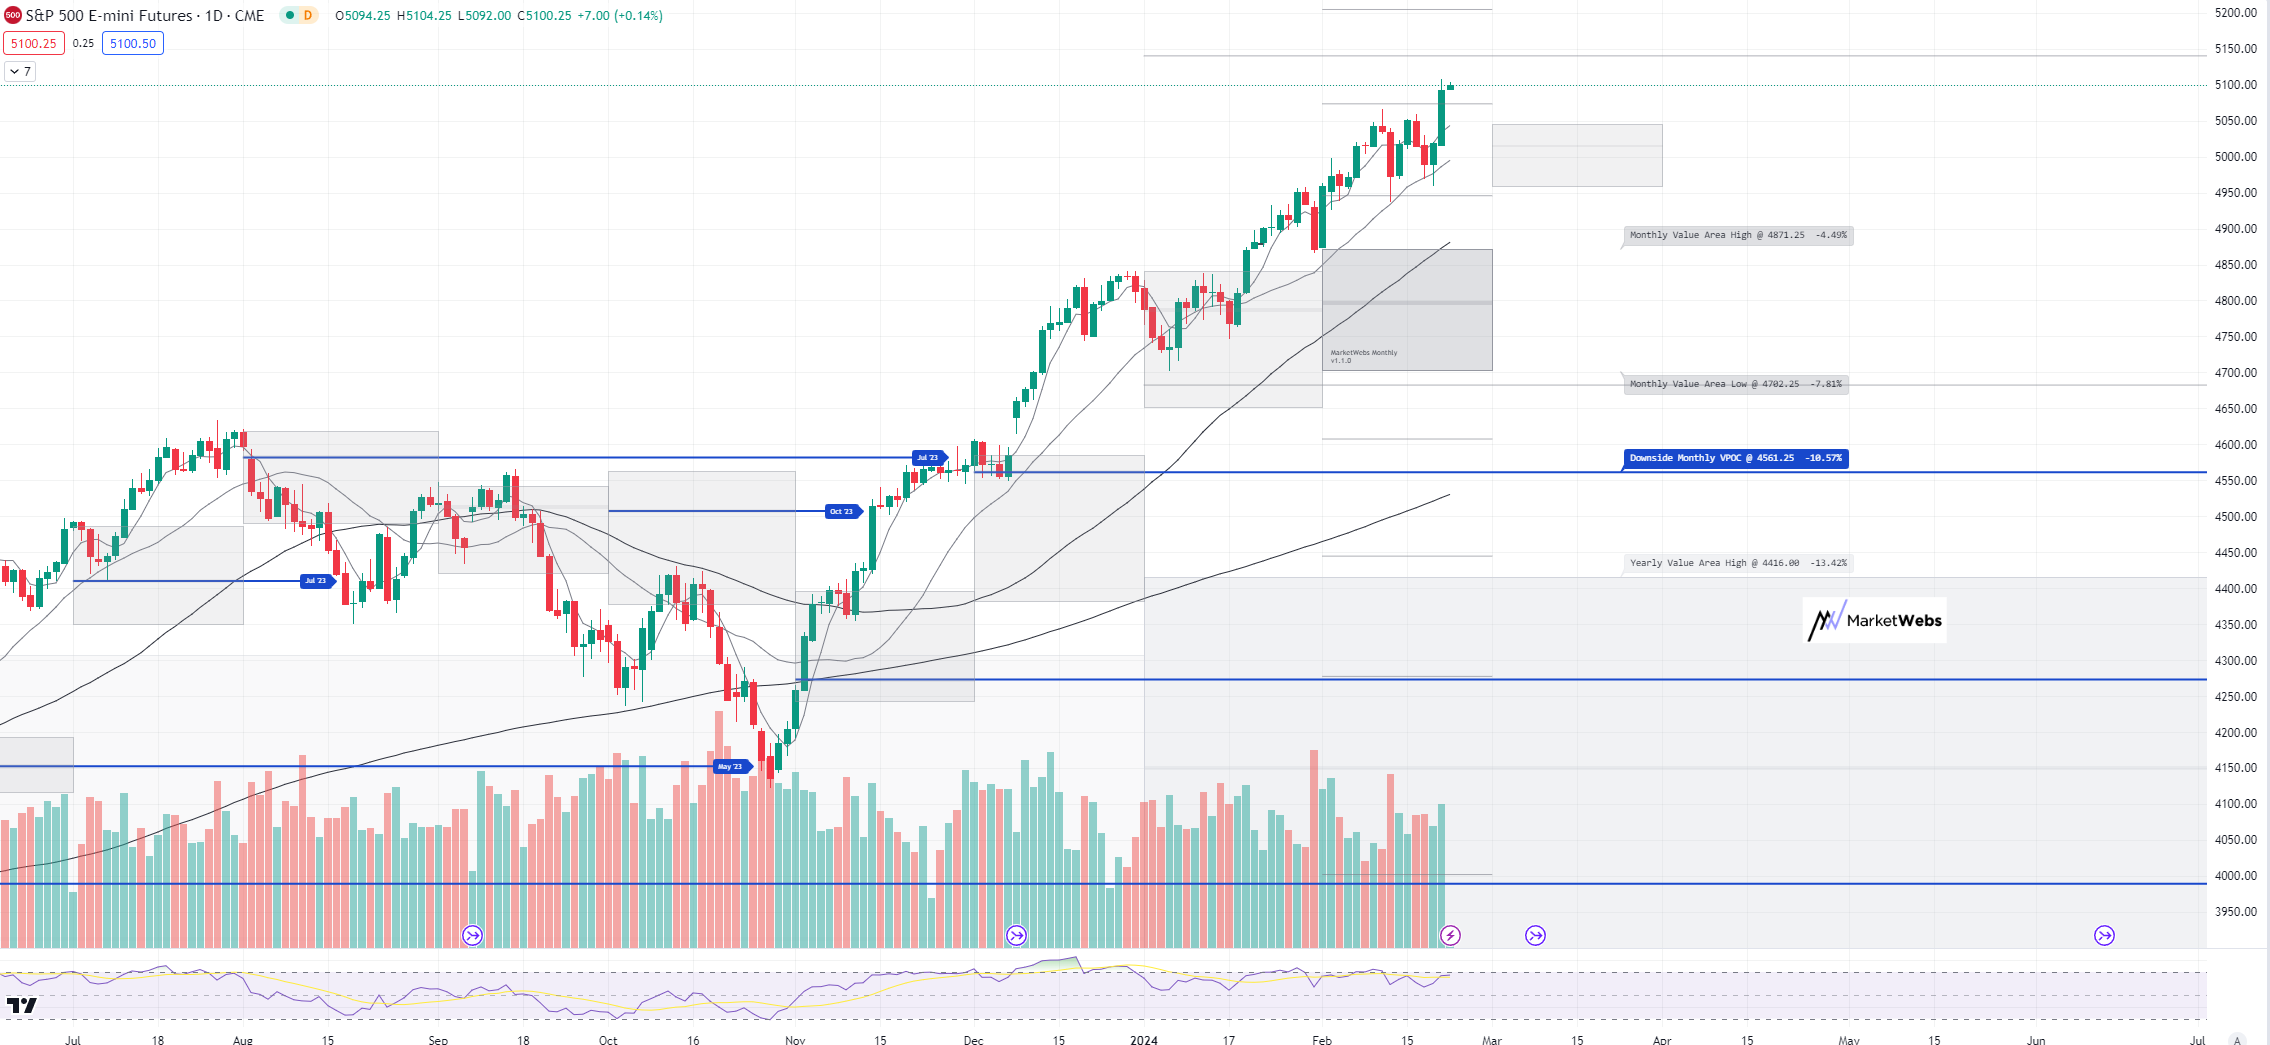
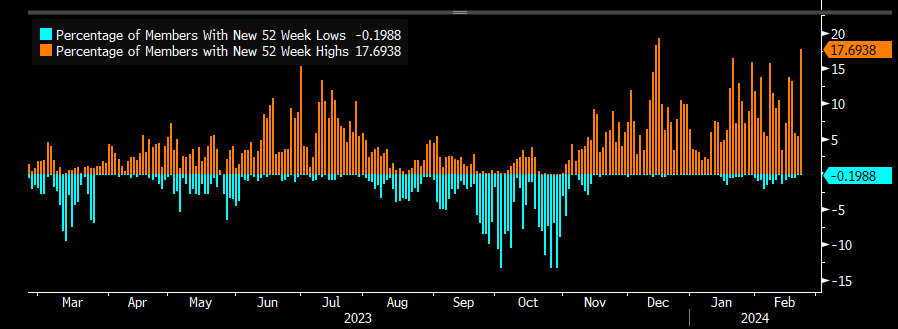
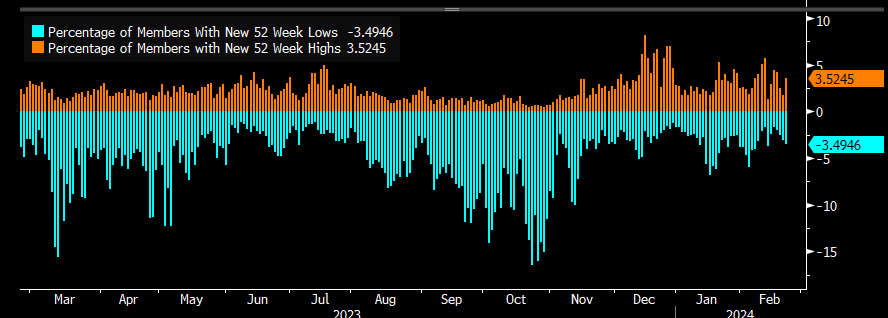
ES_F - SPX Futures - Price ~ flat this morning after a big rally day that pushed the S&P out to new highs. There has been a good amount of arguments on breadth and I have included a chart of the SPX 52 week new highs vs new lows, and currently, I do not see a divergence - new highs remain strong and new lows are weak , this is similar with 4wk new highs vs new lows. Sectors like Industrials, Financials, Health Care have been the strongest. Will continue to monitor for changes.
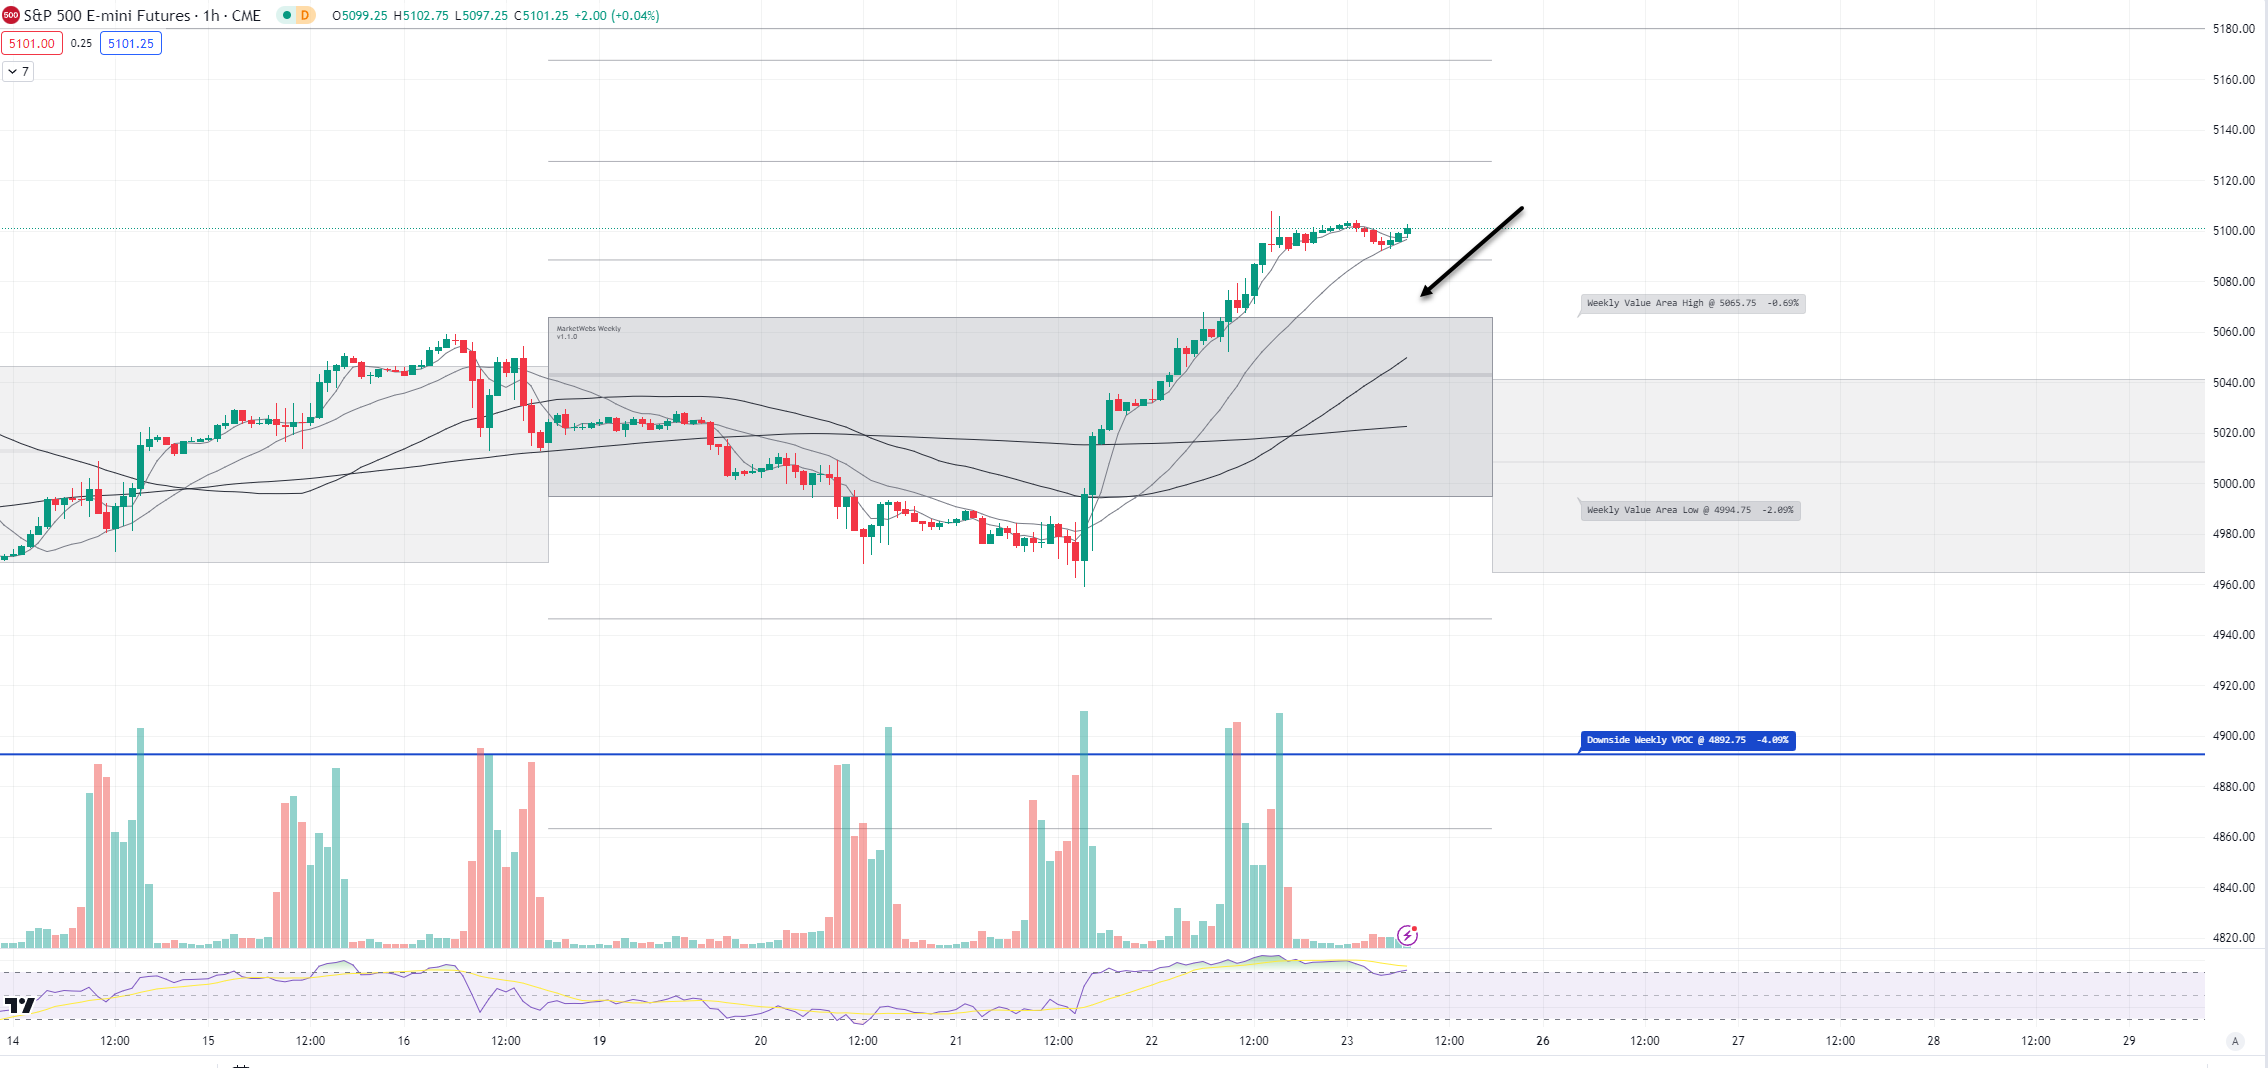
1hr chart: Price is above its Value Area for the week
QQQ - NDX 100 ETF - Daily chart: Price is also flat this morning after a big rally yesterday, QQQ +2.9%, and this is a bit more of an intriguing chart vs the S&P... price did not make a new high here yesterday so that will be interesting to watch today and next week whether price can climb out to new highs.
Note, as discussed in the S&P section, the strength (outside of NVDA , SMCI and a few other tech names) has been Industrials, Financials, and HC, so will watch for Tech / Discretionary groups which will need to be stronger for new highs in QQQ.
1hr chart: Price above this week's Value Area, support $435.5

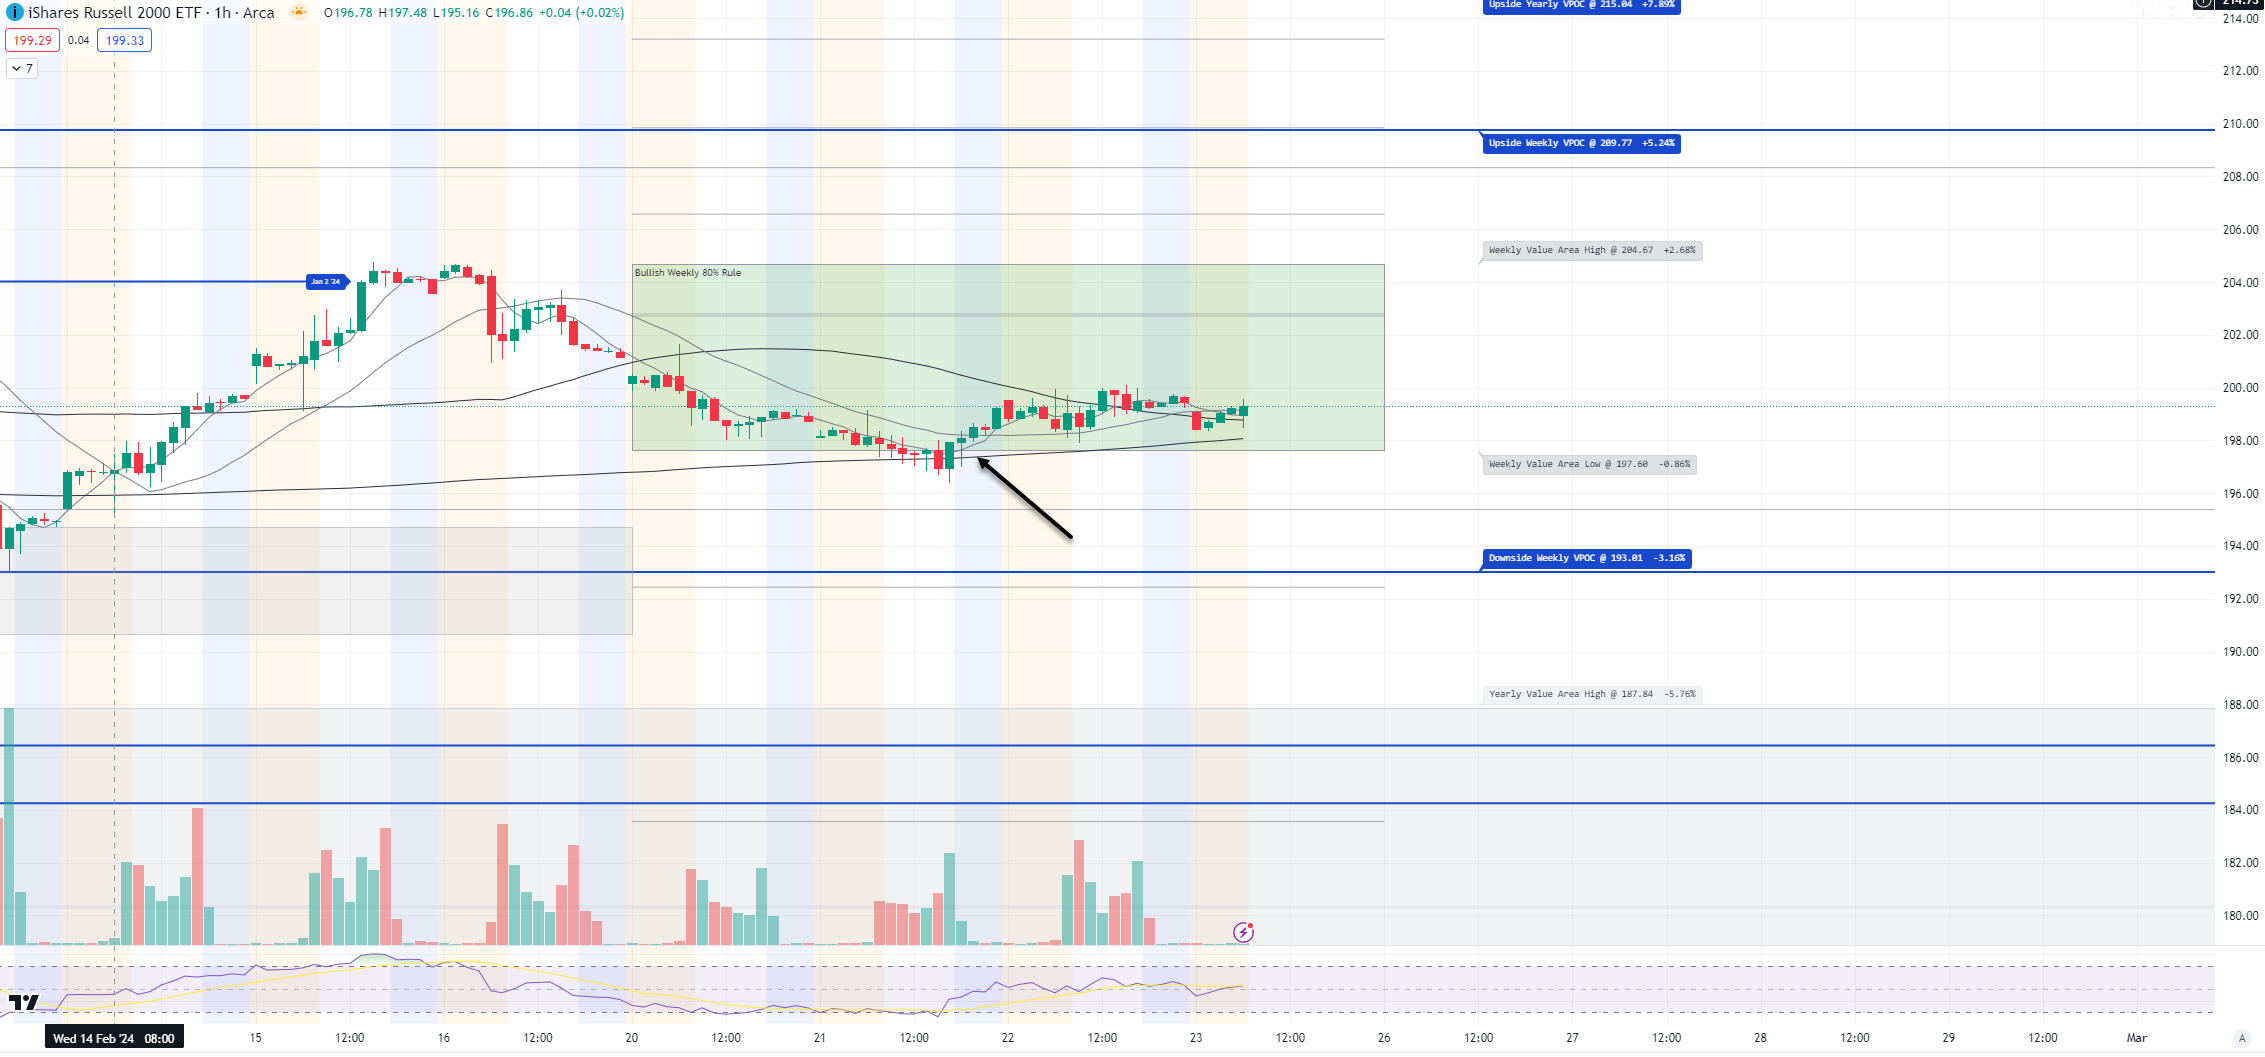
IWM - Russell Small Cap ETF- Price ind. -0.2% and back above its Feb Value Area, support to watch $197.76. Also, that 50d MA continues to hold.
I thought it would also be interesting to look at Nasdaq 52wk new highs vs new lows, and my conclusion is: this is a mess lol. It is a battleground with new highs vs new lows and that is also what the price action is indicating too me. So while IWM continues to bounce off that 50d MA , it is not doing much else and not compelling me to do much in this space.

1hr chart: Price held and remains inside its Value Area for week, levels to watch below
Here is today’s TTG Proprietary Stock Screen “Out of the Box” using Volume At Price
names trending above their Value Areas (on 3 multiple timeframes & not super extended)
Keep reading with a 7-day free trial
Subscribe to The Tribeca Trade Group to keep reading this post and get 7 days of free access to the full post archives.