

TTG Index Charts & Out of the Box Stock Screen 01/30/24
TTG Index Charts & Out of the Box Stock Screen 01/30/24
Out of the Box MarketWebs Screen
US Dollar -0.2% / 30yr Bonds +0.4% / Crude -0.9% & Nat Gas +1.6% / Gold +0.4% / Copper -0.1% / BTC +0.5%
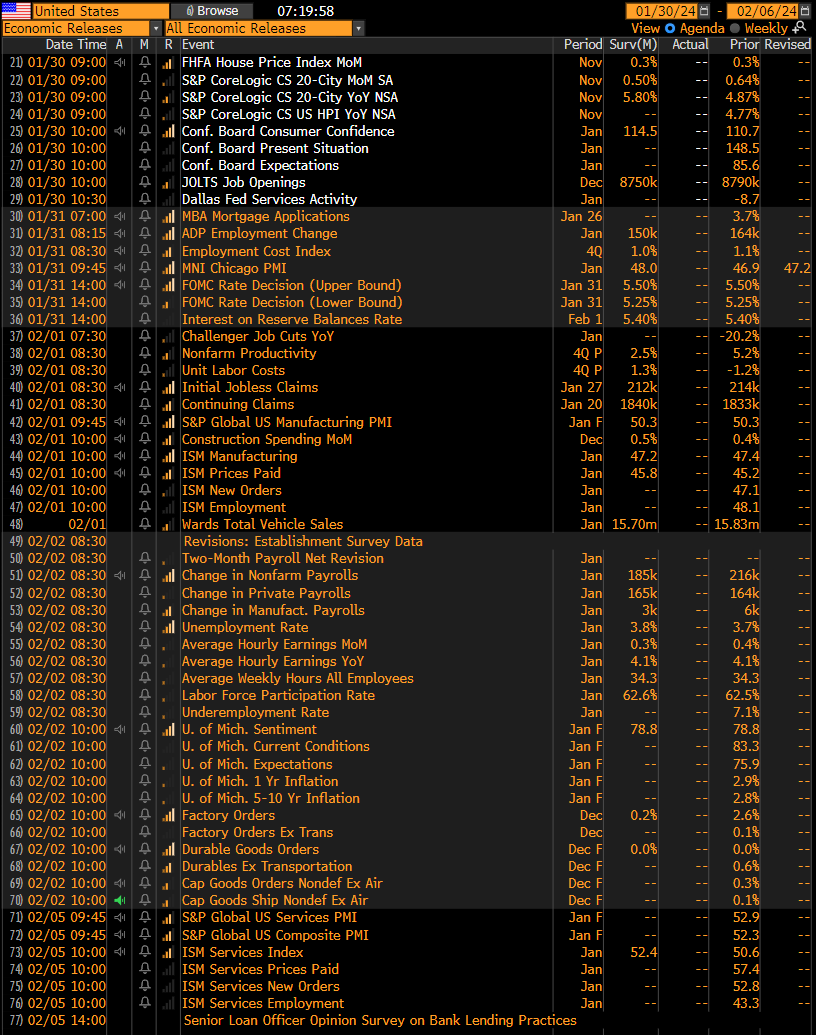
US Upcoming Economics
US Bond Yields
Index Updates
At TTG, I use Volume At Price in my chart analysis and I use the MarketWebs Indicator to provide Value Areas & VPOCs which indicate significant support & resistance levels. Learn More Here about Volume At Price and the MarketWebs.
$ES_F- S&P Futures - Price continuing to trend above its Jan Value Area & its 5d short-term MA (Moving Average)
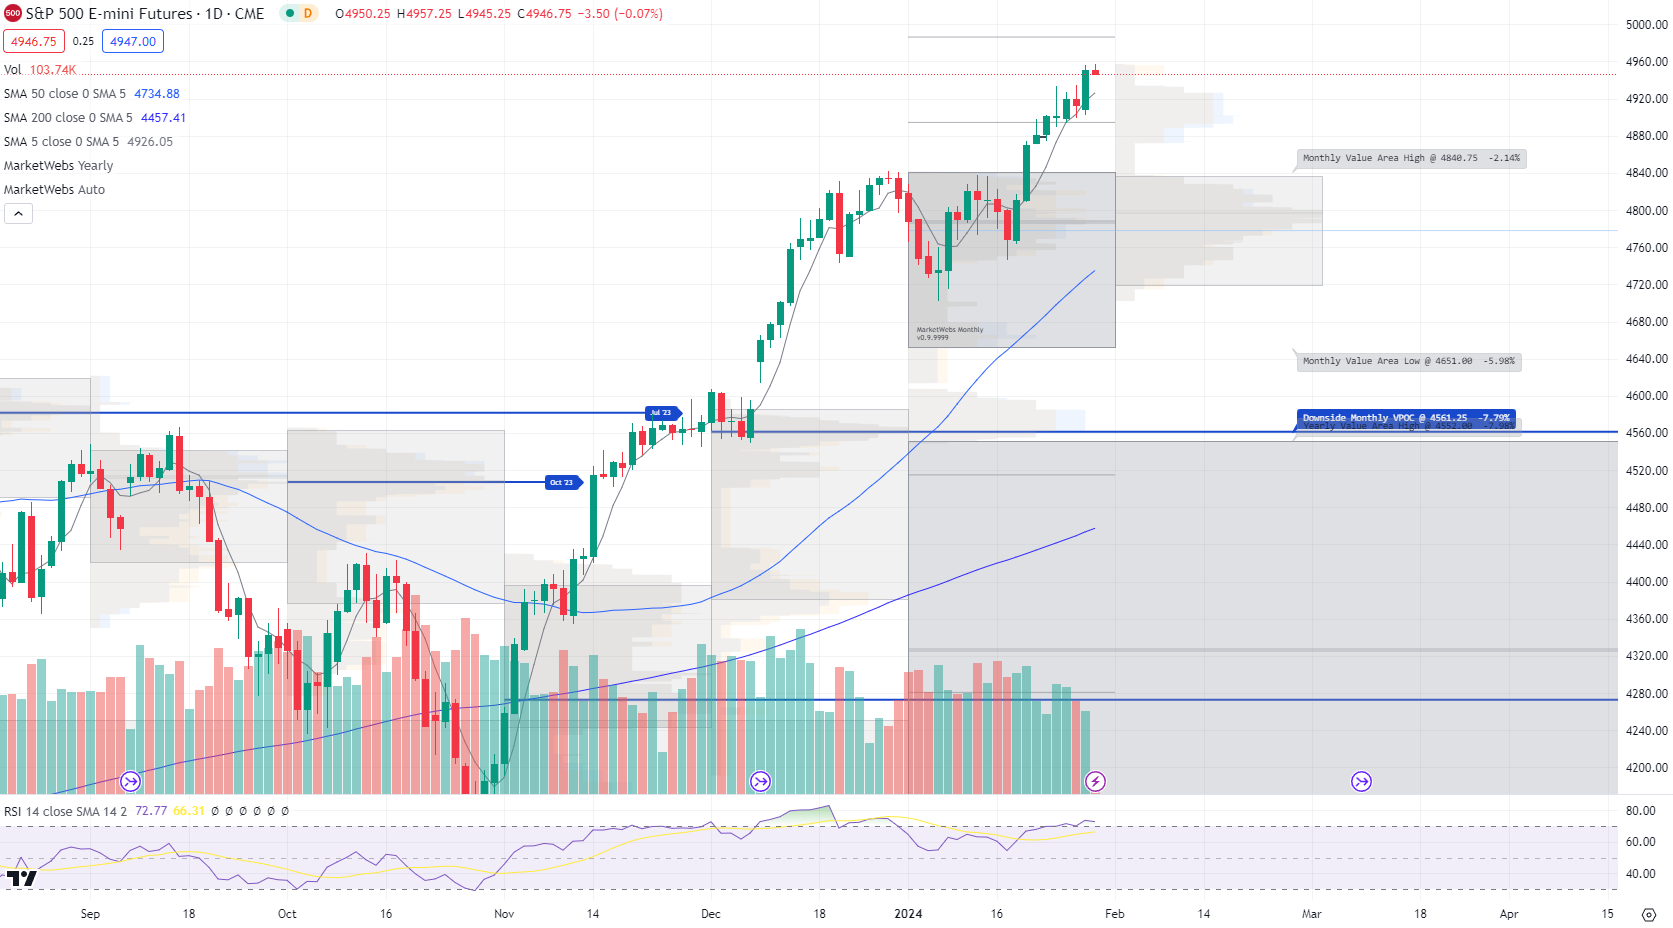
1hr chart: Price rallied above its Value Area for the week, what was resistance is now support, 4919.75

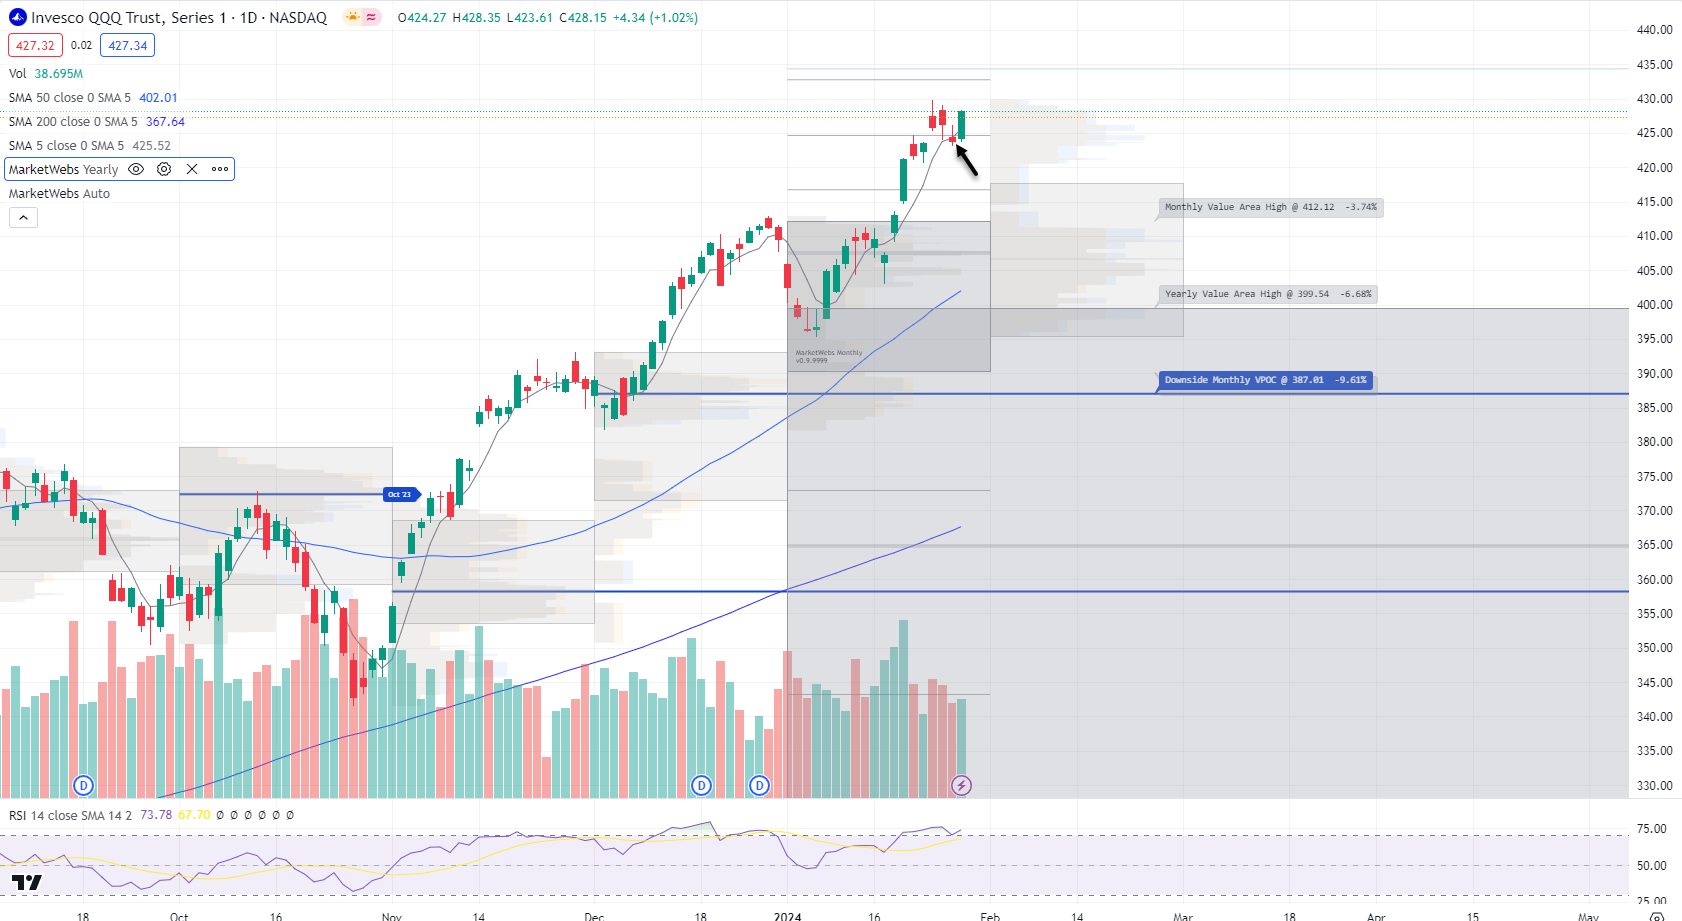
QQQ - NDX 100 ETF - Daily chart: Price ind. -0.2% this morning & yesterday rallied and price maintained above its 5d MA so short term uptrend remains intact.
Reminder that QQQ / NDX has a huge week of earnings with MSFT AMD GOOGL reporting on 1/30; AAPL AMZN GOOGL reporting 2/1
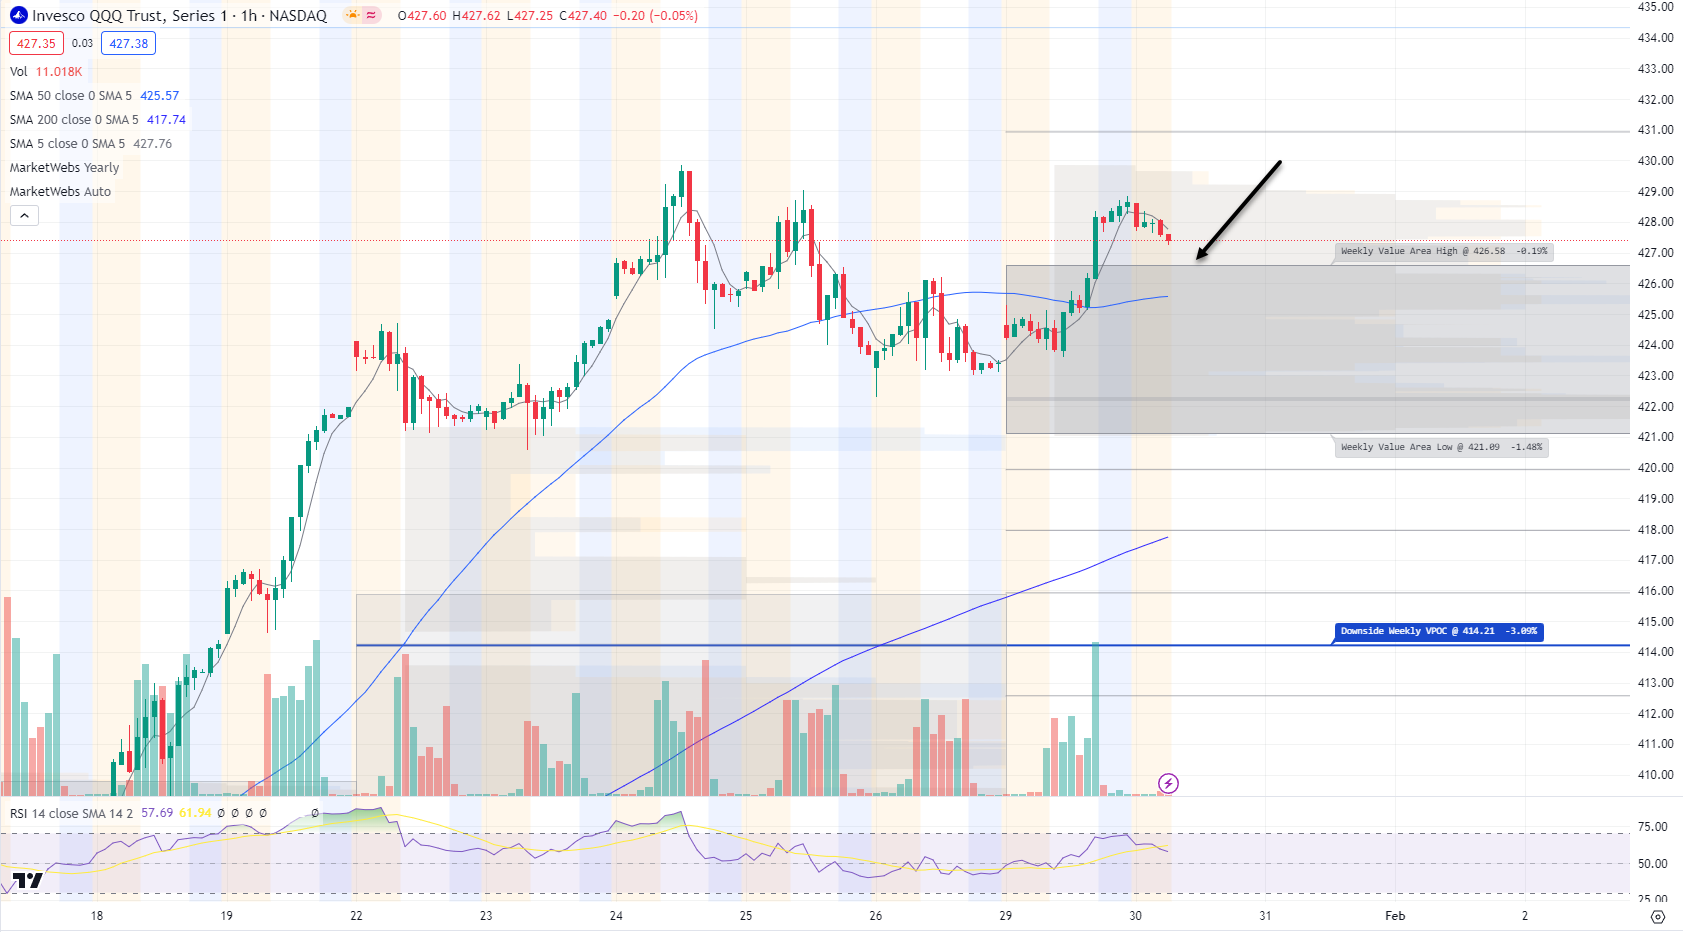
1hr chart: Price above its Value Area for the week, support $426.58
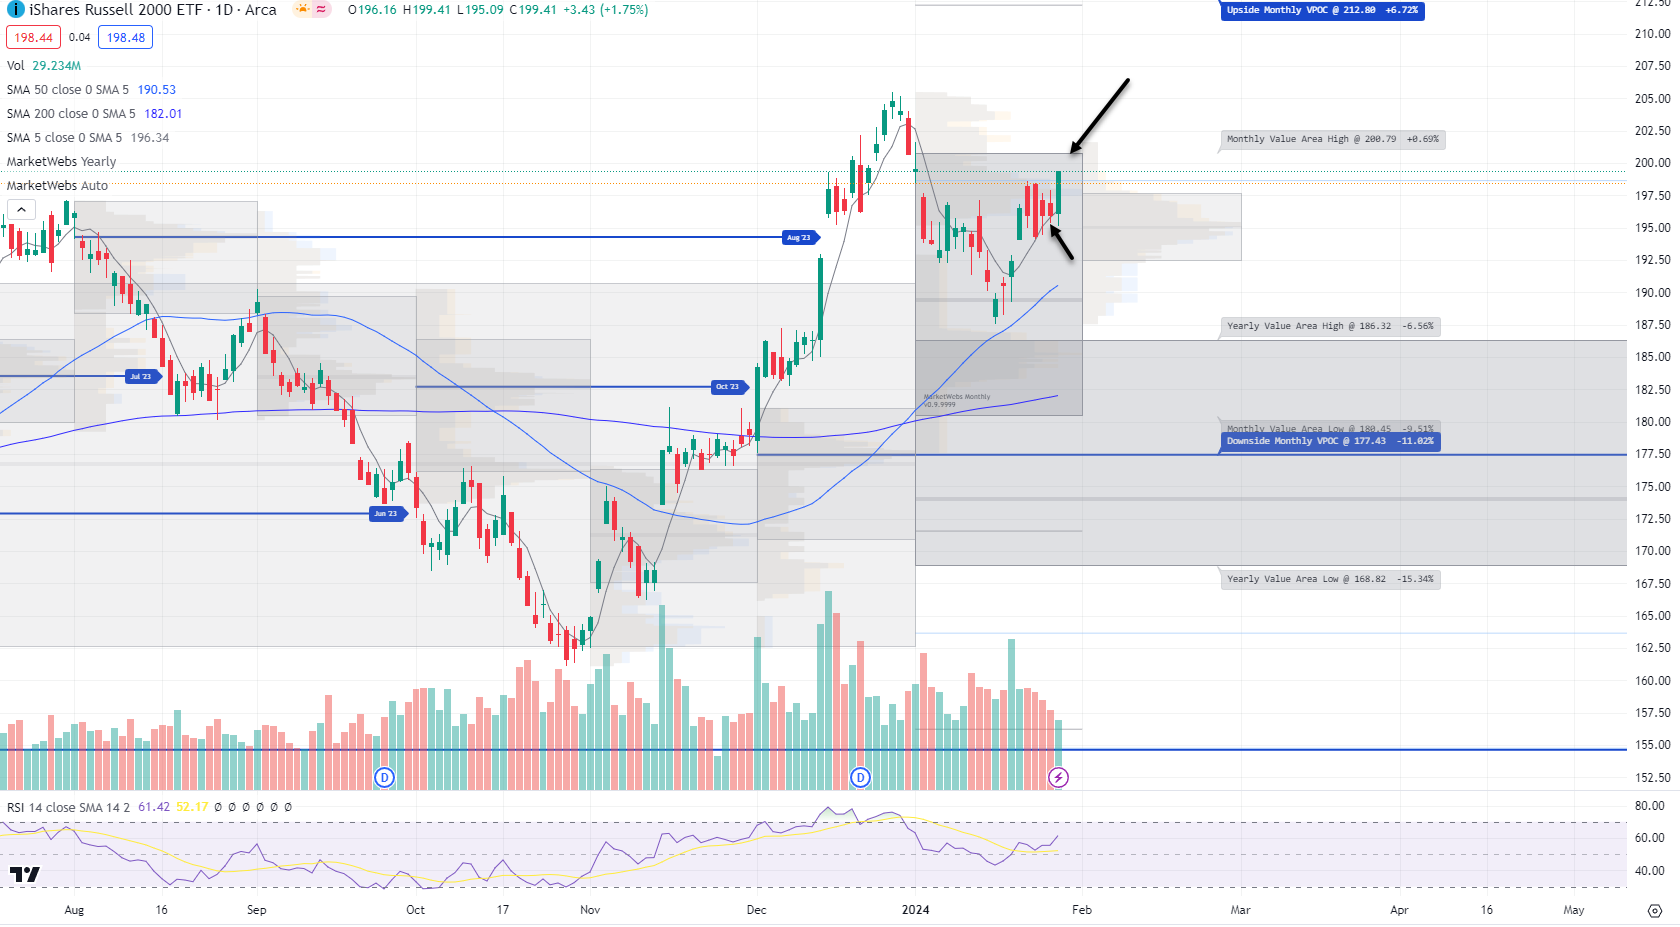
IWM - Russell Small Cap ETF- Big gains yesterday for IWM +1.8% and a nice way to get out of its recent range. Now, watch the top of the Jan Value Area, resistance $200.79
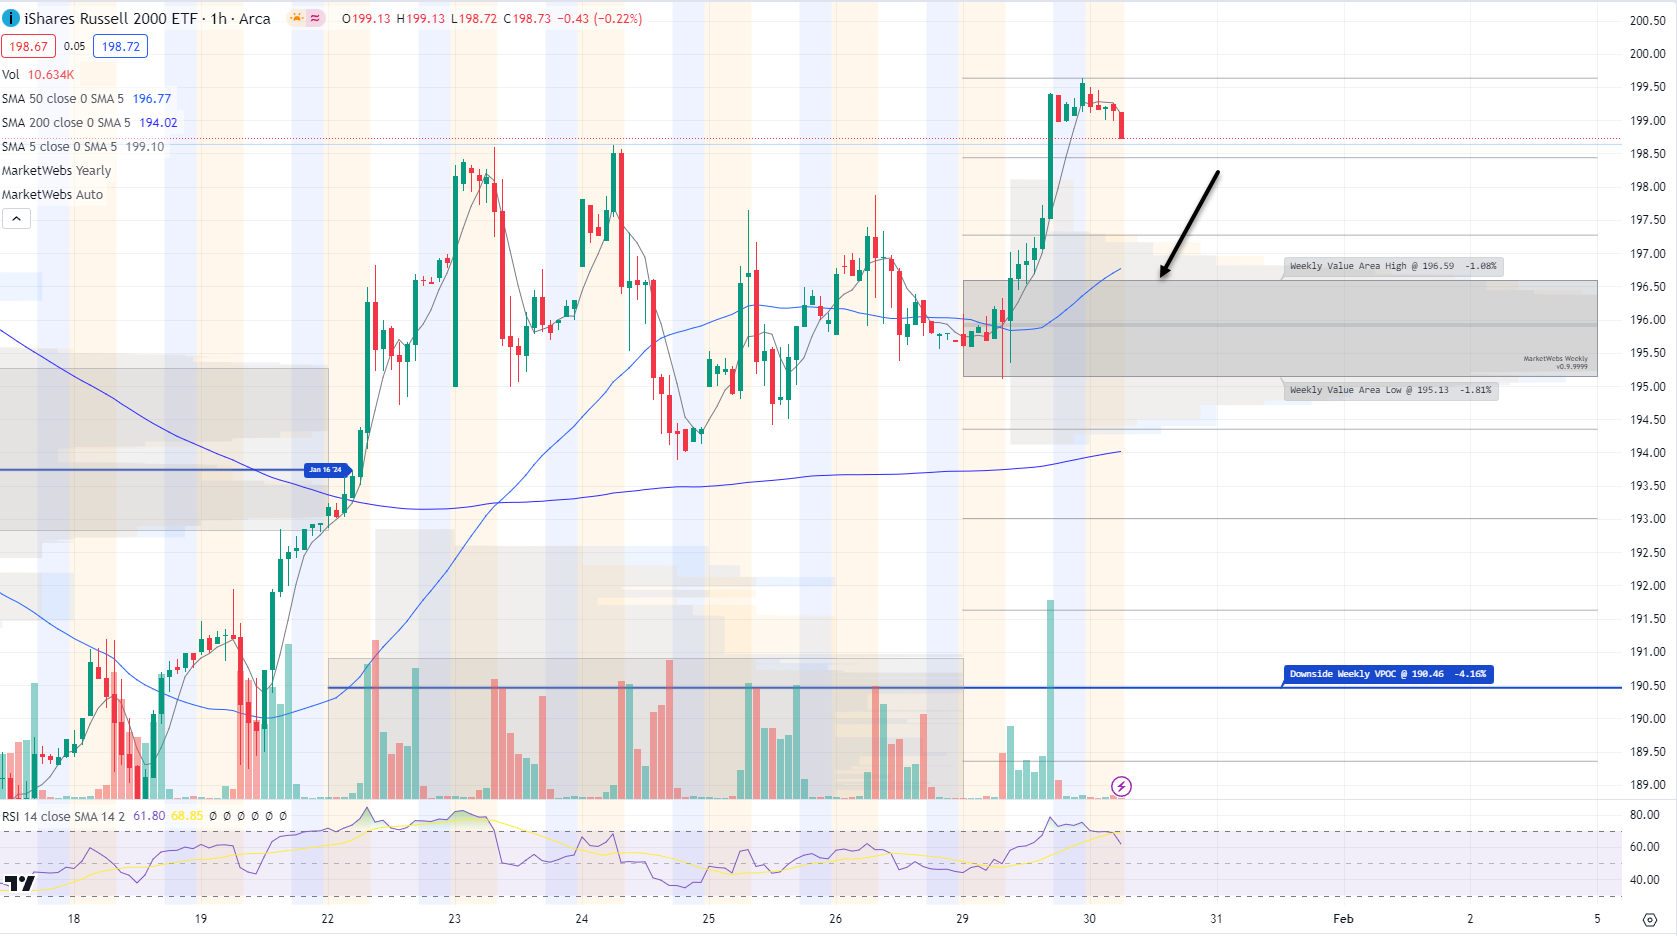
1hr chart: Price now decently above its Value Area for the week and also notable price above last week's highs, that will be something to watch the rest of the week if price can maintain above those highs from last week
Here is today’s TTG Proprietary Stock Screen “Out of the Box” using Volume At Price
names trending above their Value Areas (on 3 multiple timeframes & not super extended)
Keep reading with a 7-day free trial
Subscribe to The Tribeca Trade Group to keep reading this post and get 7 days of free access to the full post archives.