

TTG Index Charts & Out of the Box Stock Screen 2/6/24 $ABBV
TTG Index Charts & Out of the Box Stock Screen 2/6/24 $ABBV
Out of the Box MarketWebs Screen
US Dollar flat / 30yr Bonds +0.1% / Crude +1.0% & Nat Gas -1.2% / Gold +0.1% / Copper +0.1% / BTC +1.0%
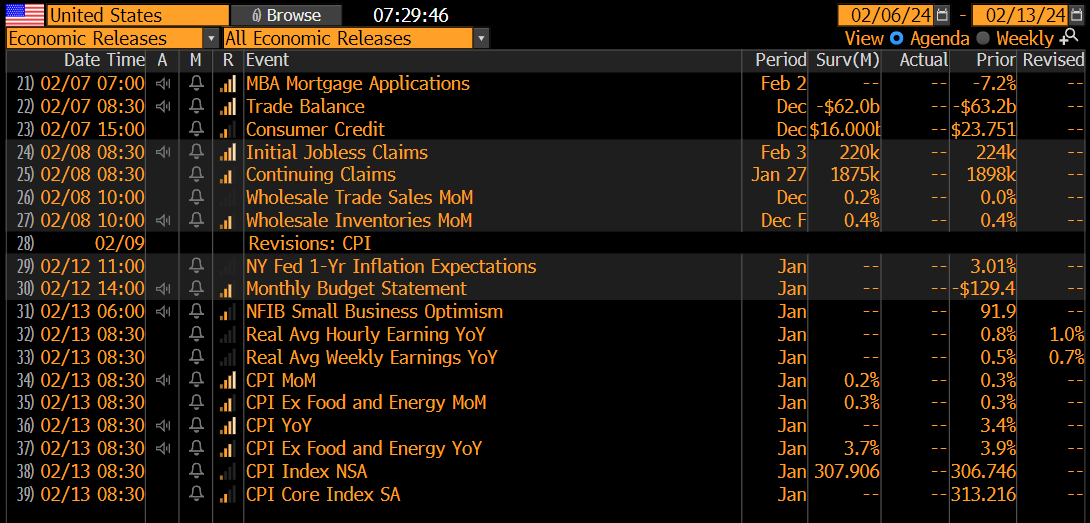
US Upcoming Economics
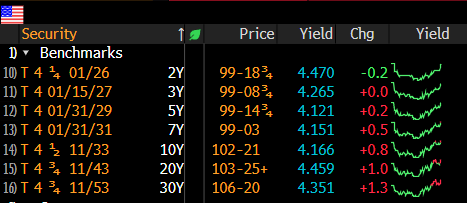
US Bond Yields
Index Updates
At TTG, I use Volume At Price in my chart analysis and I use the MarketWebs Indicator to provide Value Areas & VPOCs which indicate significant support & resistance levels. Learn More Here about Volume At Price and the MarketWebs.
ES_F - SPX Futures - Price ~ flat to start the day and despite some poor breadth (since the end of Dec) price remains above its 5d MA (Moving Average). So, the short term uptrend is intact even though there are divergences under the hood. In addition, we are dealing with Macro headwinds with higher rates and the dollar. This can either resolve (usually) in one of two ways 1. The Dollar / Rates decline and breadth improves 2. The SPX Index begins to follow breadth lower. I am watching price and its 5d MA - if price loses its short term MA, then we know the answer.
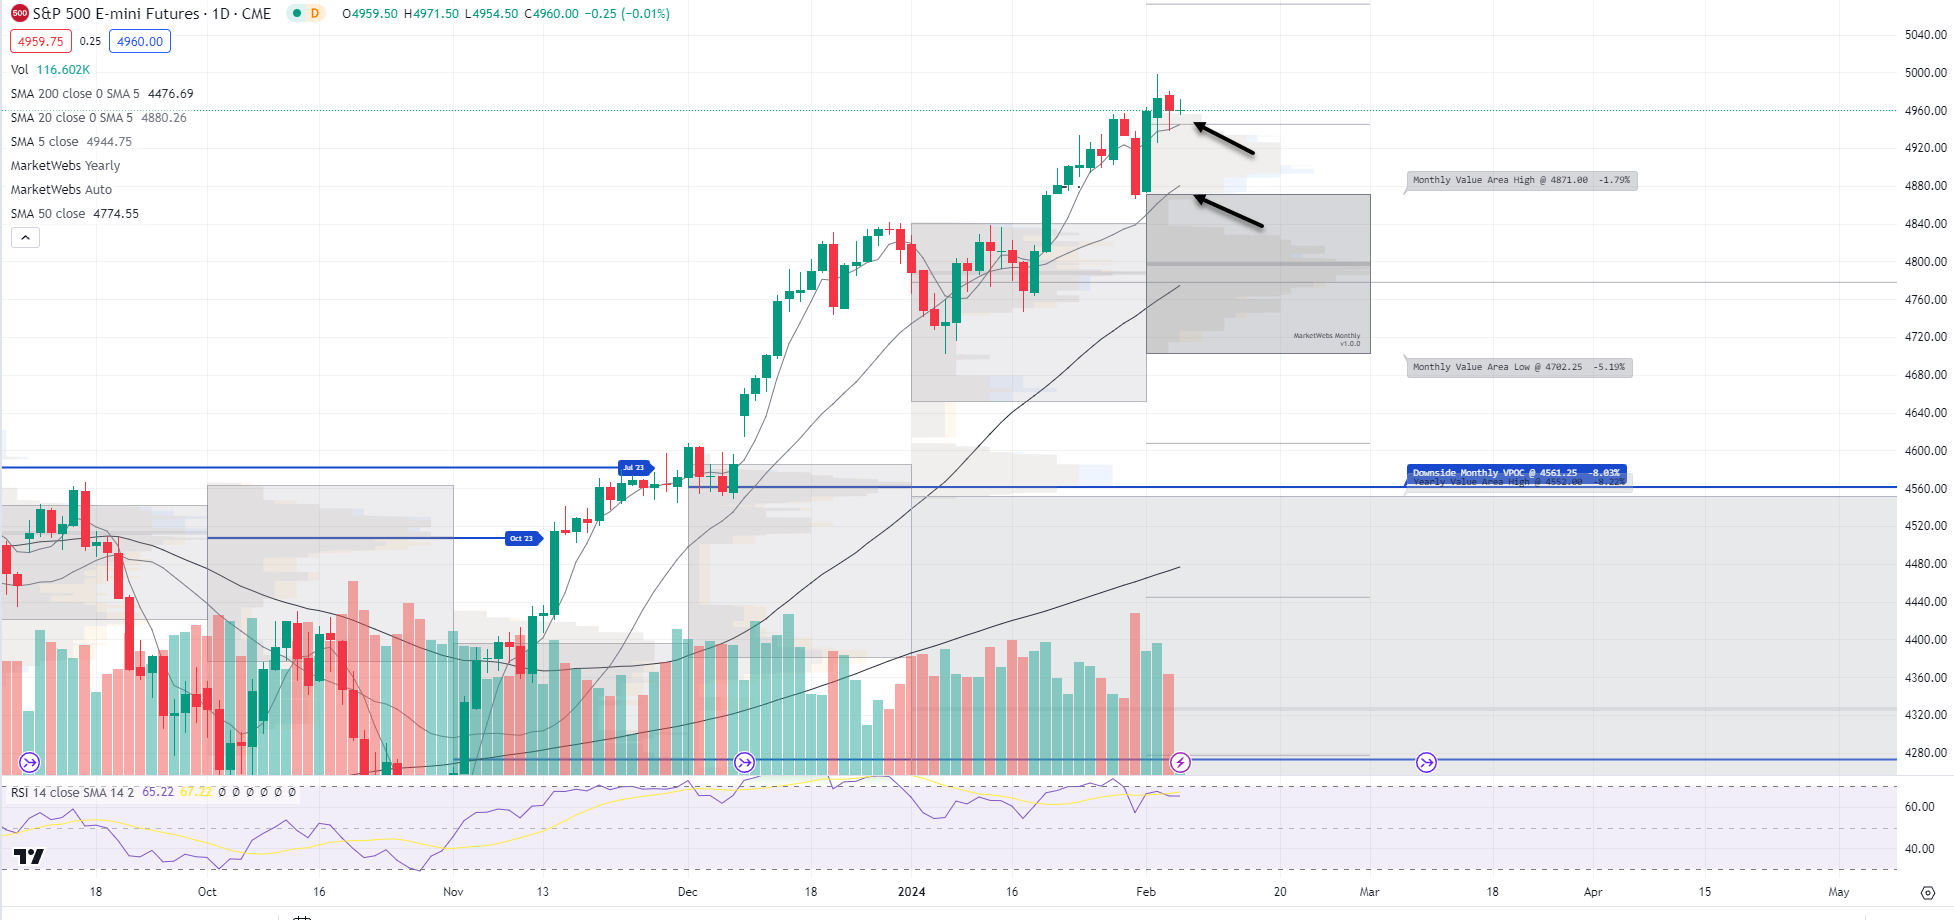
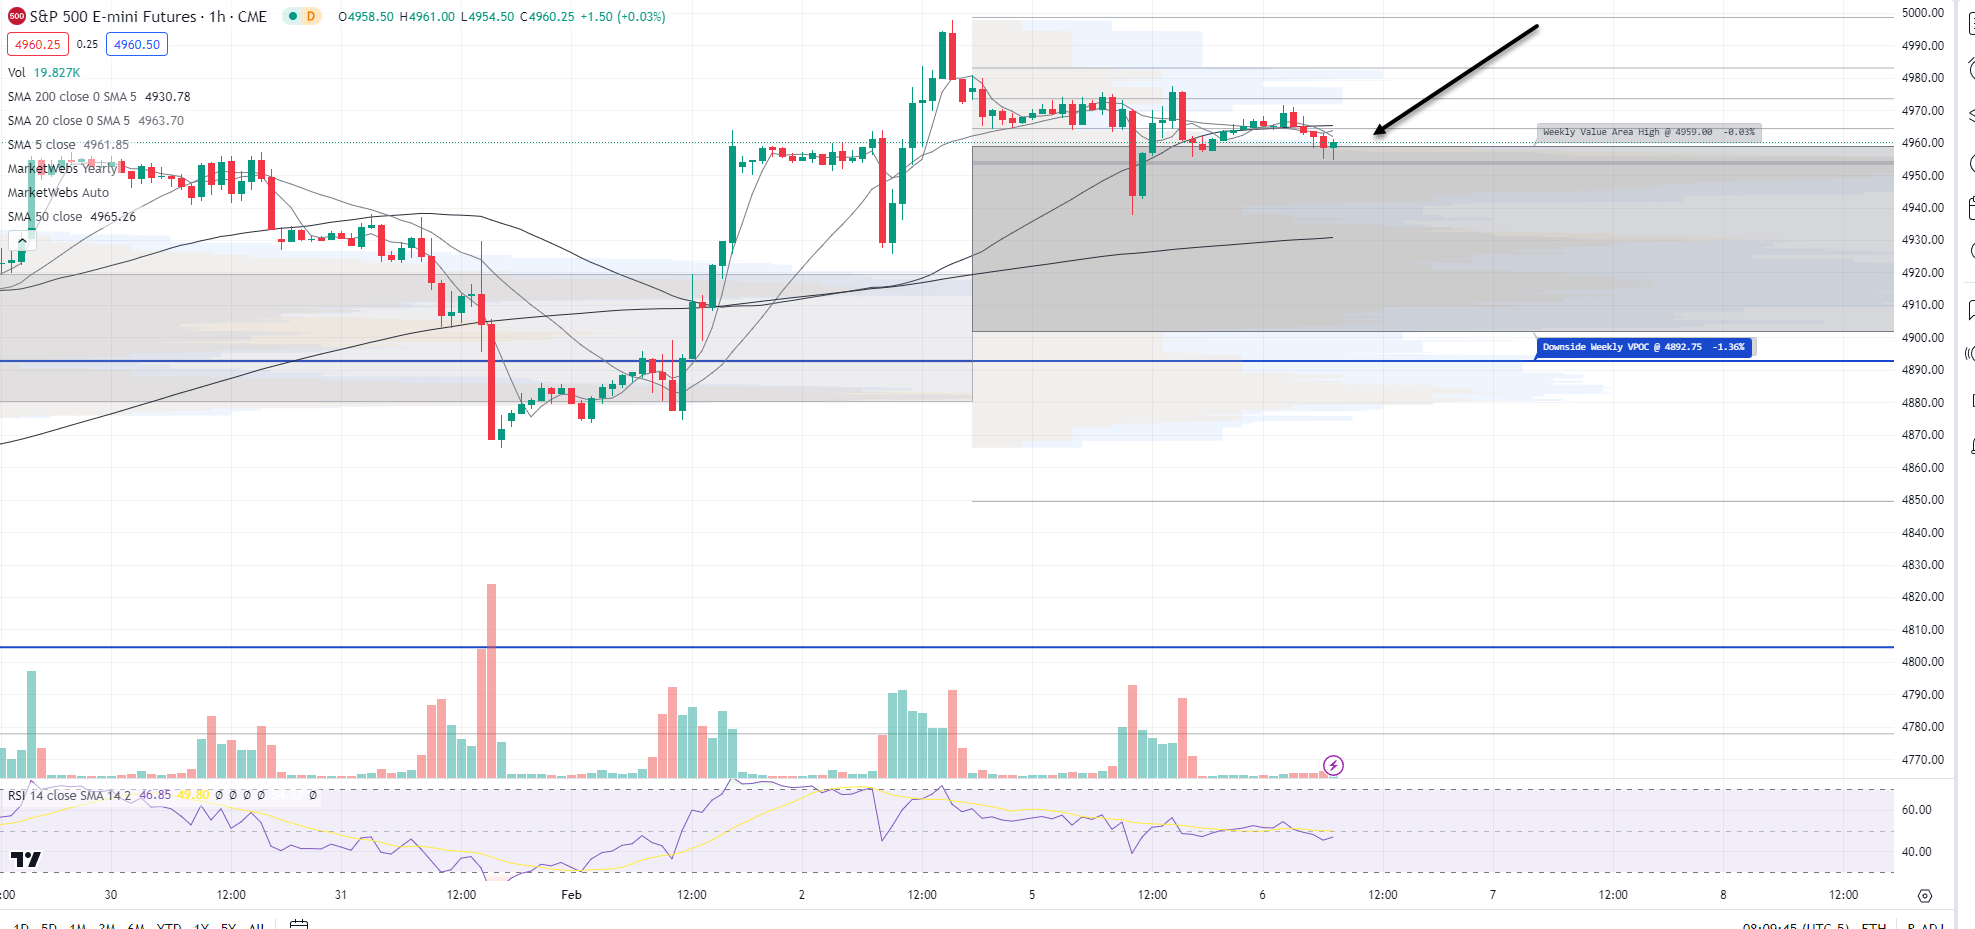
1hr chart: Also, a great short term level to watch here, 4959 the top of this week's Value Area - simply put --> if price remains above its Value Area for the week, not many adjustments needs to be made in my opinion.
QQQ - NDX 100 ETF - Daily chart: Price ind. +0.1% this mornings and is holding above its Feb Value Area and its 5d MA, support to watch $423.51
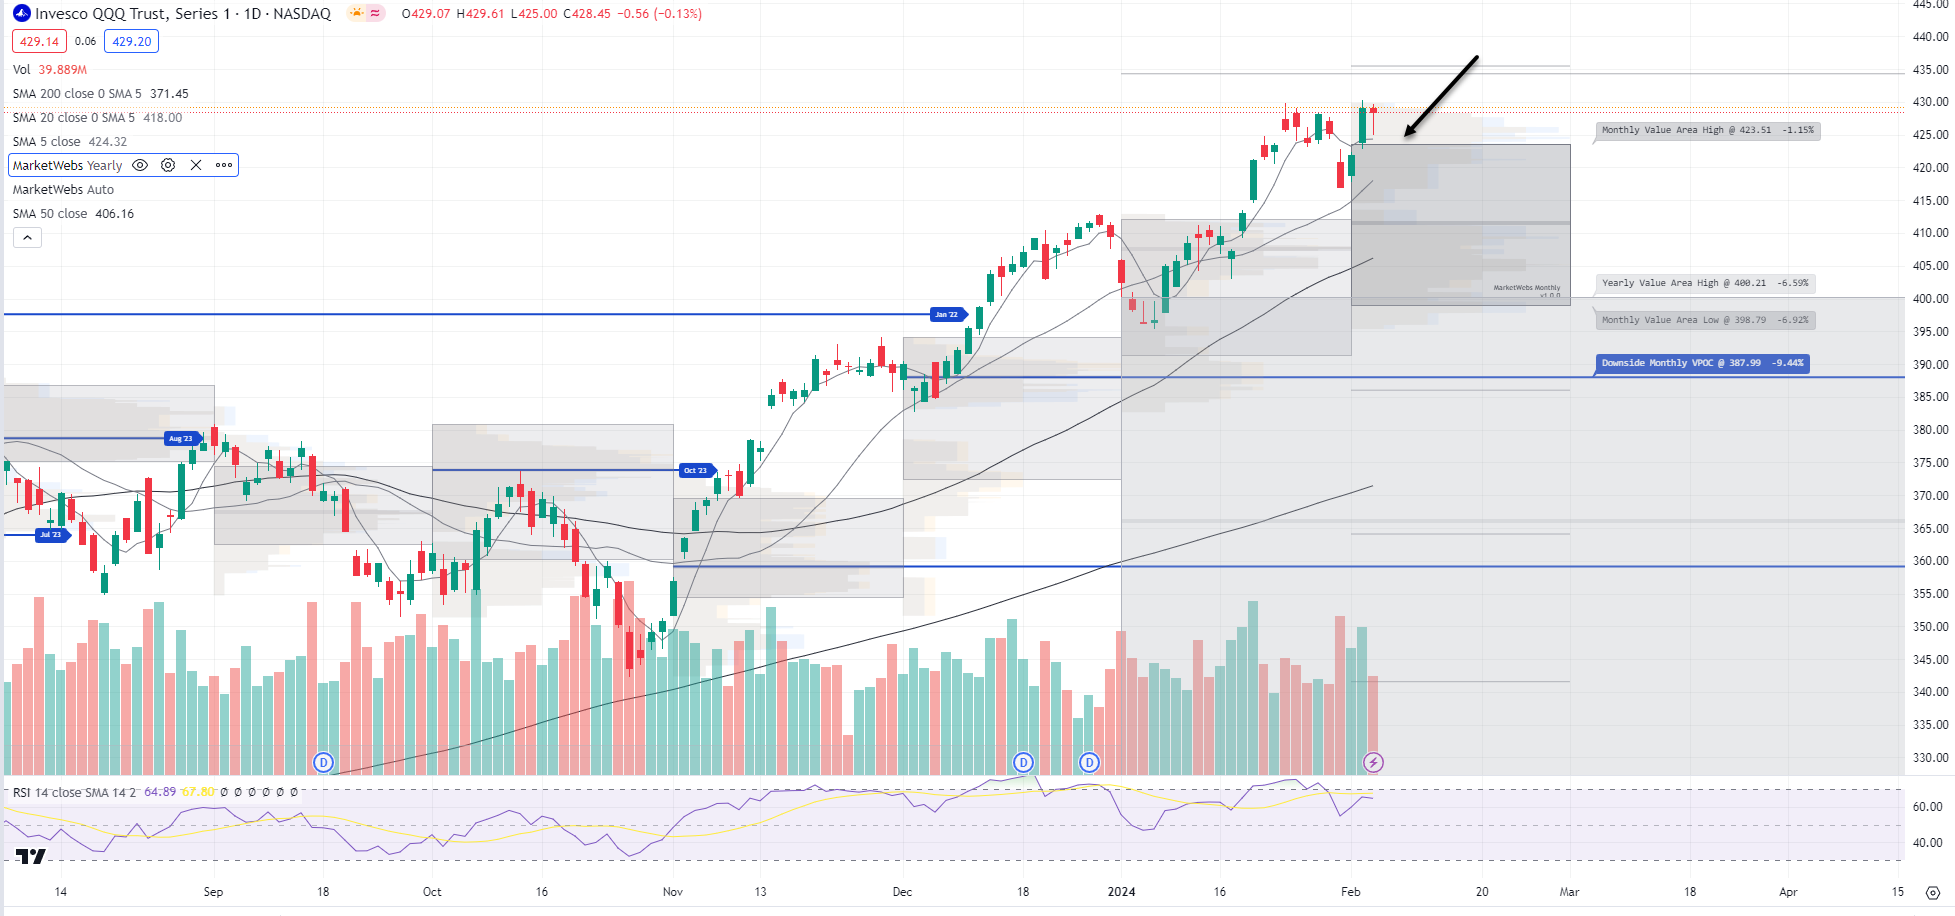
1hr chart: Similar to the S&P, price is just above its Value Area for the week, support to watch is $427.34

IWM - Russell Small Cap ETF- Price ~ flat this morning after yesterday's decline -1.3%. Again, IWM continues to be more sensitive to the move in rates and dollar t(he relationship has been if both of these are moving higher, IWM has been moving lower). The positive here is the level that I discussed yesterday $190 VPOC was taken out and price bounced so there is demand at that VPOC (blue line). If sellers overwhelm that demand, then the next support level down is $187.93
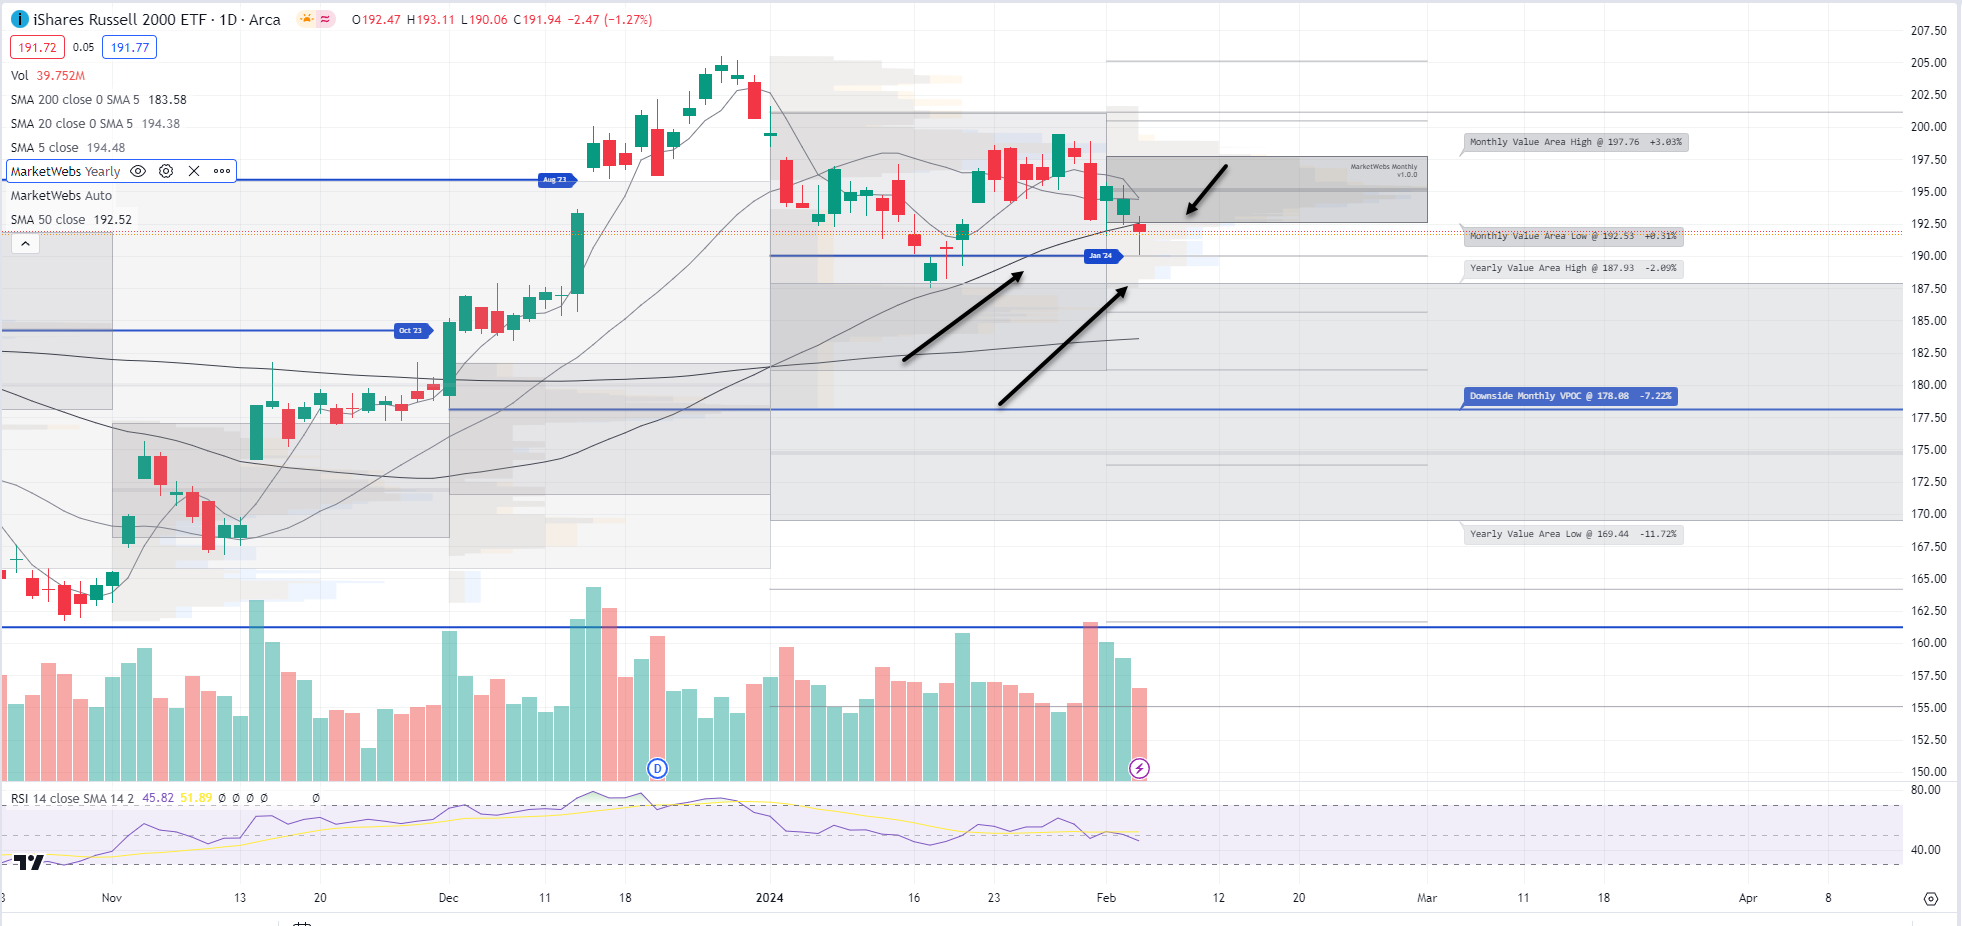
1hr chart: Price below its Value Area for week. Also, note the 1hr VPOC take out (blue line) and bounce. For the bounce to continue, price needs to get above $192.7

Here is today’s TTG Proprietary Stock Screen “Out of the Box” using Volume At Price
names trending above their Value Areas (on 3 multiple timeframes & not super extended)
Keep reading with a 7-day free trial
Subscribe to The Tribeca Trade Group to keep reading this post and get 7 days of free access to the full post archives.