

TTG Index Charts & Out of the Box Stock Screen 3/22/24 $GS
TTG Index Charts & Out of the Box Stock Screen 3/22/24 $GS
Out of the Box MarketWebs Screen
US Dollar +0.3% / 30yr Bonds +0.6% / Crude +0.2% & Nat Gas -0.3% / Gold -0.6% / Copper -1.3% / BTC -1.3%
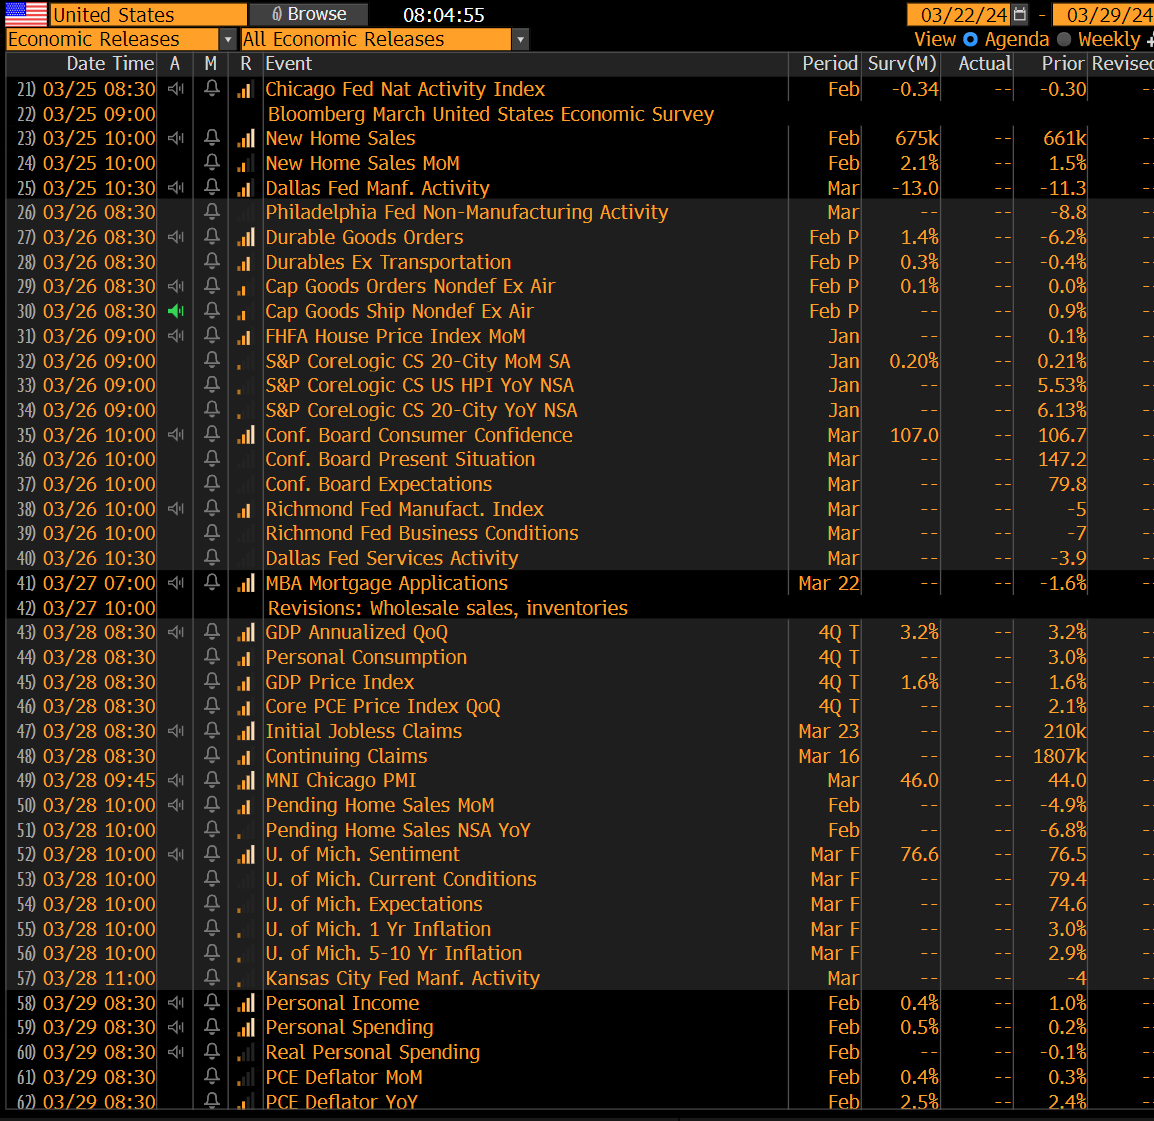
US Upcoming Economics
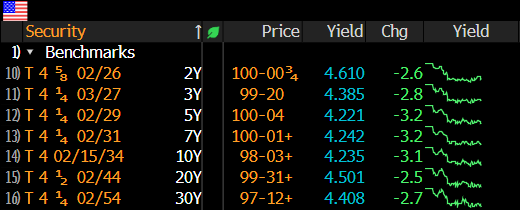
US Bond Yields
Index Updates
At TTG, I use Volume At Price in my chart analysis and I use the MarketWebs Indicator to provide Value Areas & VPOCs which indicate significant support & resistance levels. Learn More Here about Volume At Price and the MarketWebs.
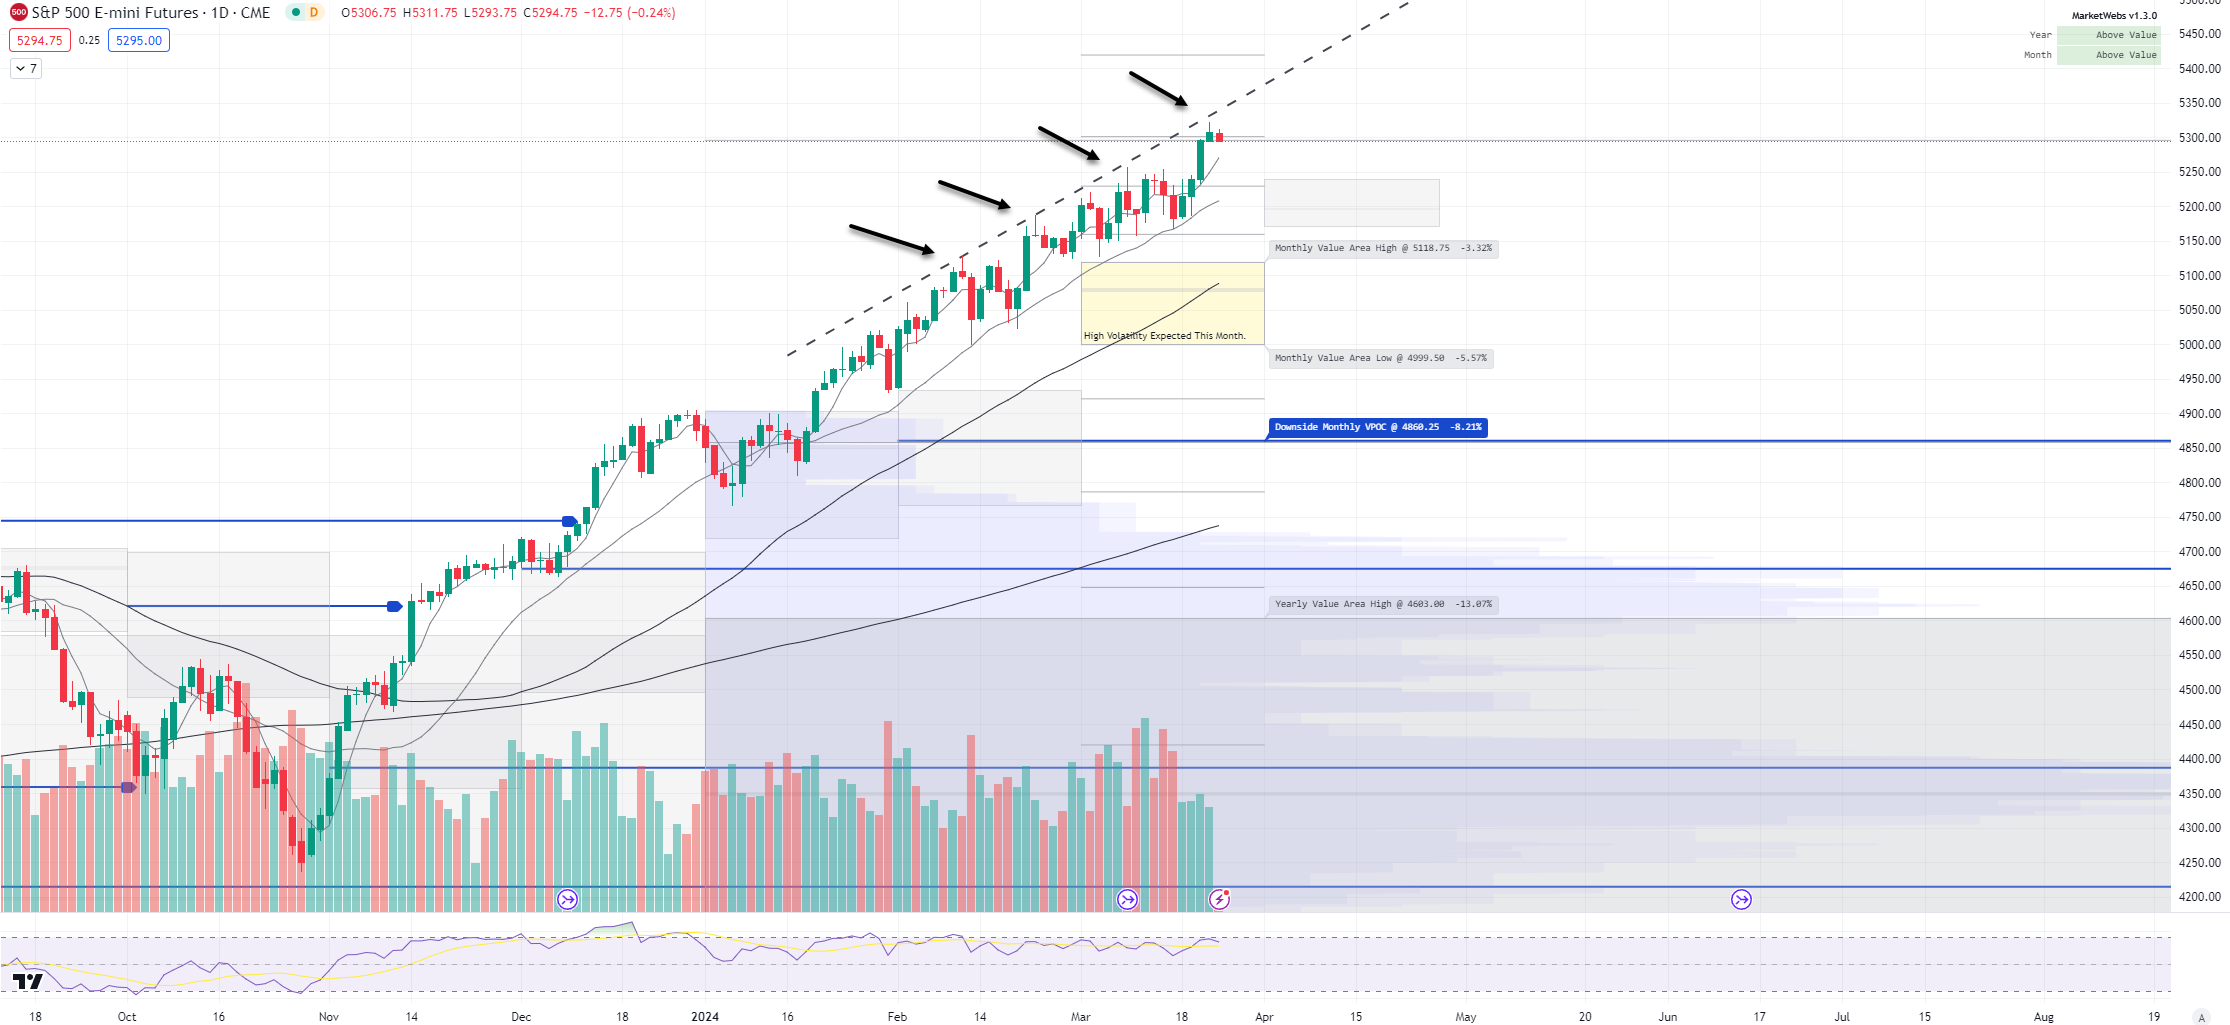
ES_F - SPX Futures - Prices methodically obeying the uptrend channel - for now, this pattern continues to play out
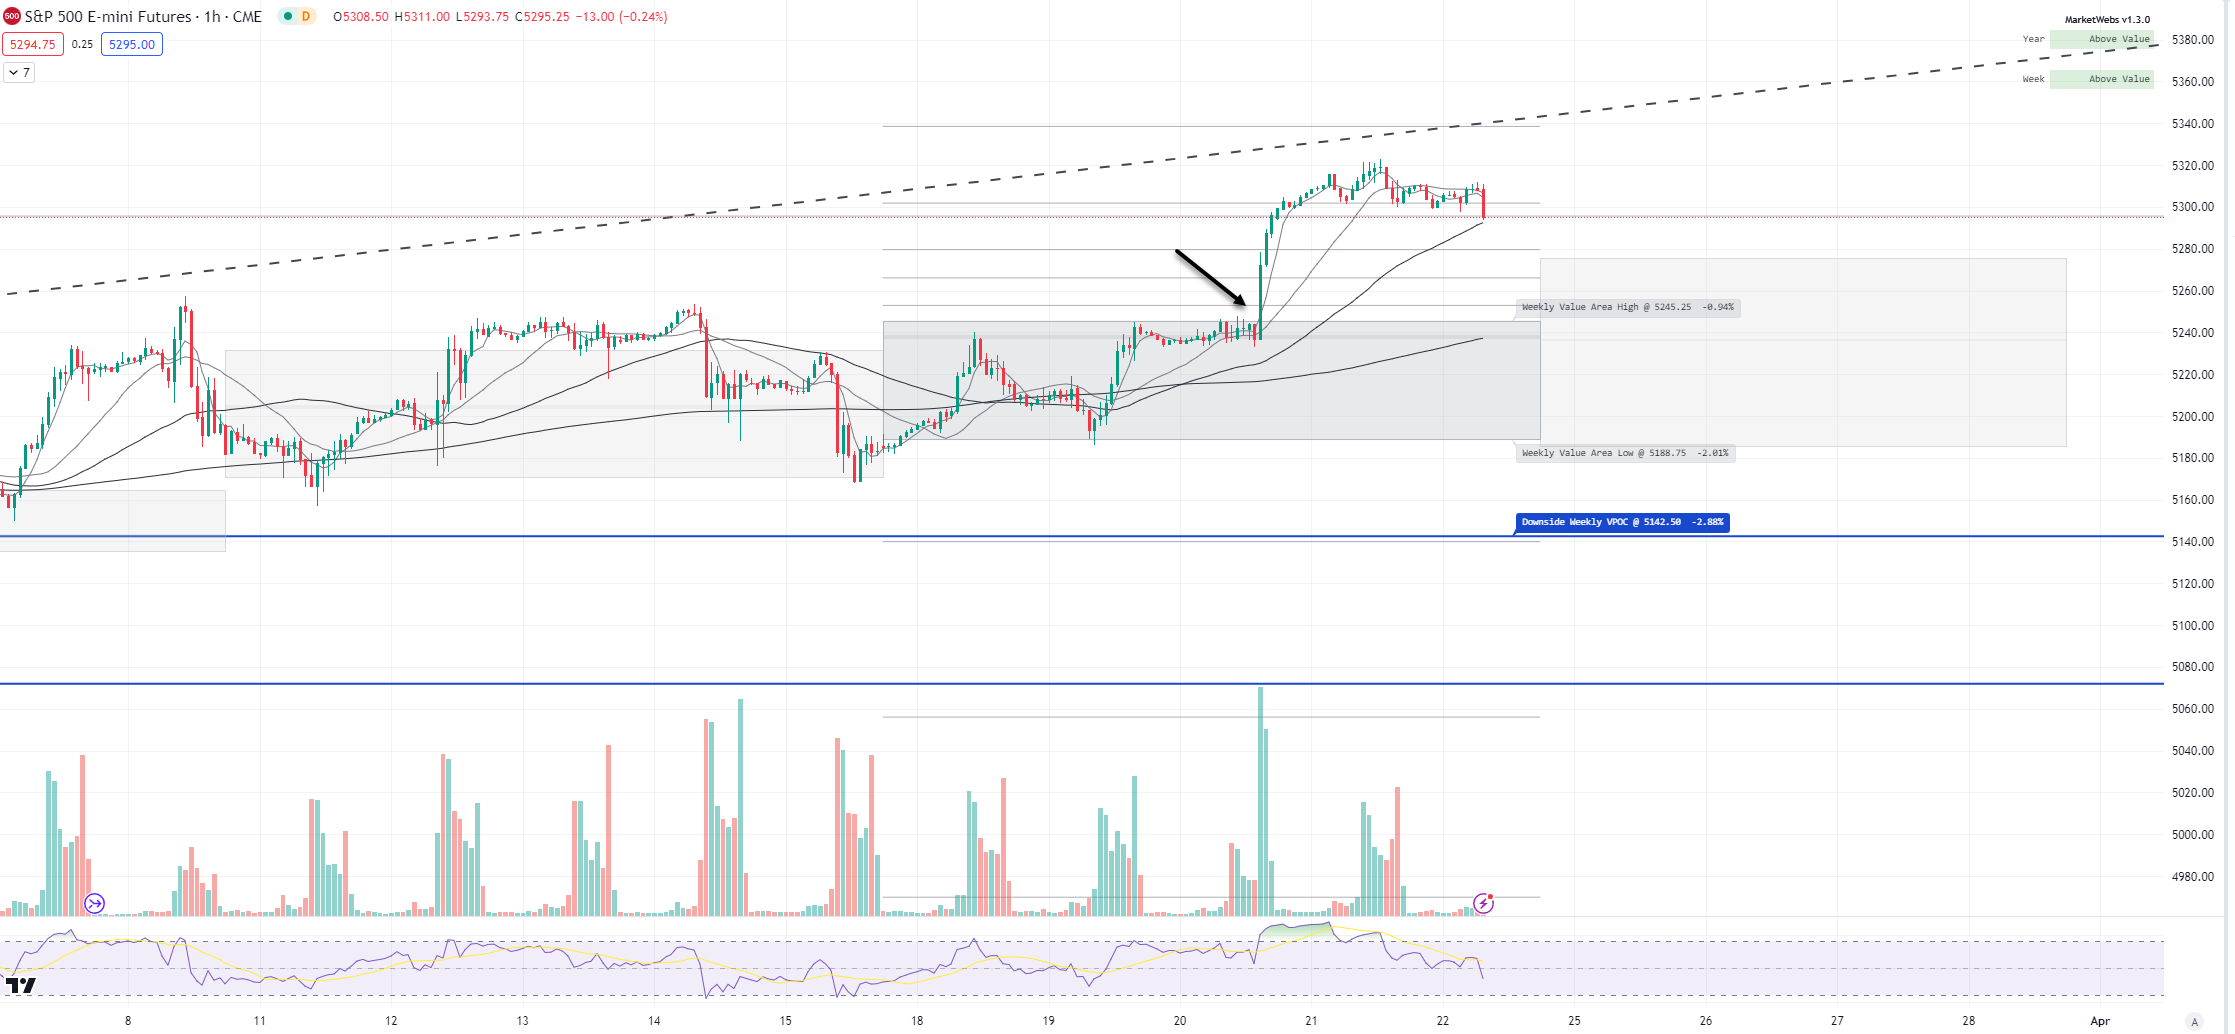
1hr chart: Price off highs a touch this morning but remain decently above its Value Area for the week
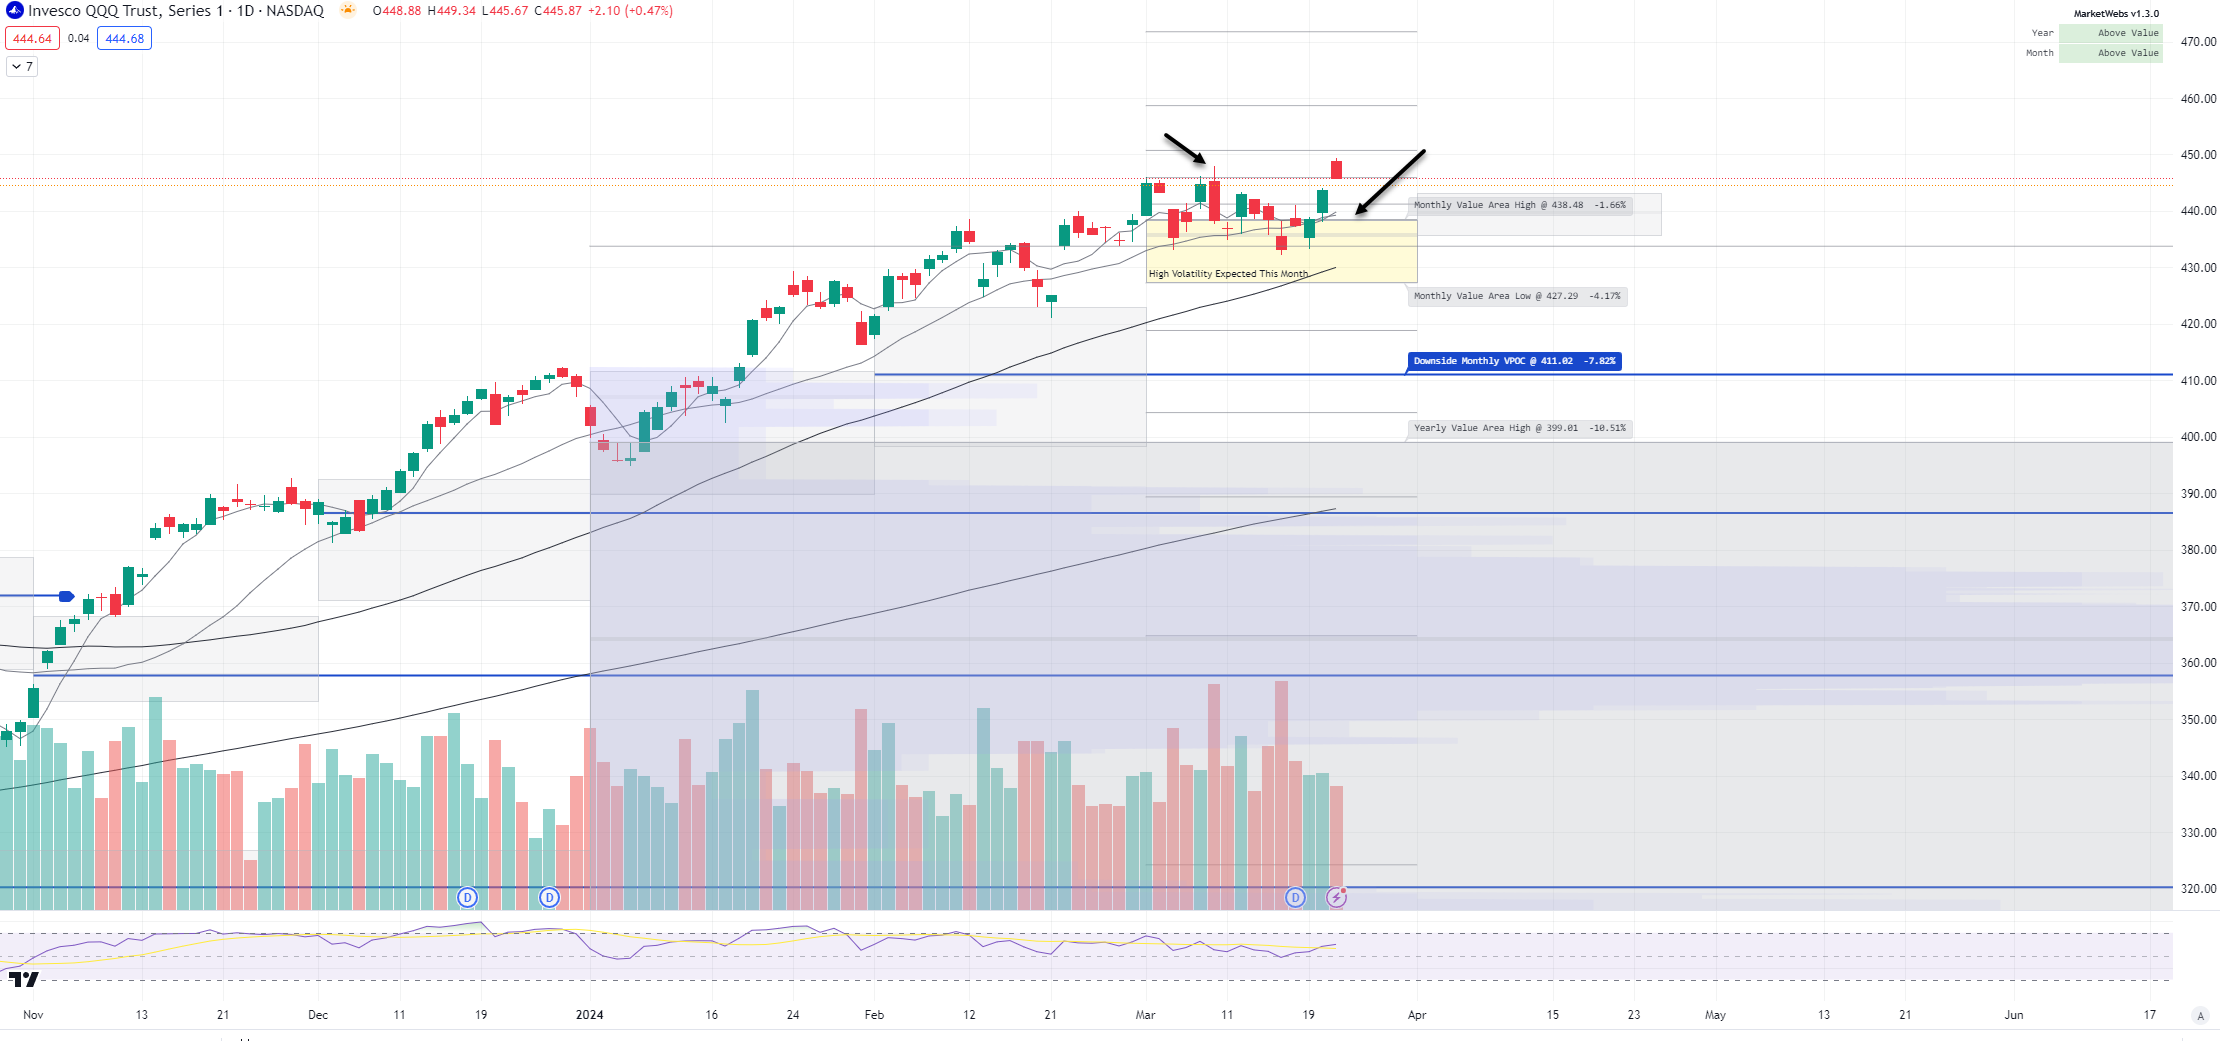
QQQ - NDX 100 ETF - Daily chart: Price ind. -0.3% this morning. The Good from this week = price broke back above its Mar Value area / The Bad = price closed weak around previous highs --> I still think that it makes sense to be highly selective in high growth names as some of the Mag 7 names have lost leadership (i.e. AAPL TSLA) and continue to we see stronger areas like Industrials, Financials, Home Constr / Building, and Material Co's
1hr chart: Price is above its Value Area for the week, support $441.24
IWM - Russell Small Cap ETF- Price ~ flat this morning and is currently challenging Mar highs , if price can get through these levels, next upside price target is $212.26 VPOC.
Note Treasuries are allying a bit this morning which generally favors Small Caps

1hr chart: Price currently above its Value Area for the week, support $205.92
Here is today’s TTG Proprietary Stock Screen “Out of the Box” using Volume At Price
names trending above their Value Areas (on 3 multiple timeframes & not super extended)
Keep reading with a 7-day free trial
Subscribe to The Tribeca Trade Group to keep reading this post and get 7 days of free access to the full post archives.