

TTG Index Charts & Out of the Box Stock Screen 4/18/24
TTG Index Charts & Out of the Box Stock Screen 4/18/24
Out of the Box MarketWebs Screen
US Dollar -0.1% / 30yr Bonds -0.1% / Crude -0.6% & Nat Gas +2.4% / Gold +0.5% / Copper +1.6% / BTC +2.4%
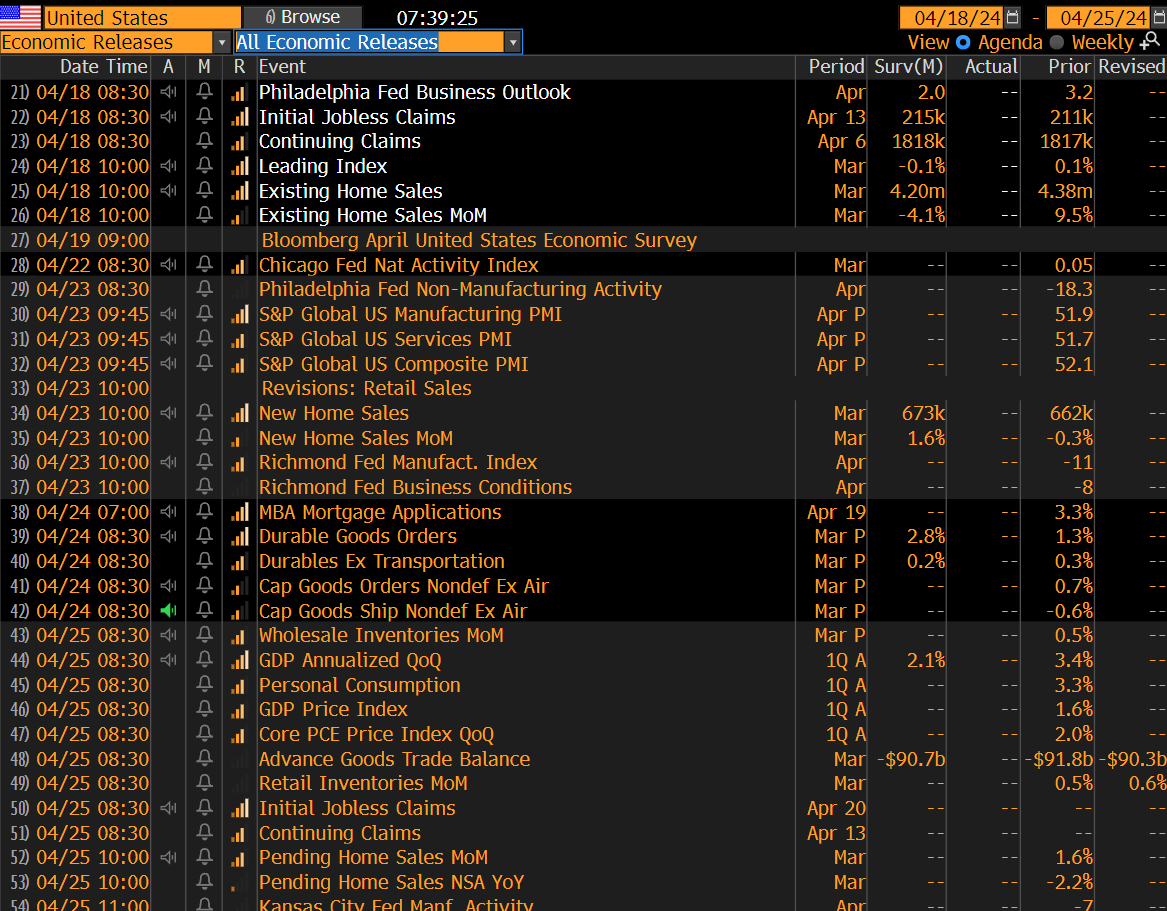
US Upcoming Economics
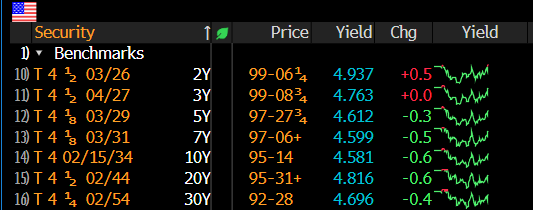
US Bond Yields
Index Updates
At TTG, I use Volume At Price in my chart analysis and I use the MarketWebs Indicator to provide Value Areas & VPOCs which indicate significant support & resistance levels. Learn More Here about Volume At Price and the MarketWebs.
ES_F - SPX Futures - Daily chart: Price ind. +0.3% and hovering around that lower VPOC take out. So far we are seeing some stabilization around this VPOC (blue line) but not yet a bounce. Note, there are some short term oversold conditions i.e. NYMO -91 that would favor an oversold bounce here. Also, a VIX divergence with SPY yesterday also favors the possibility of a bounce.
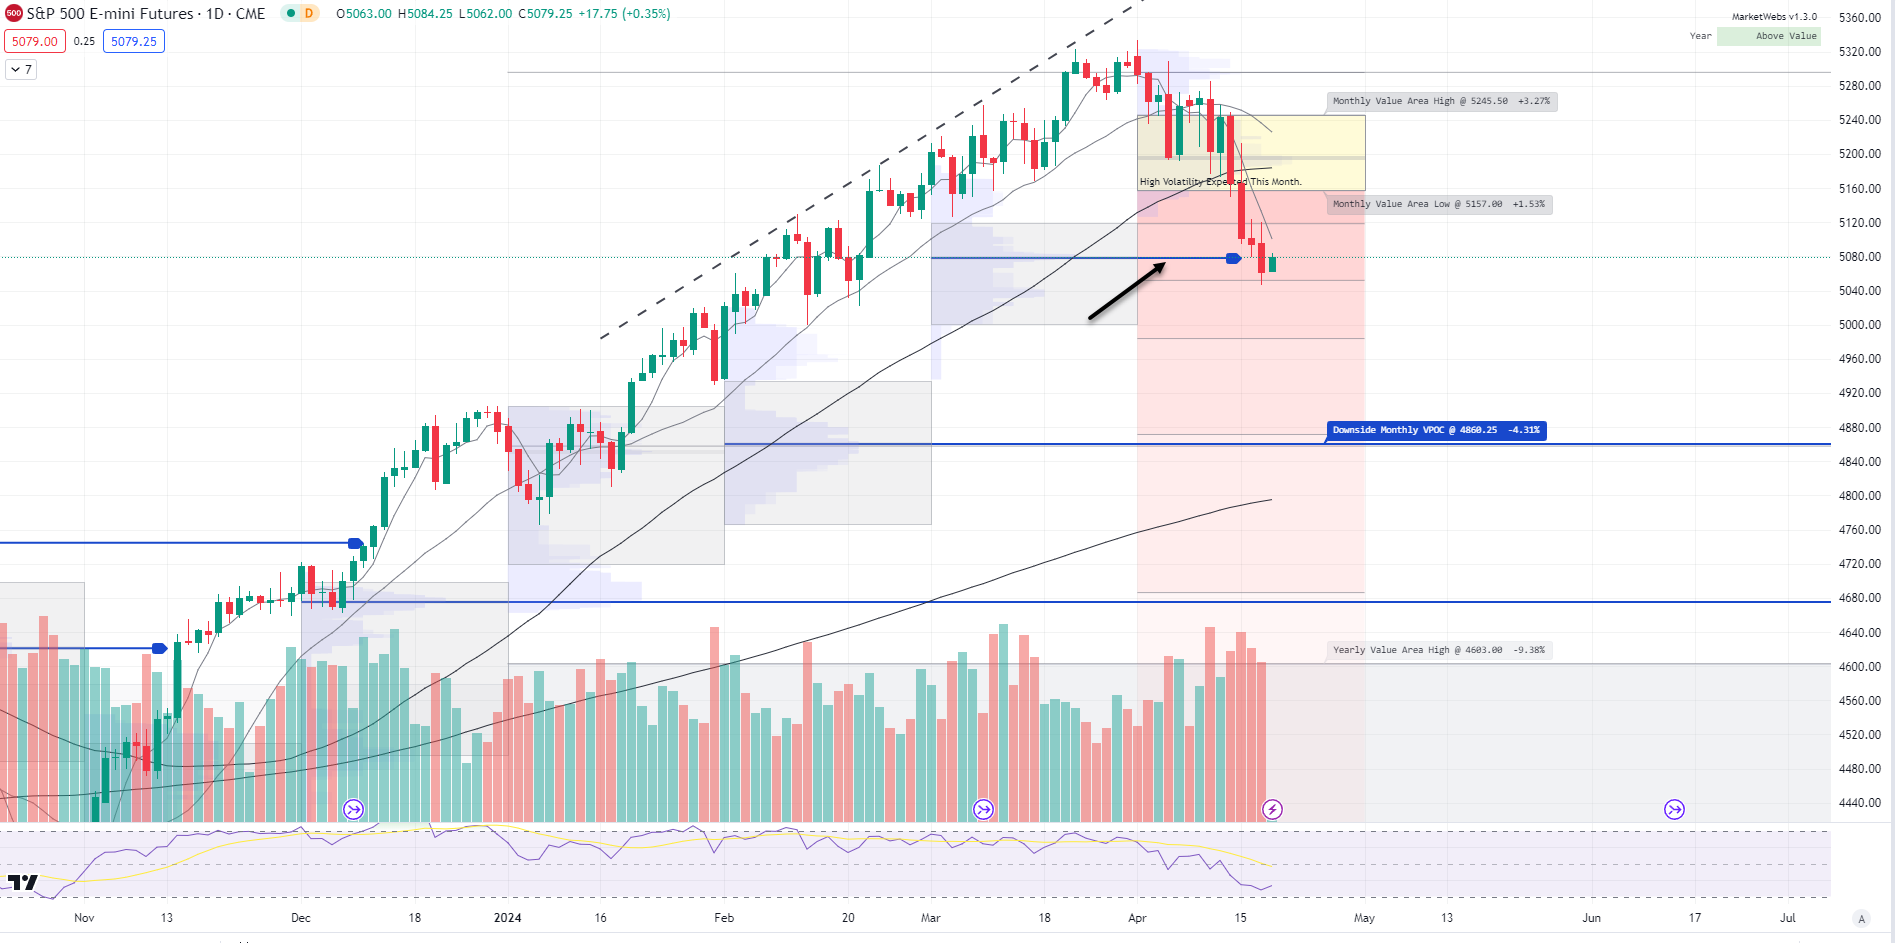
1hr chart: Price took out that lower VPOC discussed in yesterday's note and I would watch to see if price can stay above 5072

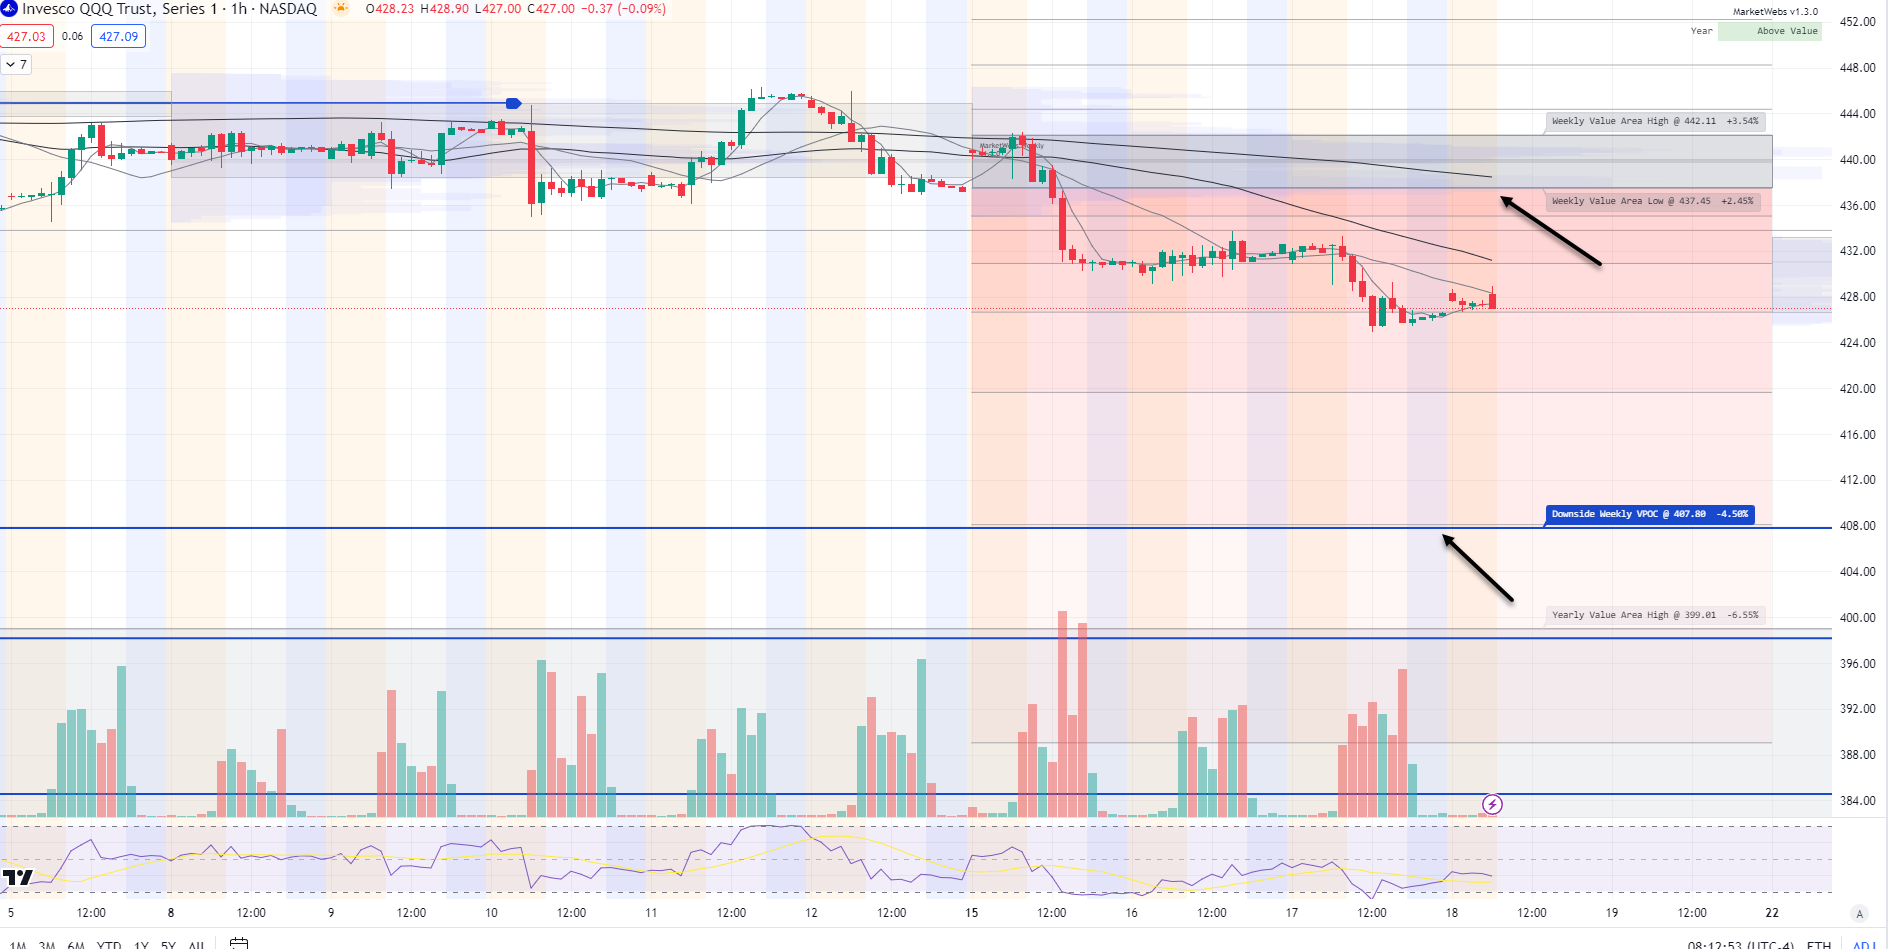
QQQ - NDX 100 ETF - Daily chart: Price ind. +0.2% and the gap ups have been faded. Could this happen again today? It could and the QQQs have been looking a bit weaker with no VPOCs nearby , the next one on Daily chart is $411 which is -3.5% away. Not saying that price gets there in a straight line but price has decently broken its short term uptrend. Earnings may be next catalyst to watch.
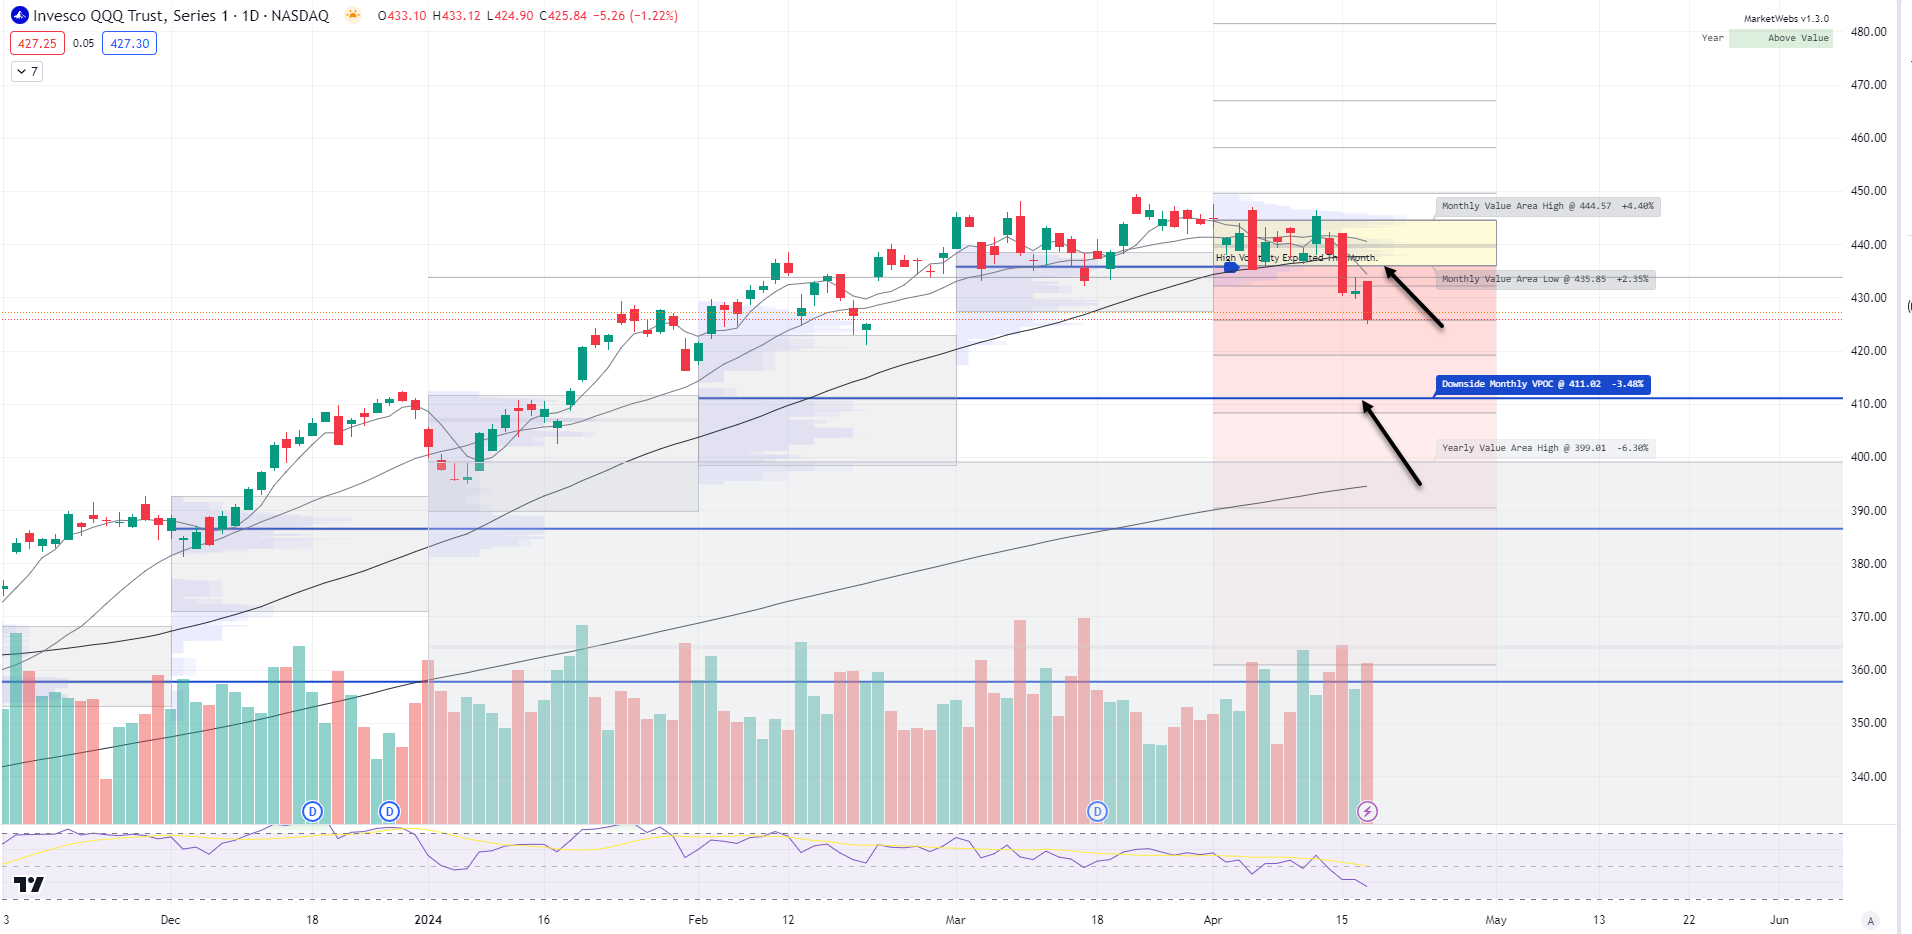
1hr chart: Price continues to trend lower below its Value Area for week
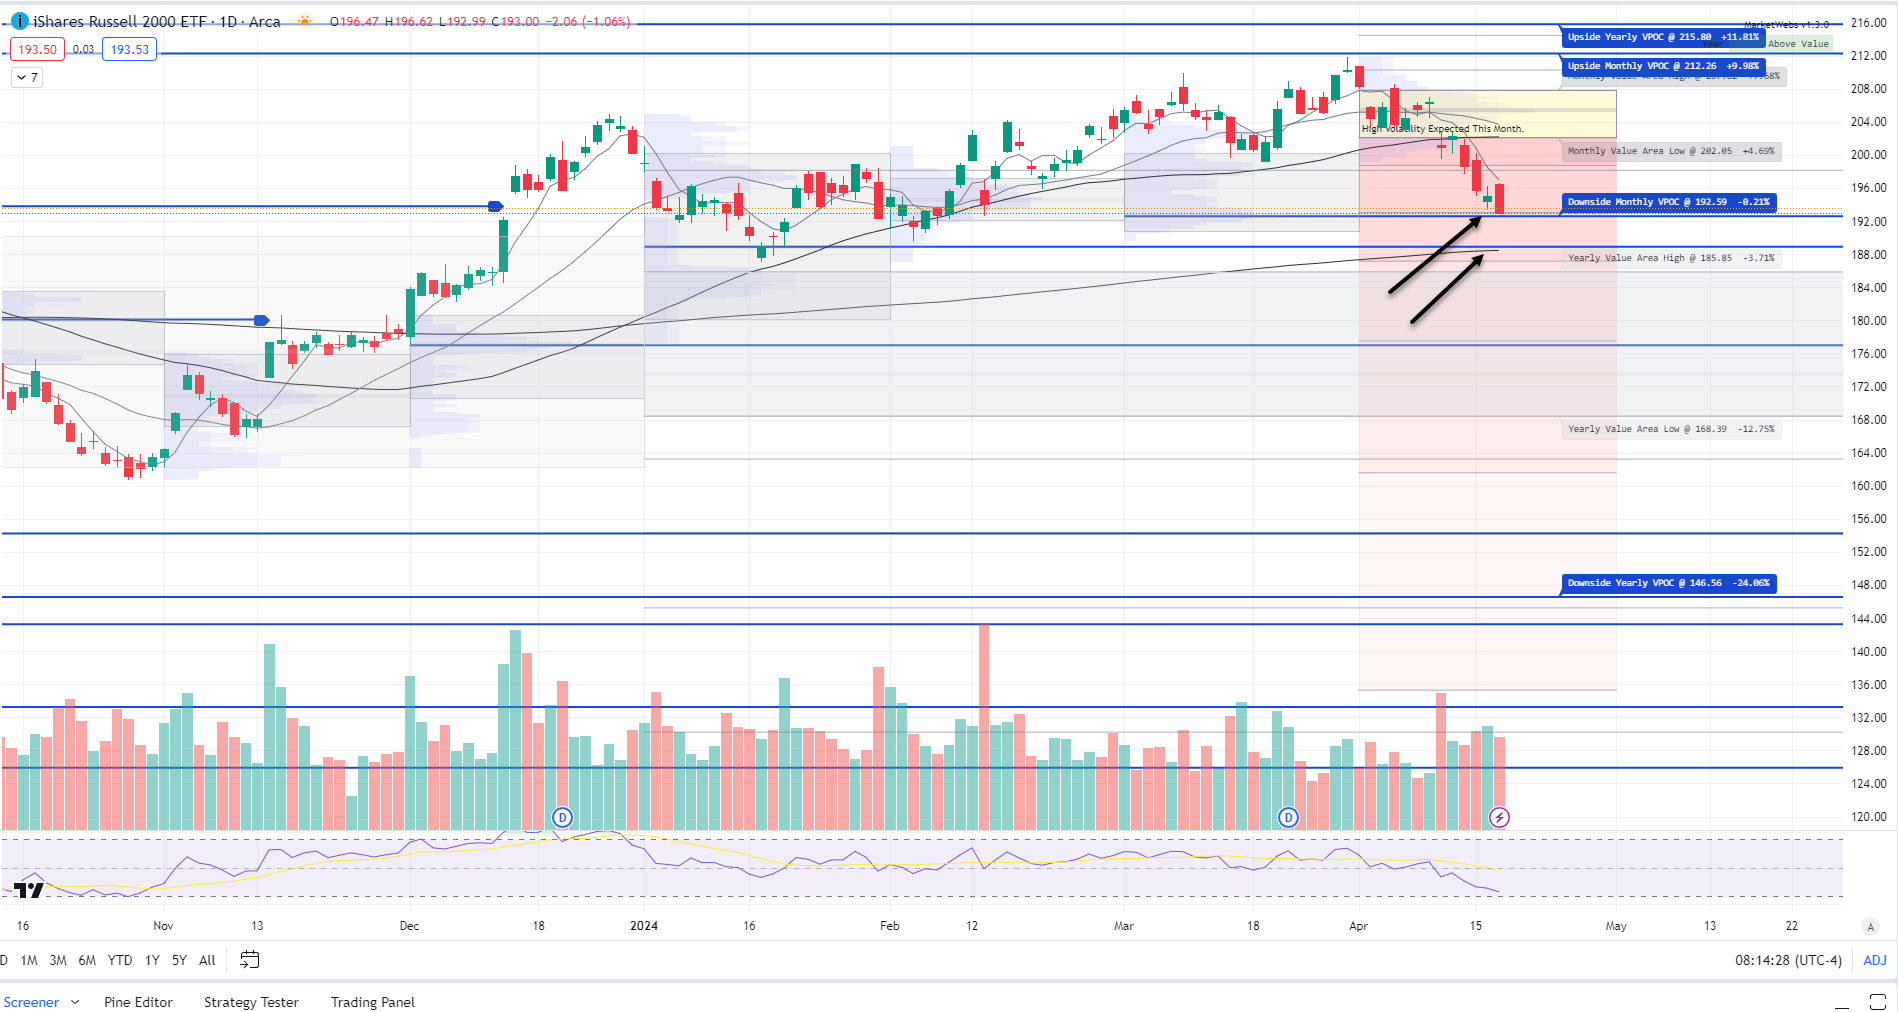
IWM - Russell Small Cap ETF- Price ind. +0.2%, lower VPOC remains at $192.59 (blue line) and resistance up at $202.05. Watch for some stabilization if VPOC gets taken out, but reminder short-term trend is down
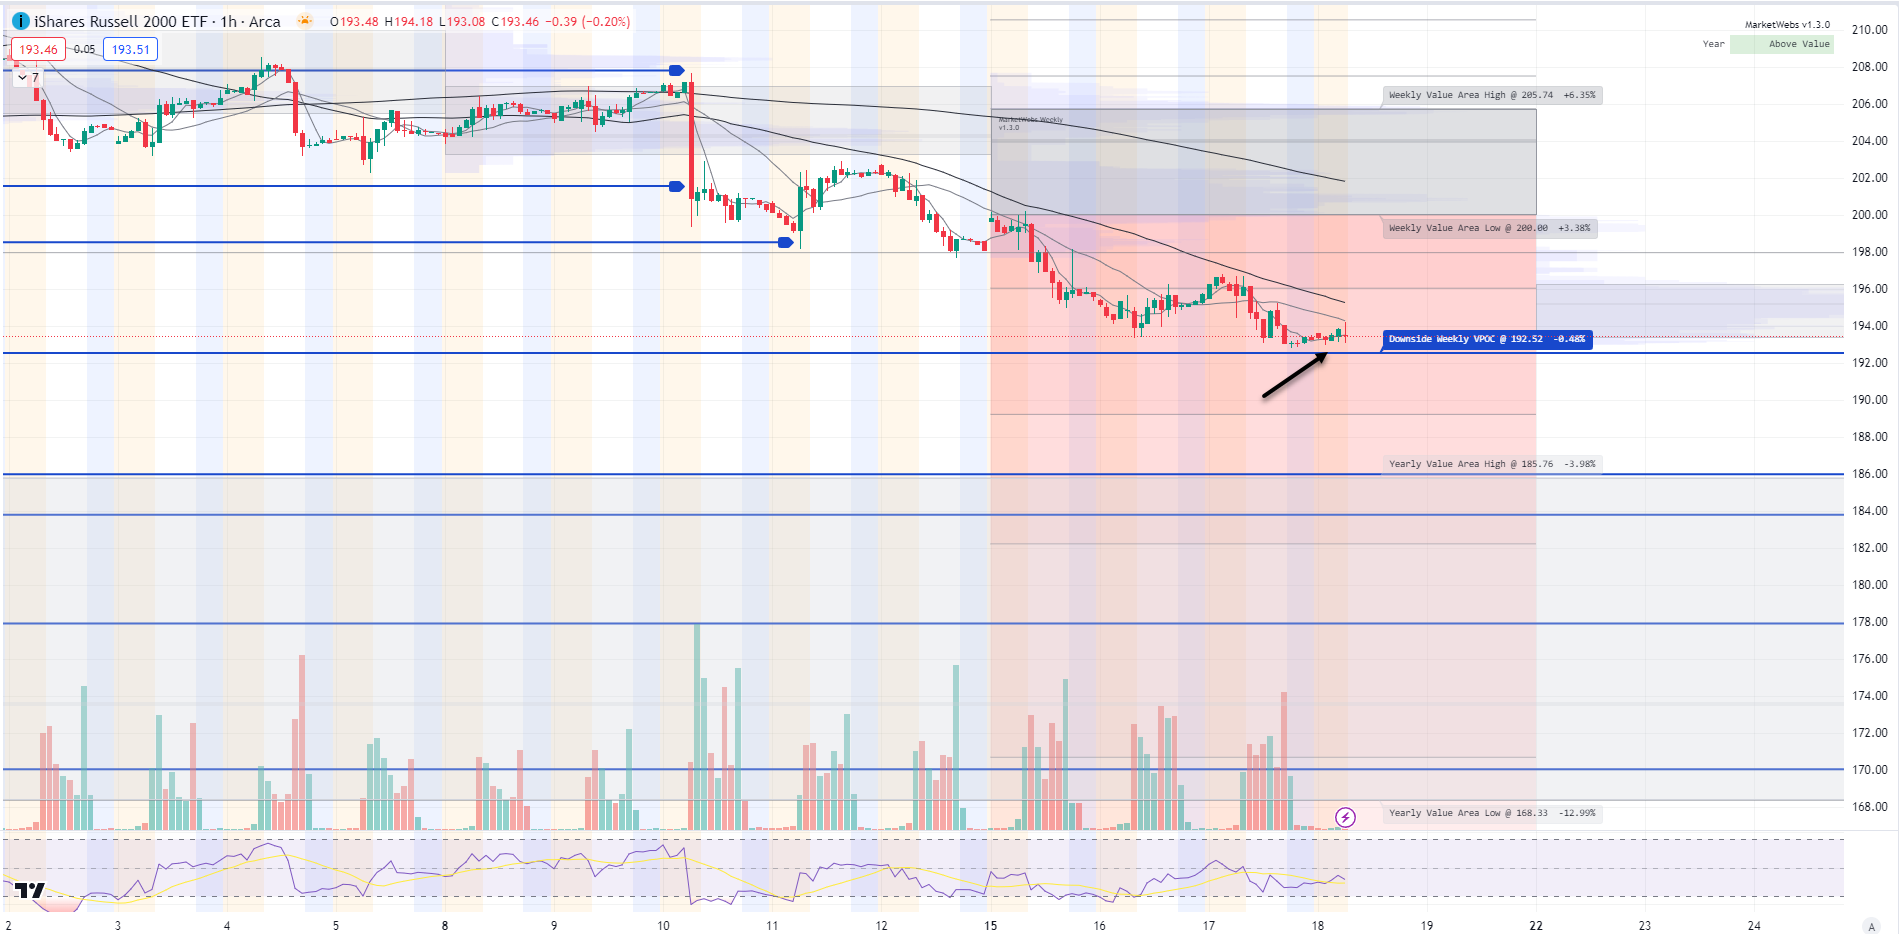
1hr chart: Price closer to that VPOC @ $192.52 which is very close to that VPOC on Daily Chart
Here is today’s TTG Proprietary Stock Screen “Out of the Box” using Volume At Price
names trending above their Value Areas (on 3 multiple timeframes & not super extended)
Keep reading with a 7-day free trial
Subscribe to The Tribeca Trade Group to keep reading this post and get 7 days of free access to the full post archives.