

TTG Index Charts & Out of the Box Stock Screen 4/23/24 $BECN
TTG Index Charts & Out of the Box Stock Screen 4/23/24 $BECN
Out of the Box MarketWebs Screen
US Dollar -0.1% / 30yr Bonds -0.4% / Crude -0.8% & Nat Gas +0.7% / Gold -1.1% / Copper -1.3% / BTC -0.7%
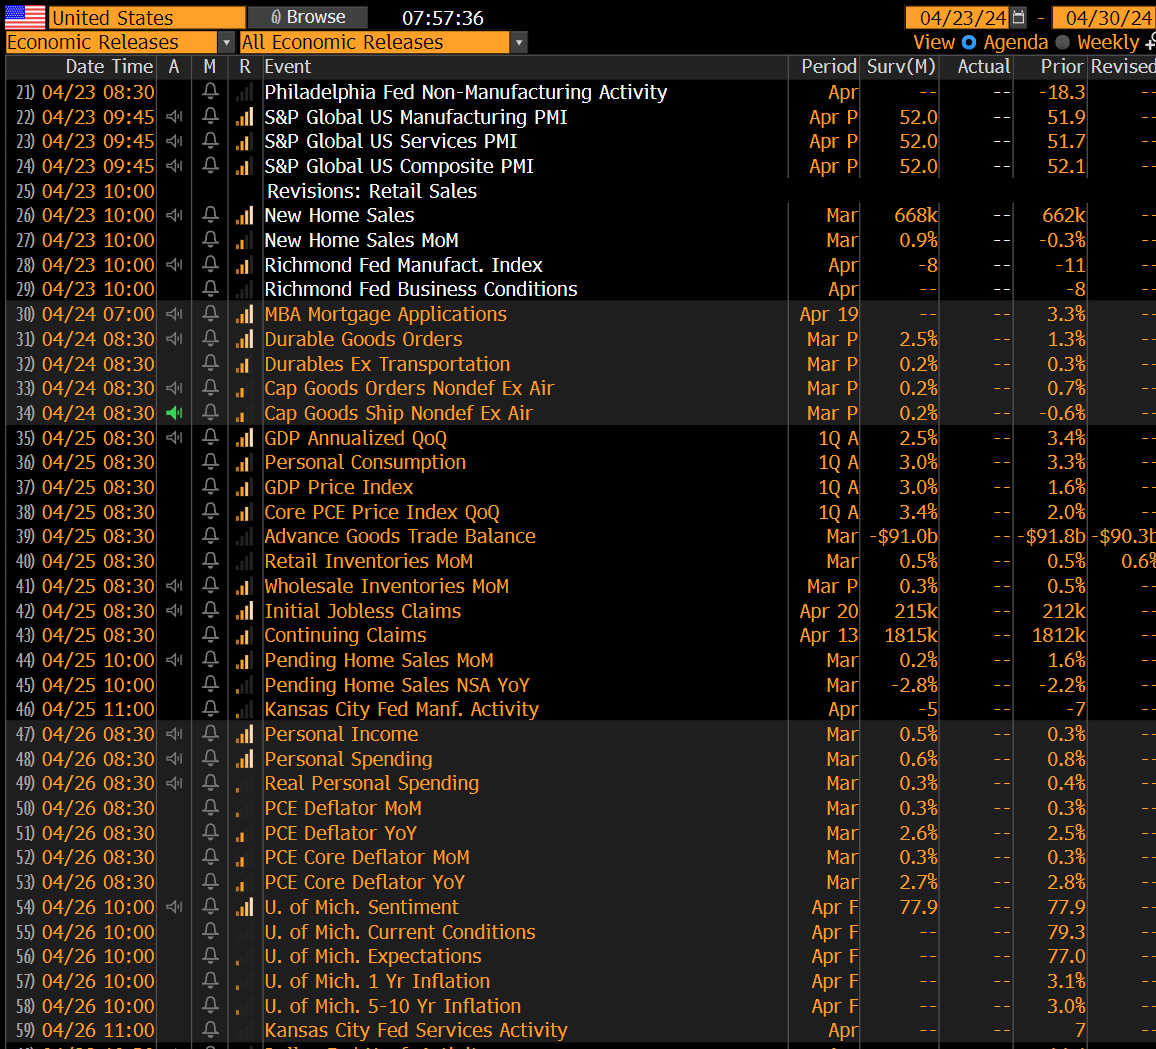
US Upcoming Economics
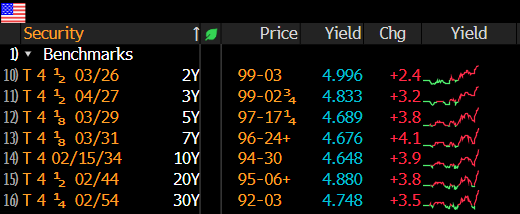
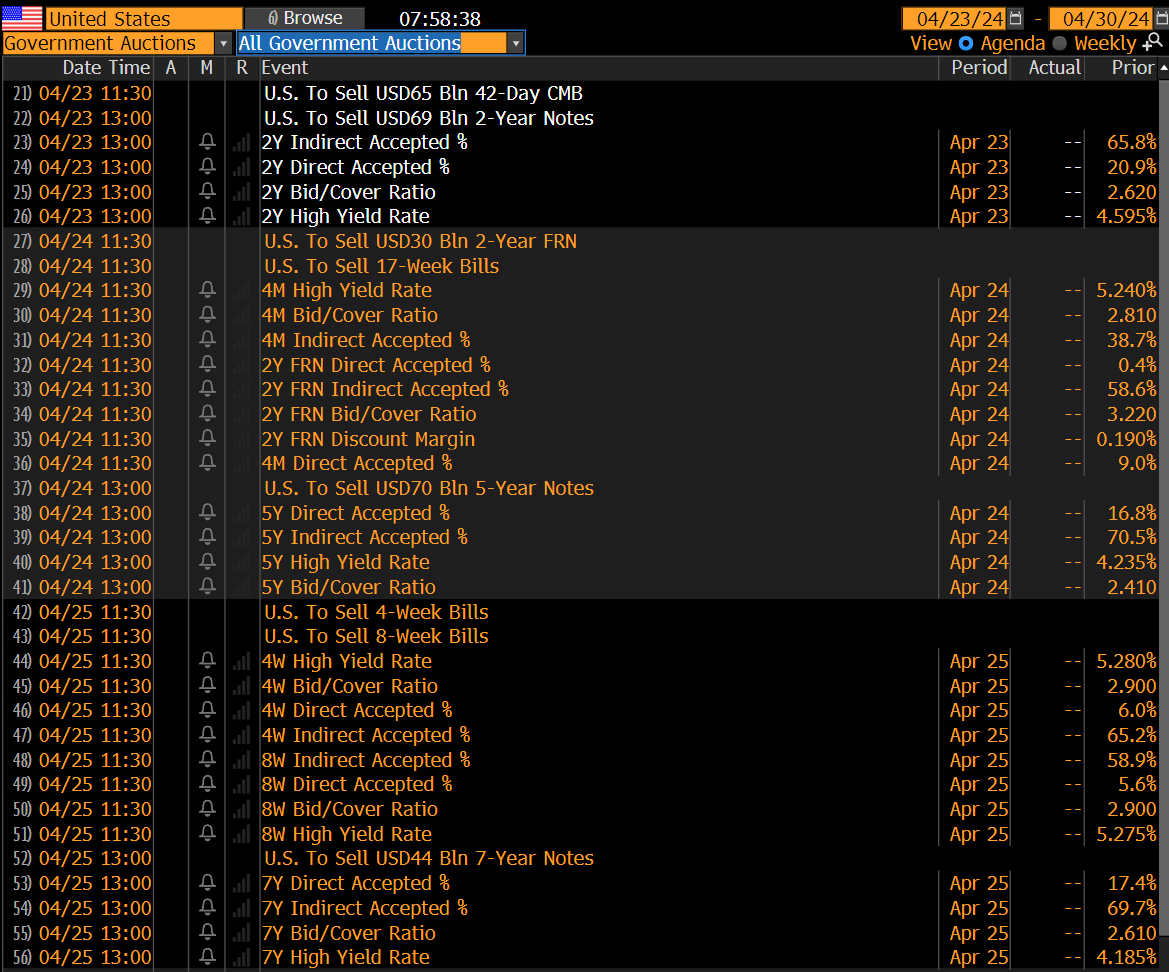
US Bond Yields & Upcoming Bond Auctions
Index Updates
At TTG, I use Volume At Price in my chart analysis and I use the MarketWebs Indicator to provide Value Areas & VPOCs which indicate significant support & resistance levels. Learn More Here about Volume At Price and the MarketWebs.
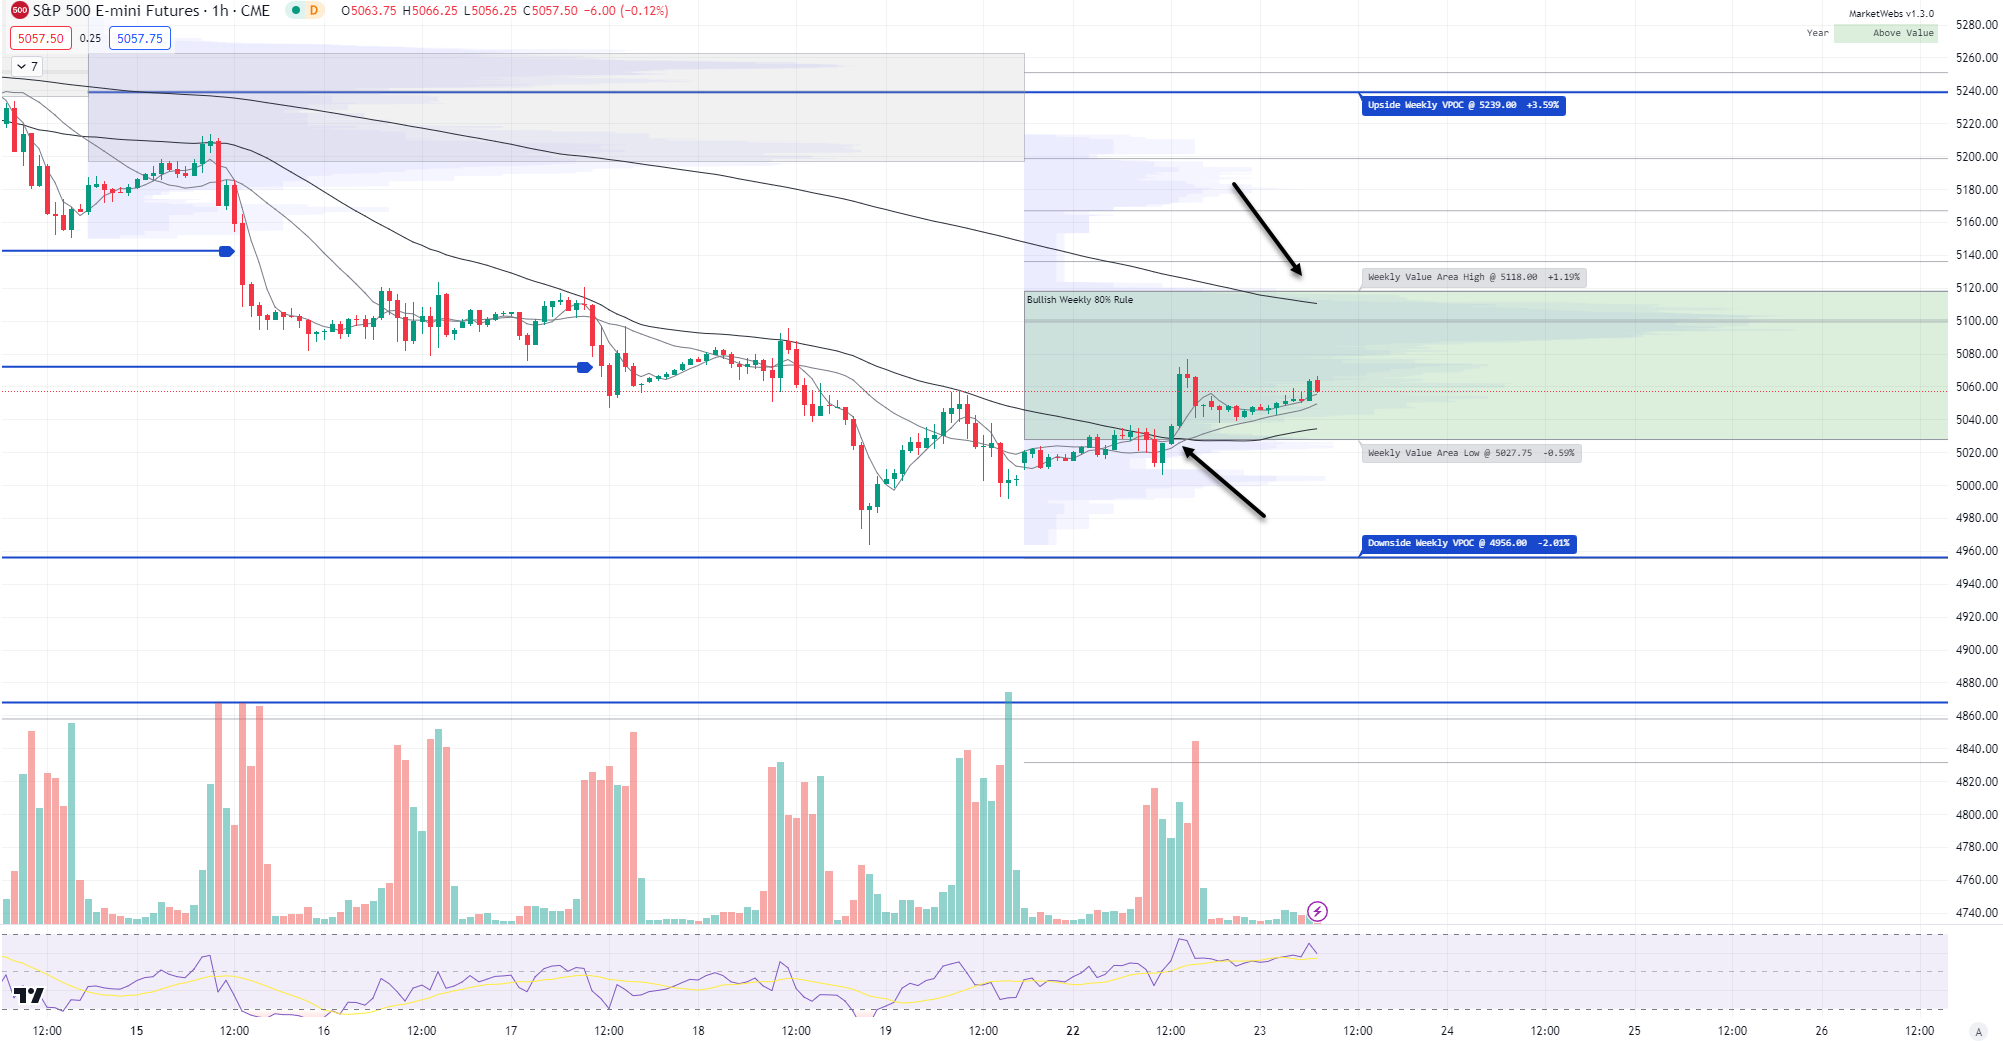
ES_F - SPX Futures - Daily chart: Price ind. +0.2% this morning and right at its 5d MA (Moving Average) and that is what I am watching today is to see if price can reclaim this short-term MA for a short-term change in trend. Note, yesterday price was not able to do it & closed just below. Also, as I noted in yesterday's video, overall breadth has been slowly improving since the middle of last week.
1hr chart: Price made it into its Value Area for the week yesterday and triggered the 80% rule, indicating that as long as price is > 5027.75 then there is a 80% chance to move to top of this week's Value Area, 5118
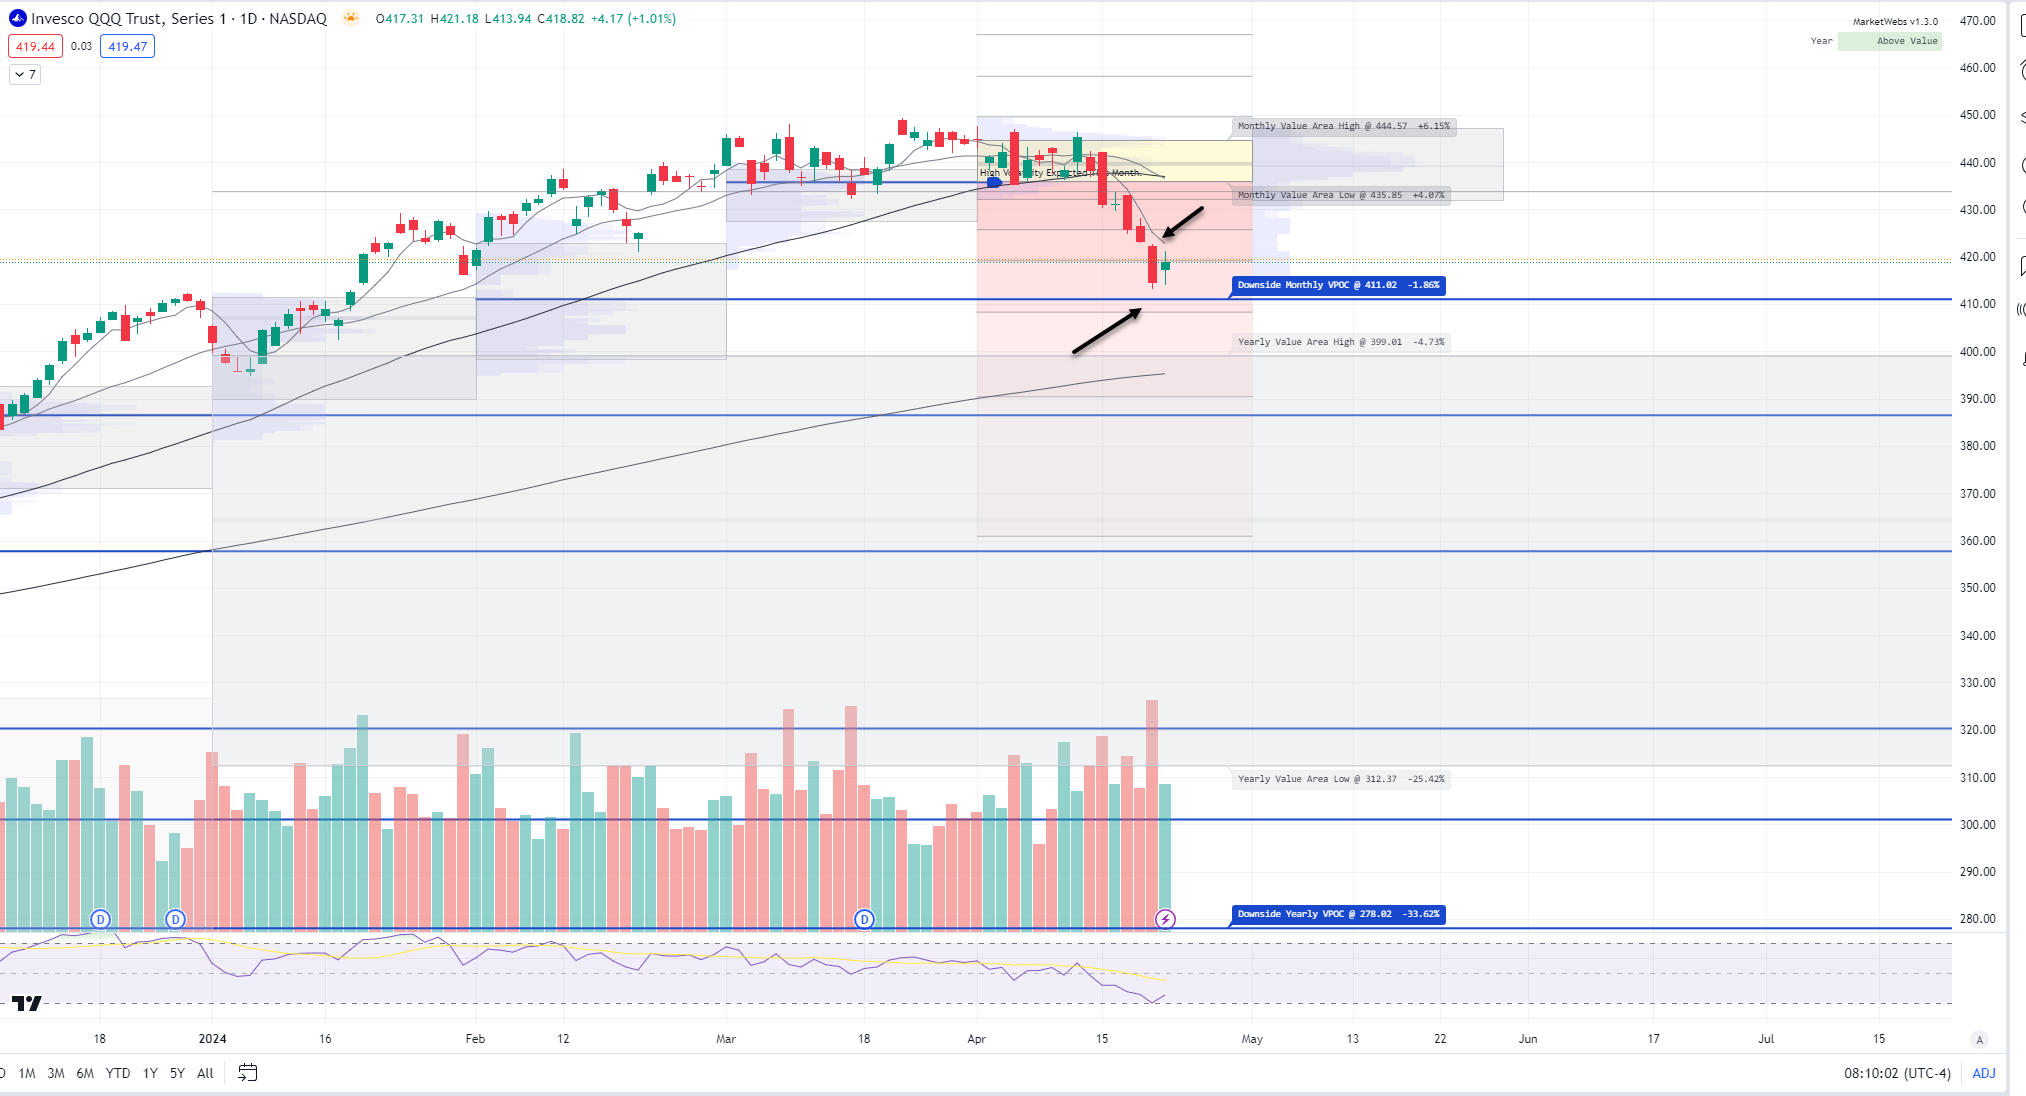
QQQ - NDX 100 ETF - Daily chart: Price ind. +0.2% but still remains below its 5d MA and the lower VPOC to watch in case volatility increases is $411.02
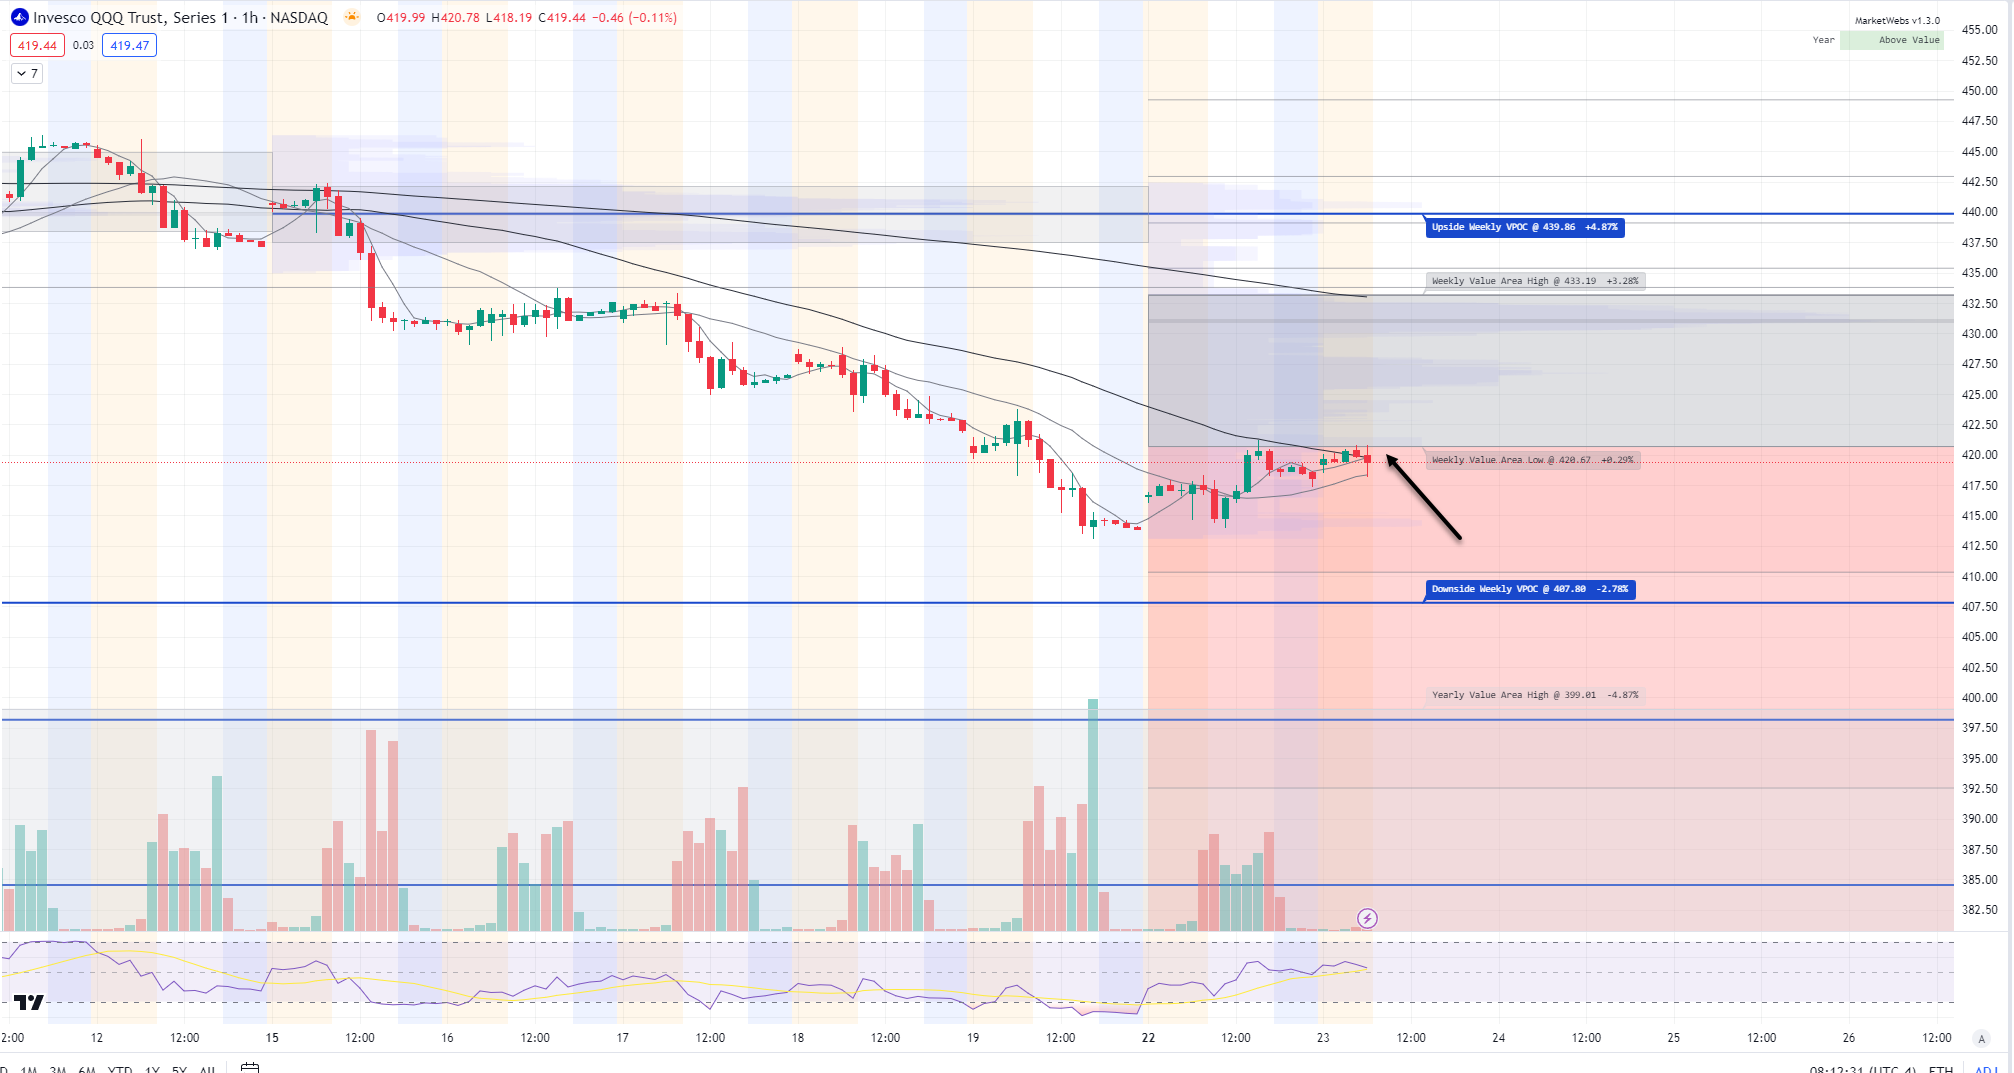
1hr chart: Interesting, price has not been able to make it into its Value Area for week, resistance to watch is $420.67
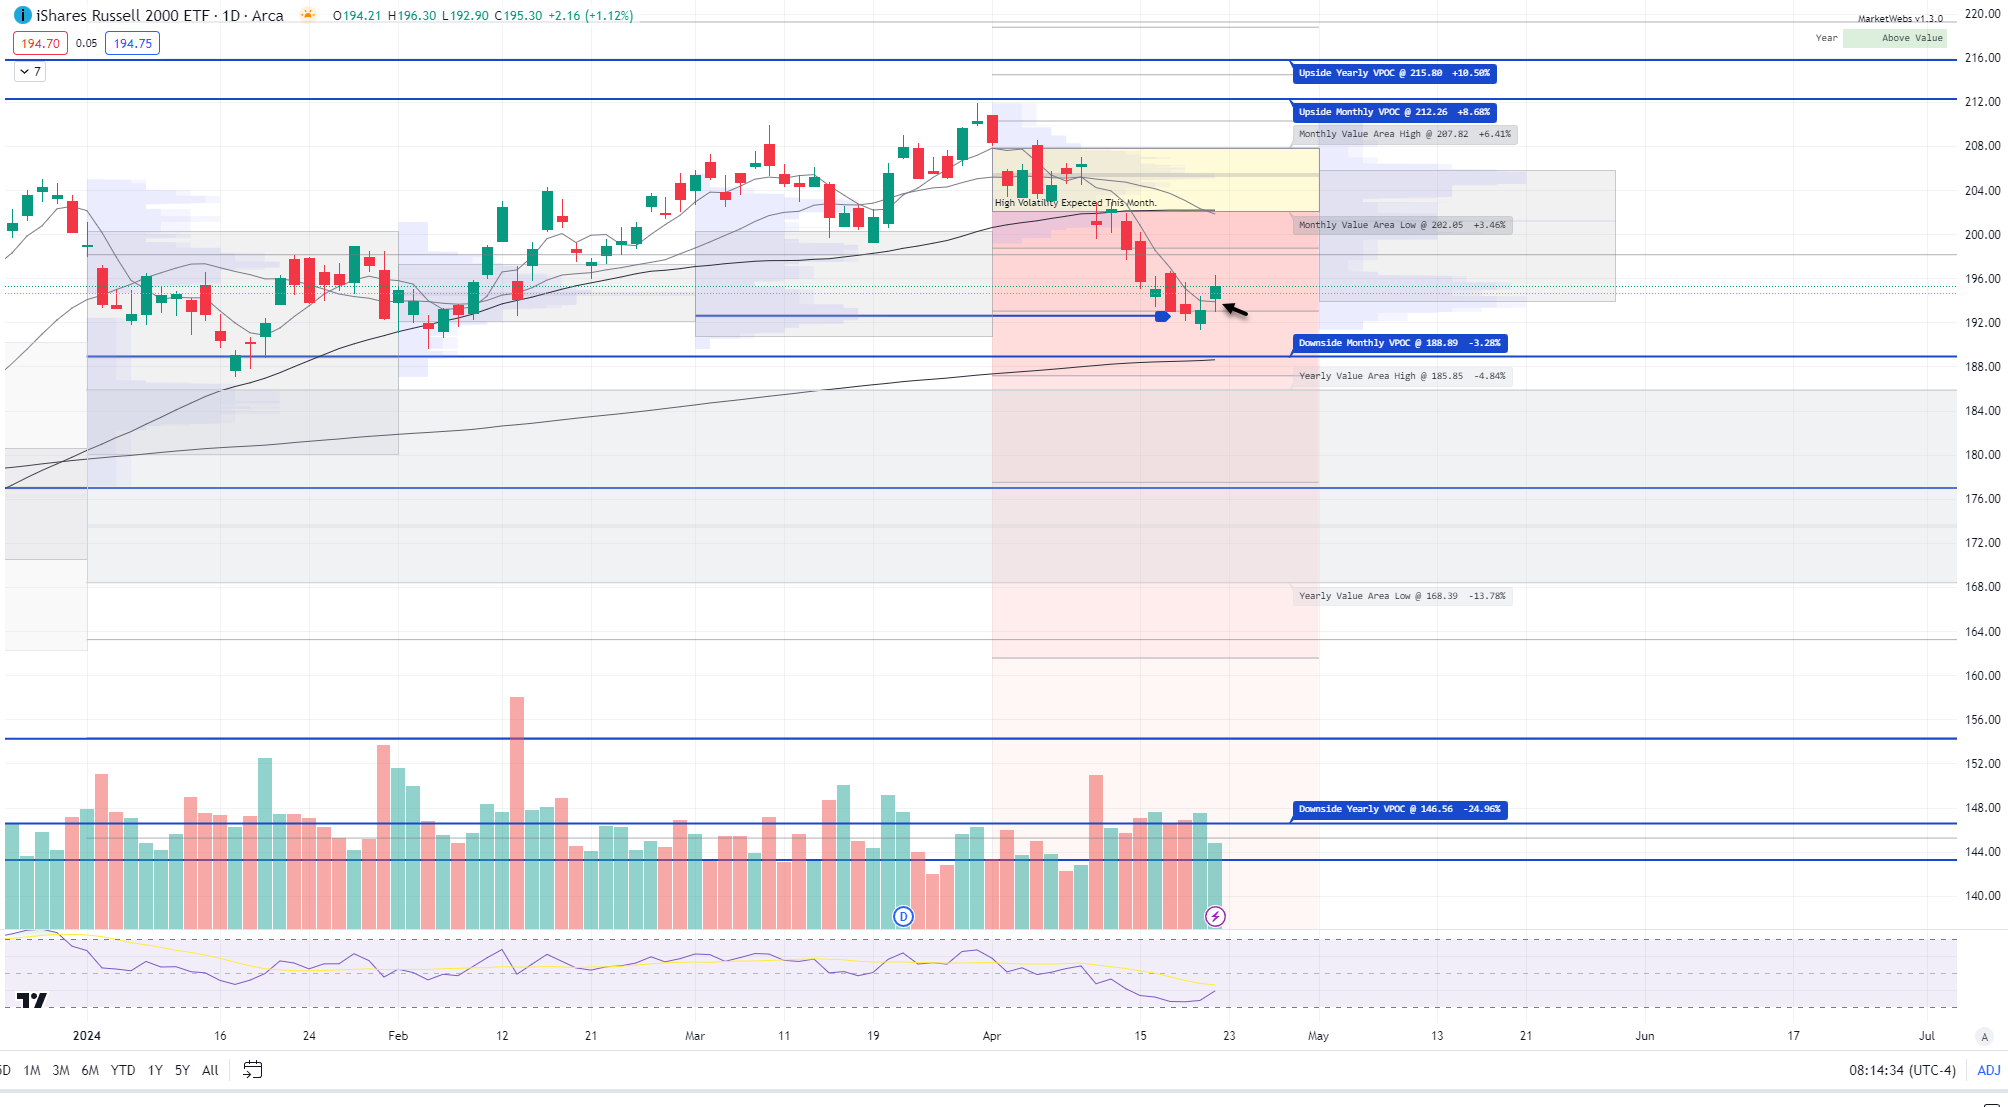
IWM - Russell Small Cap ETF- Price underperforming this morning , -0.3% and is just above its 5d MA , let's see if price can stay above that short-term MA today
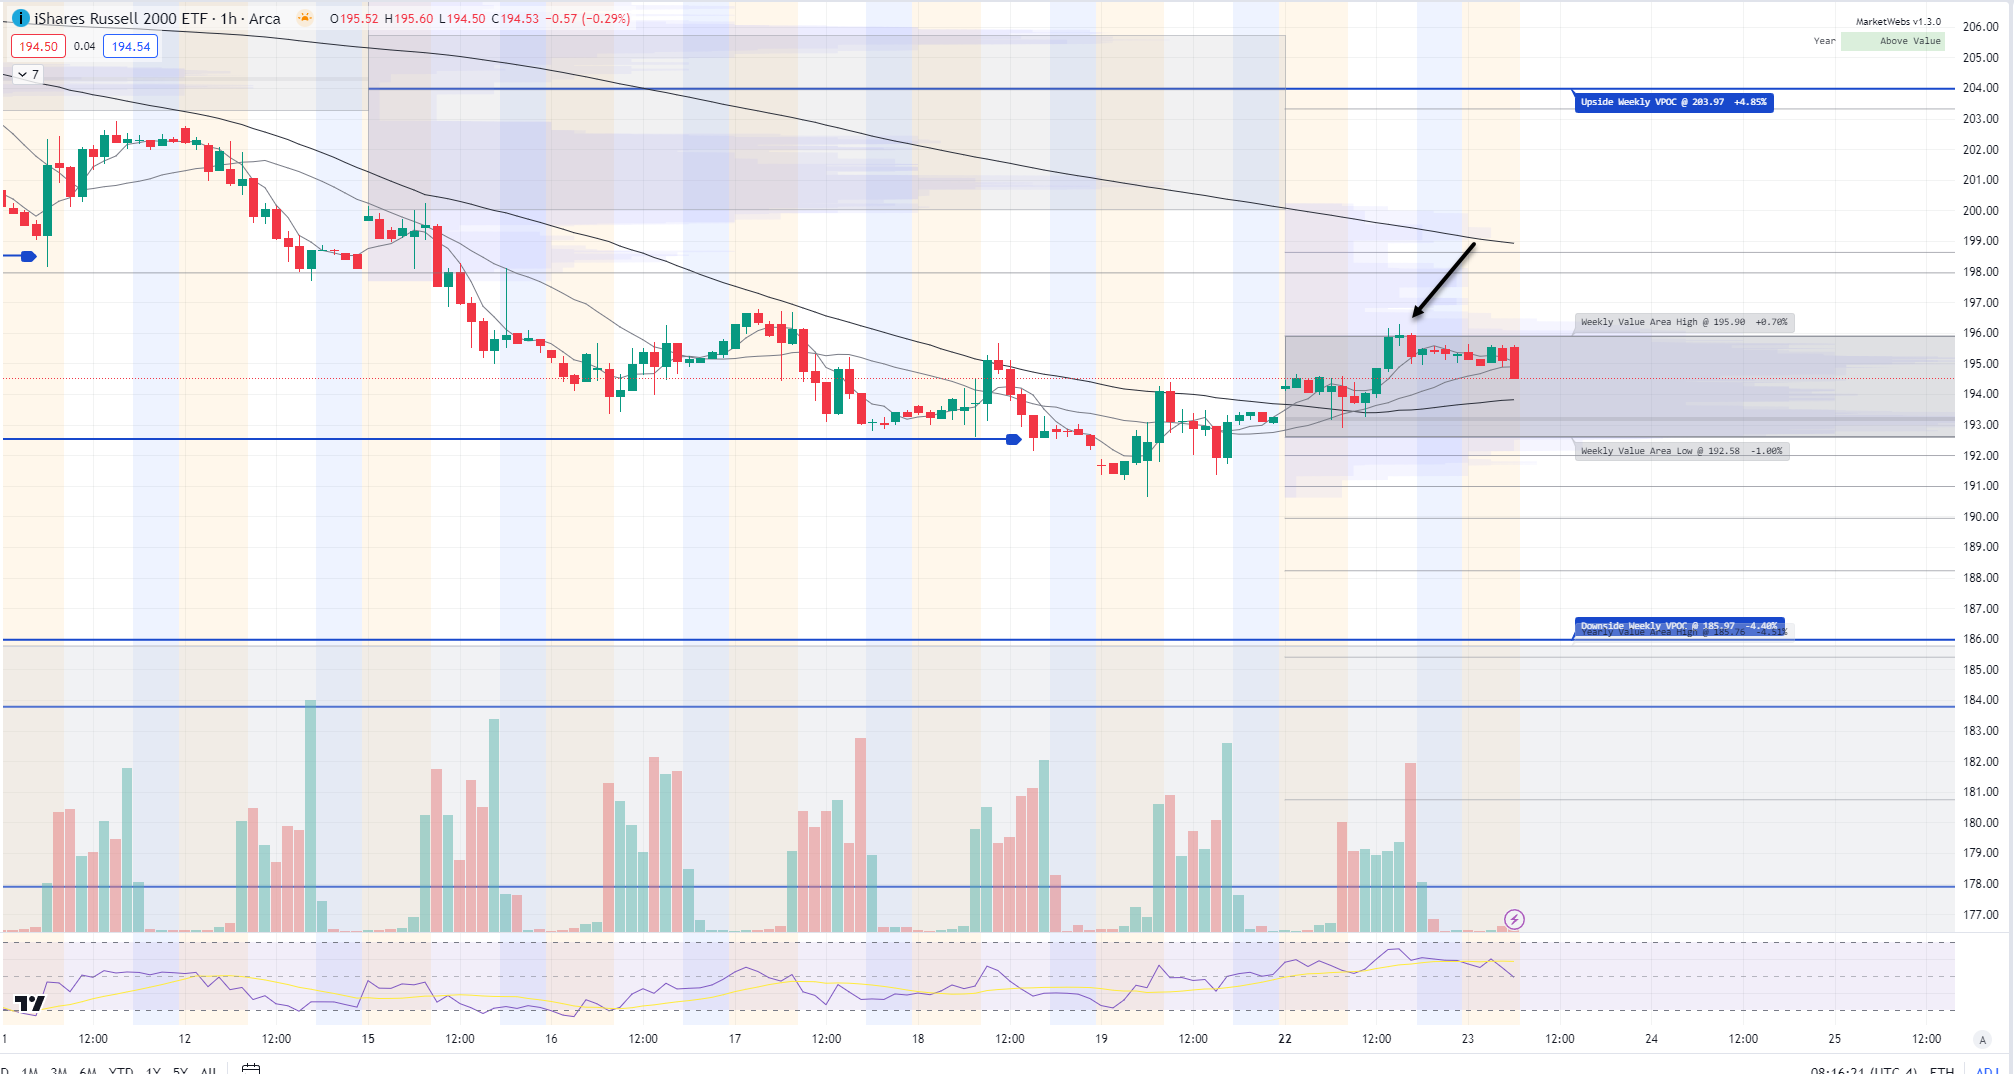
1hr chart: Price hit the top of its Value Area (resistance) yesterday and we rejected on its 1st attempt, level to watch here is $195.90 (support $192.58)
Here is today’s TTG Proprietary Stock Screen “Out of the Box” using Volume At Price
names trending above their Value Areas (on 3 multiple timeframes & not super extended)
Keep reading with a 7-day free trial
Subscribe to The Tribeca Trade Group to keep reading this post and get 7 days of free access to the full post archives.