

TTG Index Charts & Out of the Box Stock Screen 3/15/24 $PBF
TTG Index Charts & Out of the Box Stock Screen 3/15/24 $PBF
Out of the Box MarketWebs Screen
US Dollar flat / 30yr Bonds +0.3% / Crude -0.9% & Nat Gas -0.1% / Gold -0.1% / Copper +1.4% / BTC -2.1%
US Upcoming Economics

US Bond Yields

Index Updates
At TTG, I use Volume At Price in my chart analysis and I use the MarketWebs Indicator to provide Value Areas & VPOCs which indicate significant support & resistance levels. Learn More Here about Volume At Price and the MarketWebs.
Reminder today is Quadruple Witching, here is a short video on what to expect on these days:
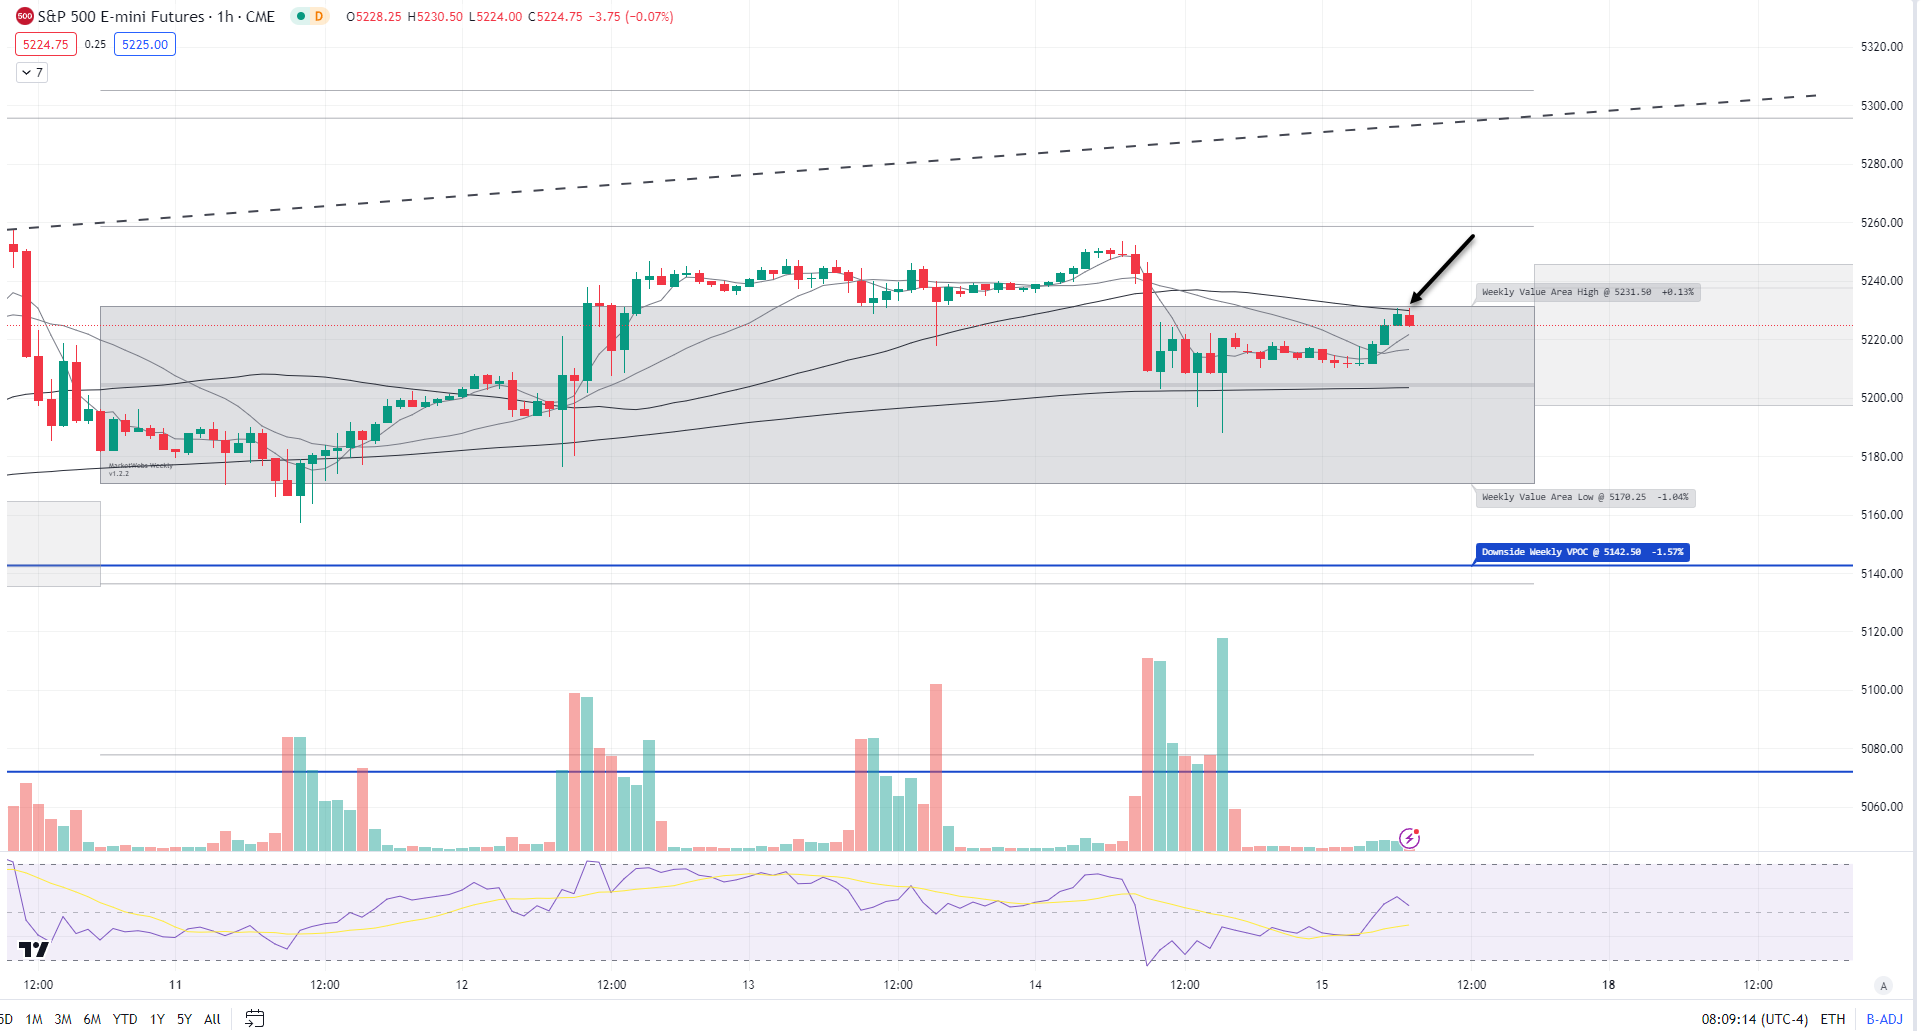
ES_F - SPX Futures - Price slightly higher ahead of quad witching - a reminder that there will be heavy volume at open and index futures expire and on the close for S&P / Nasdaq qly index rebalancing. Price remains in the uptrend channel
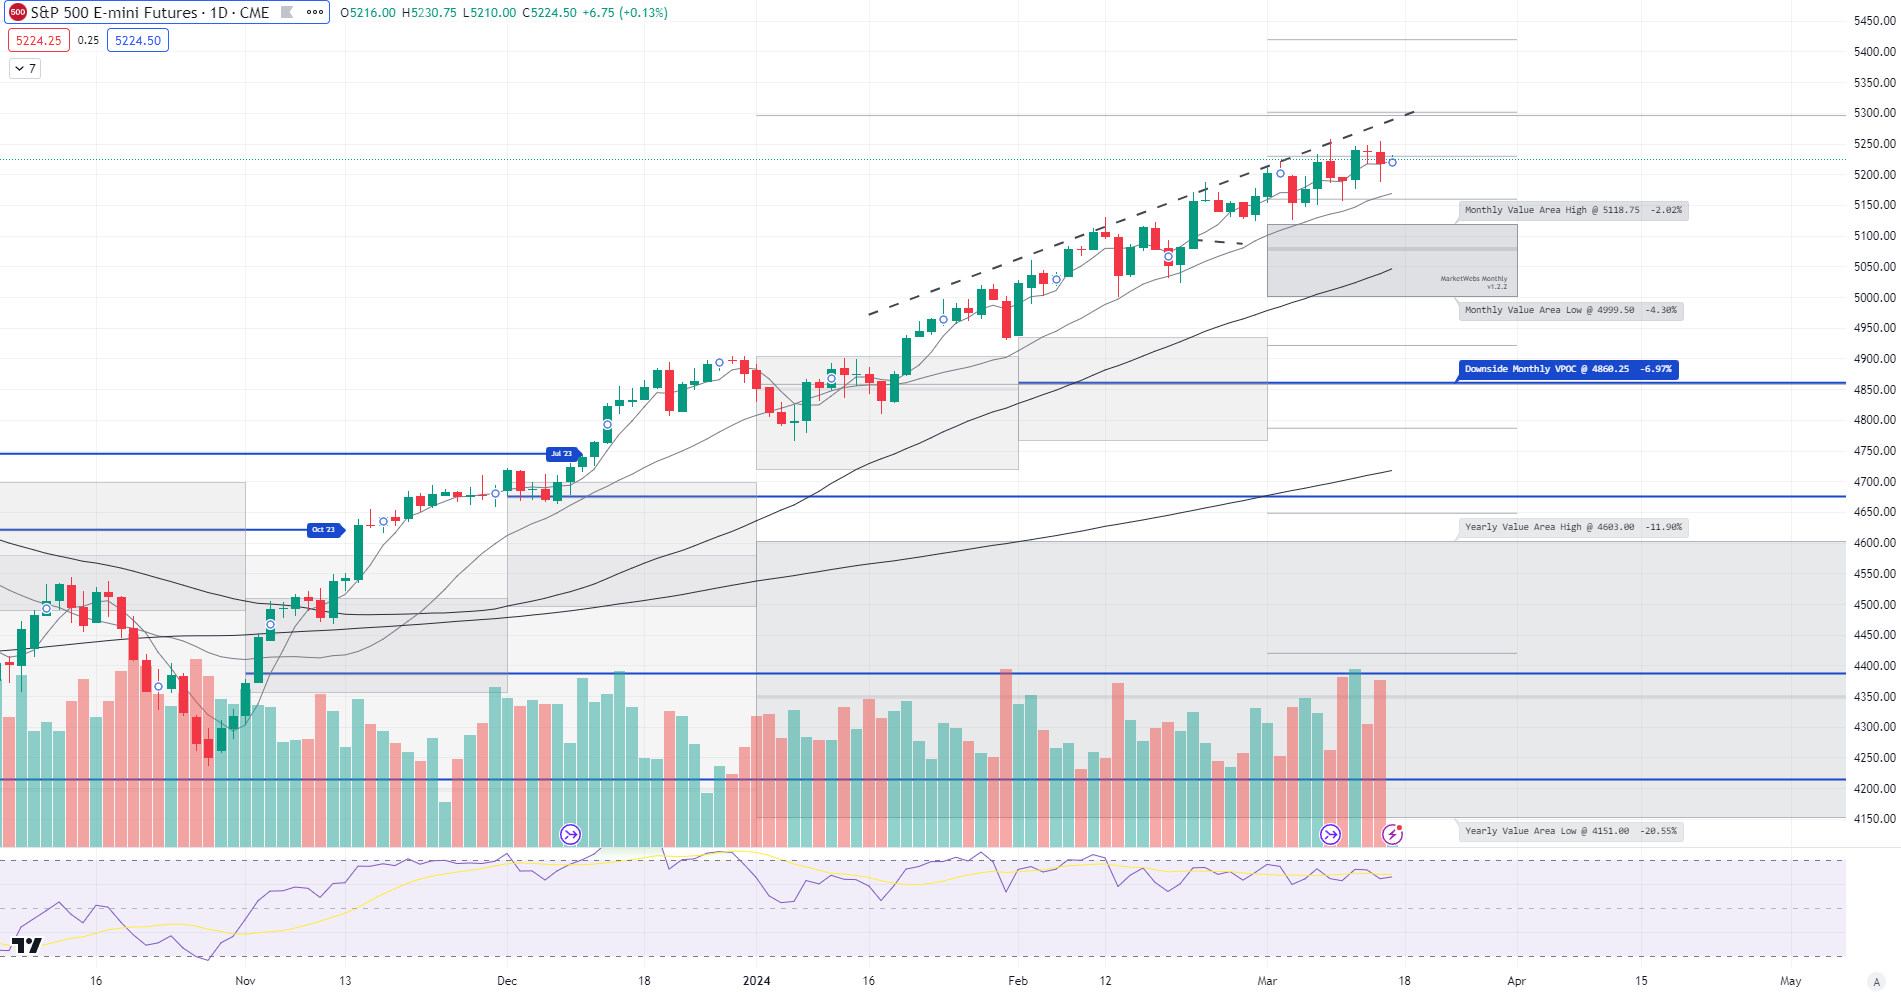
1hr chart: Price is back inside its Value Area for the week , watch 5231.5 top of Value
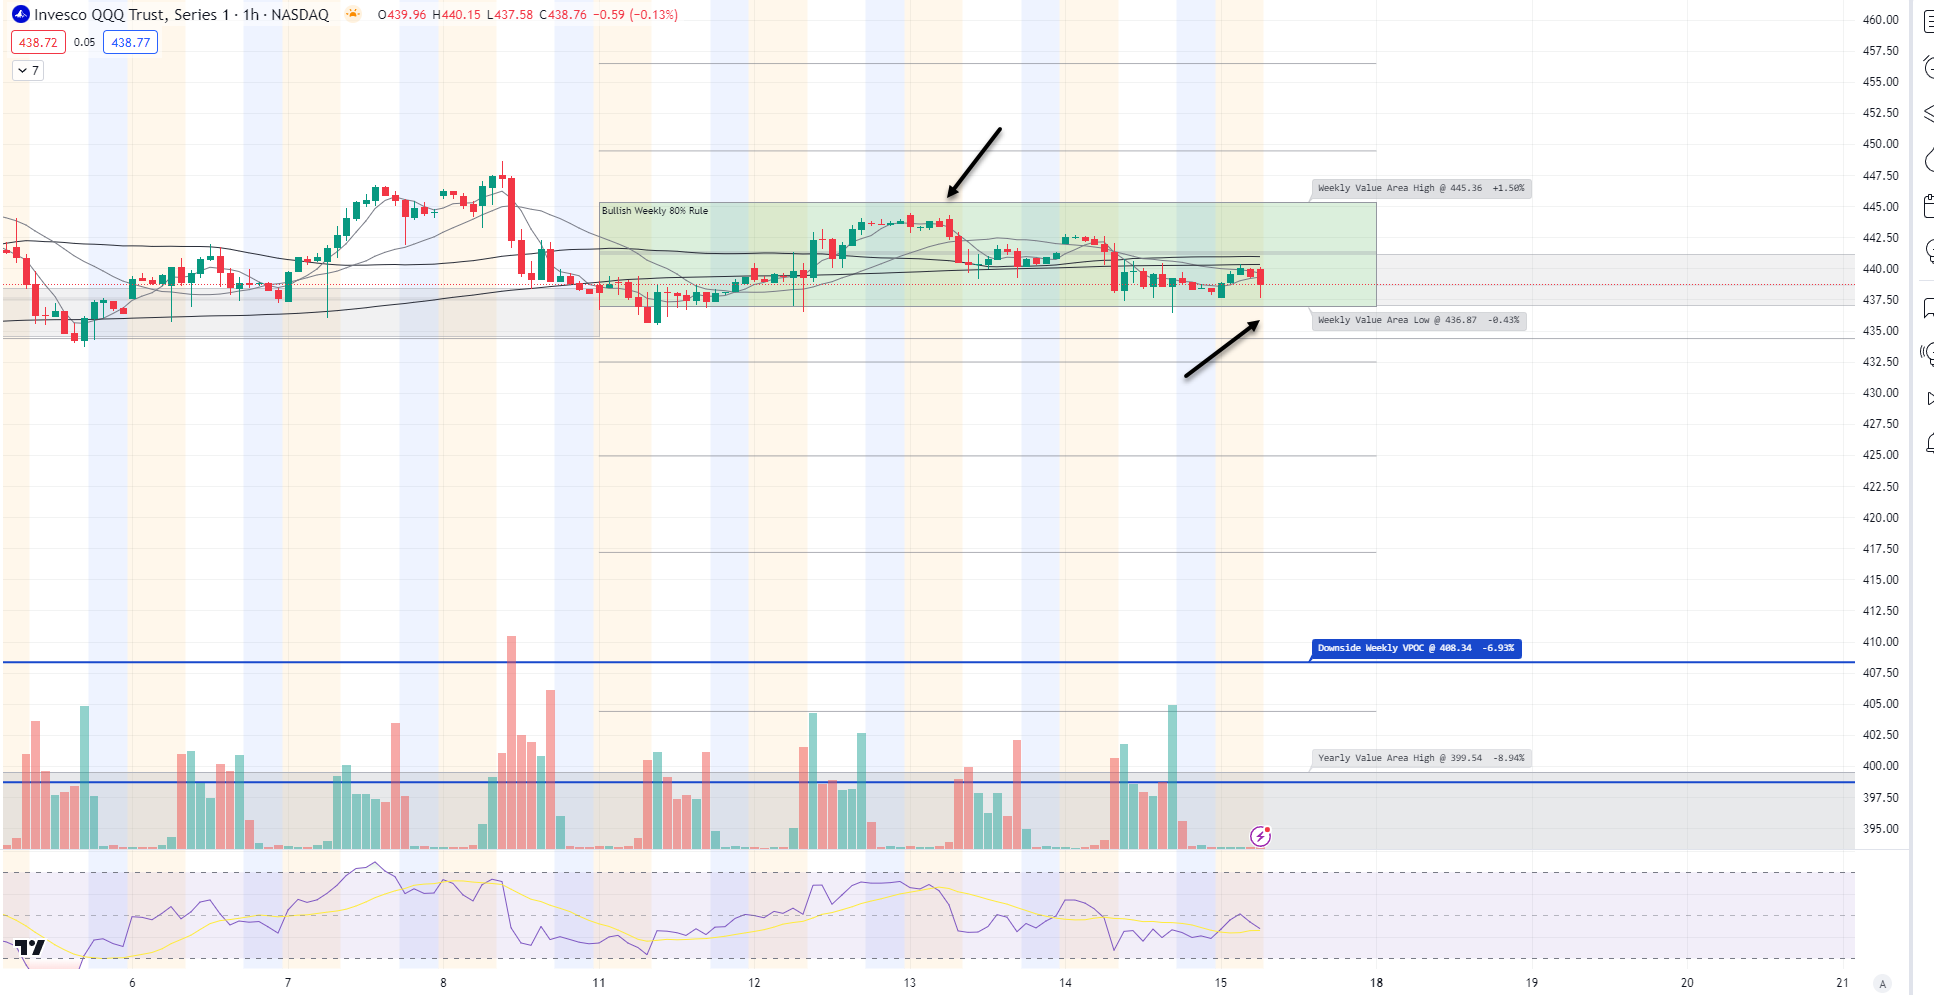
QQQ - NDX 100 ETF - Daily chart: Price closed just above its Value Area for March. Level to watch here is $439.06 and next 20d MA

1hr chart: After testing the top of Value Area resistance price now right around bottom of Value, support to watch is $436.87 - price has been range bound all week
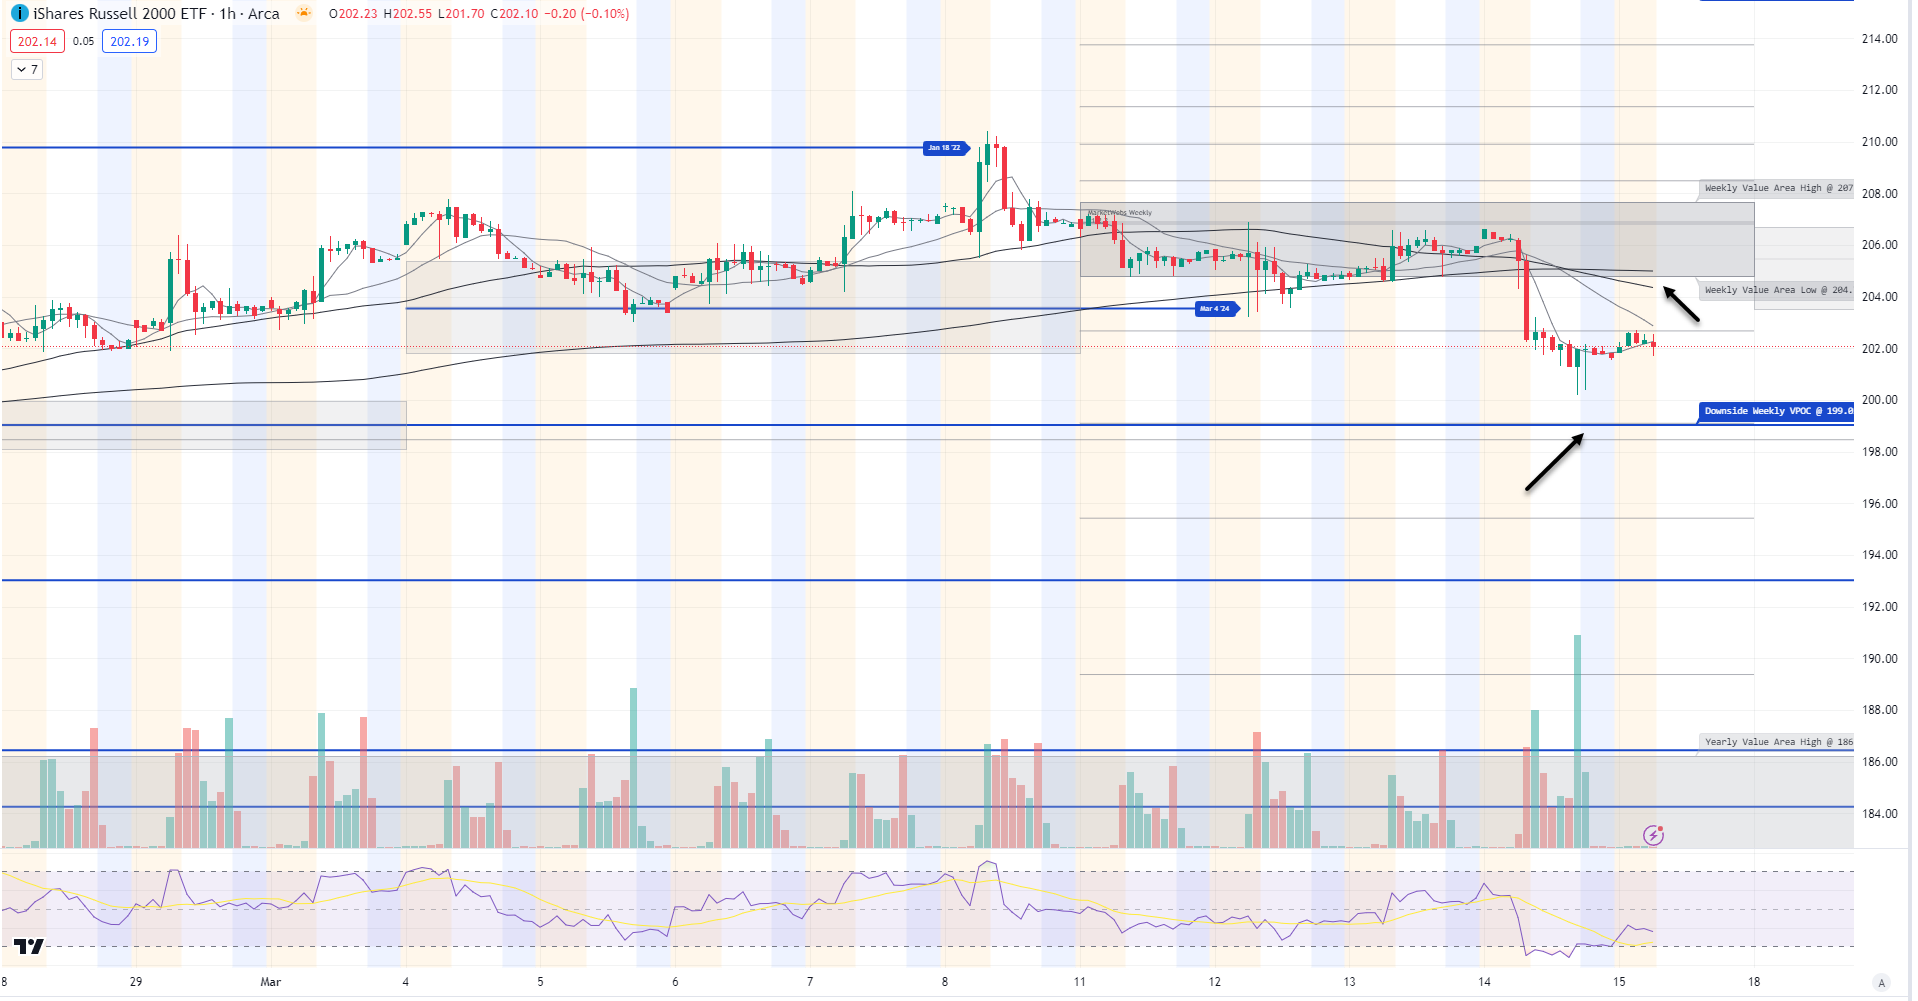
IWM - Russell Small Cap ETF- Price fell down to the top of March Value Area (IWM -1.8%) and bounced a bit , watch to see if price can hold support $200.79
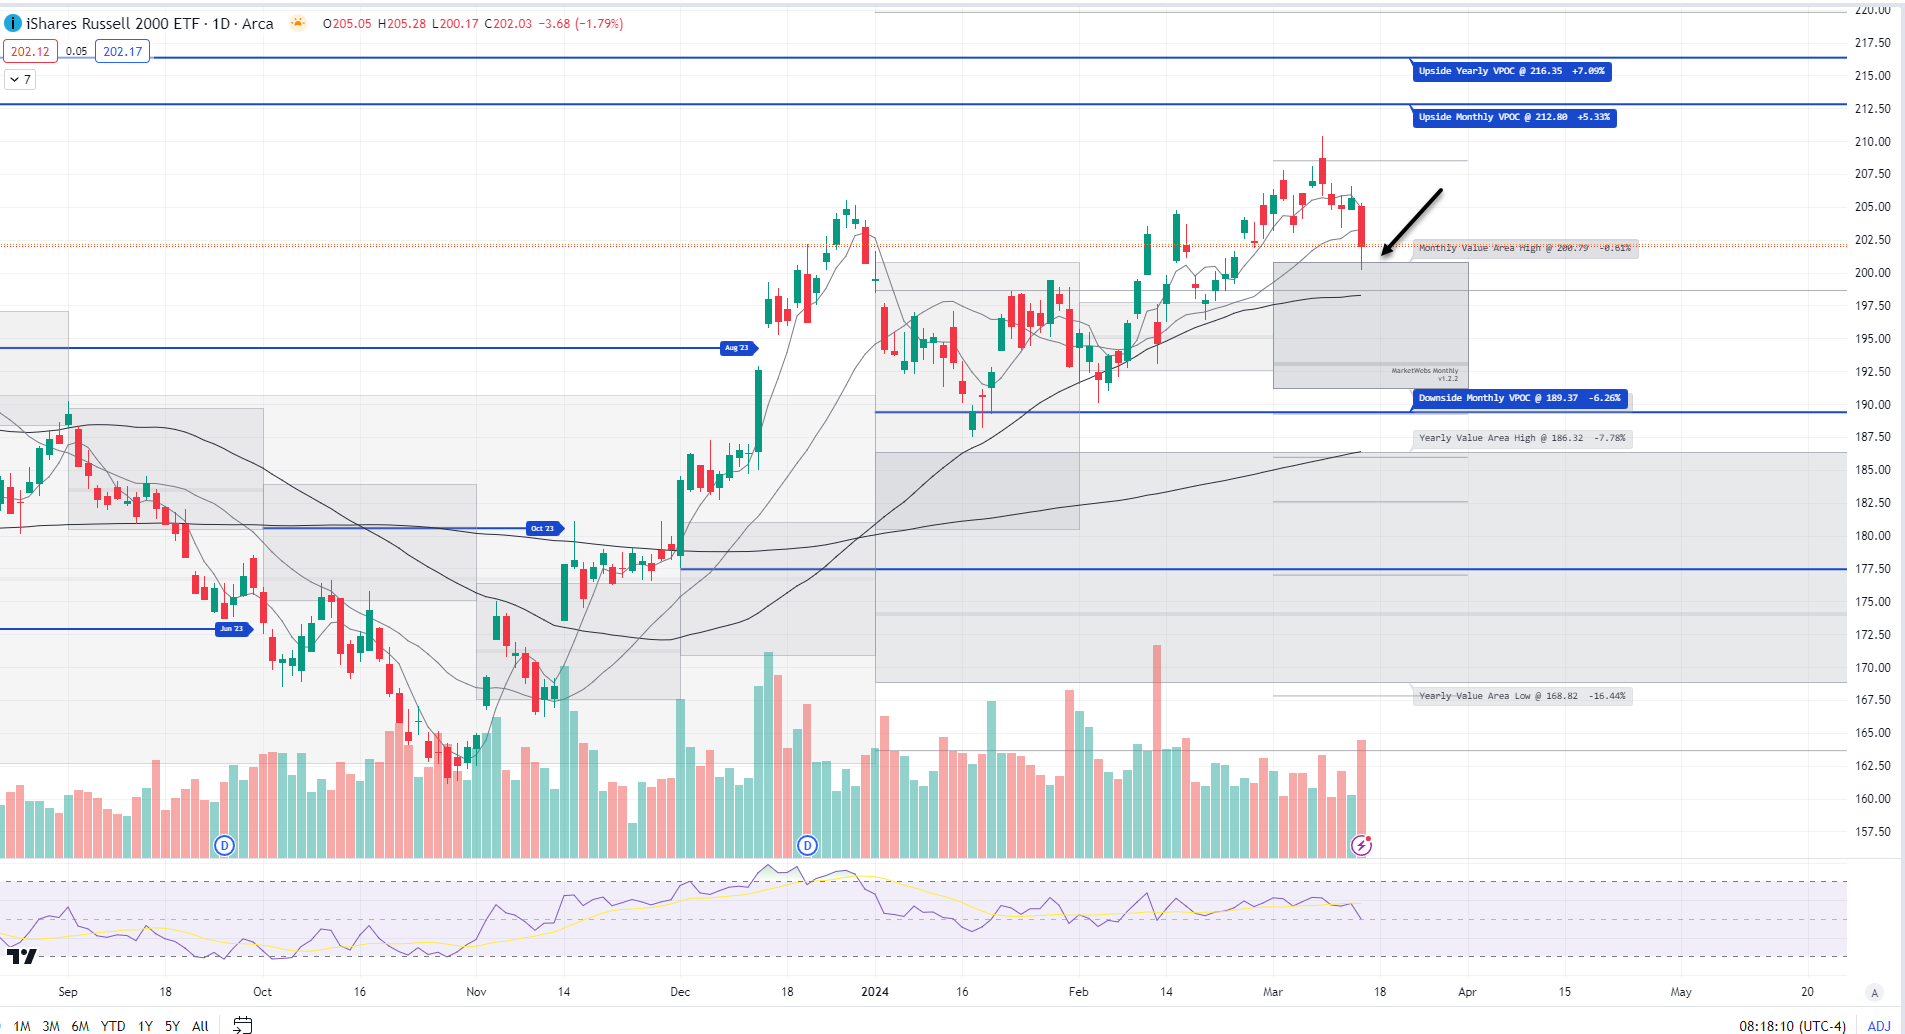
1hr chart: Price broke below its Value Area for the week , resistance is up at $204.75 and lower VPOC to watch $199.02
Here is today’s TTG Proprietary Stock Screen “Out of the Box” using Volume At Price
names trending above their Value Areas (on 3 multiple timeframes & not super extended)
Keep reading with a 7-day free trial
Subscribe to The Tribeca Trade Group to keep reading this post and get 7 days of free access to the full post archives.