TTG Index Charts & Out of the Box Stock Screen 5/30/23 $ROK $AMKR $ROBO
Out of the Box MarketWebs Screen
Index Updates
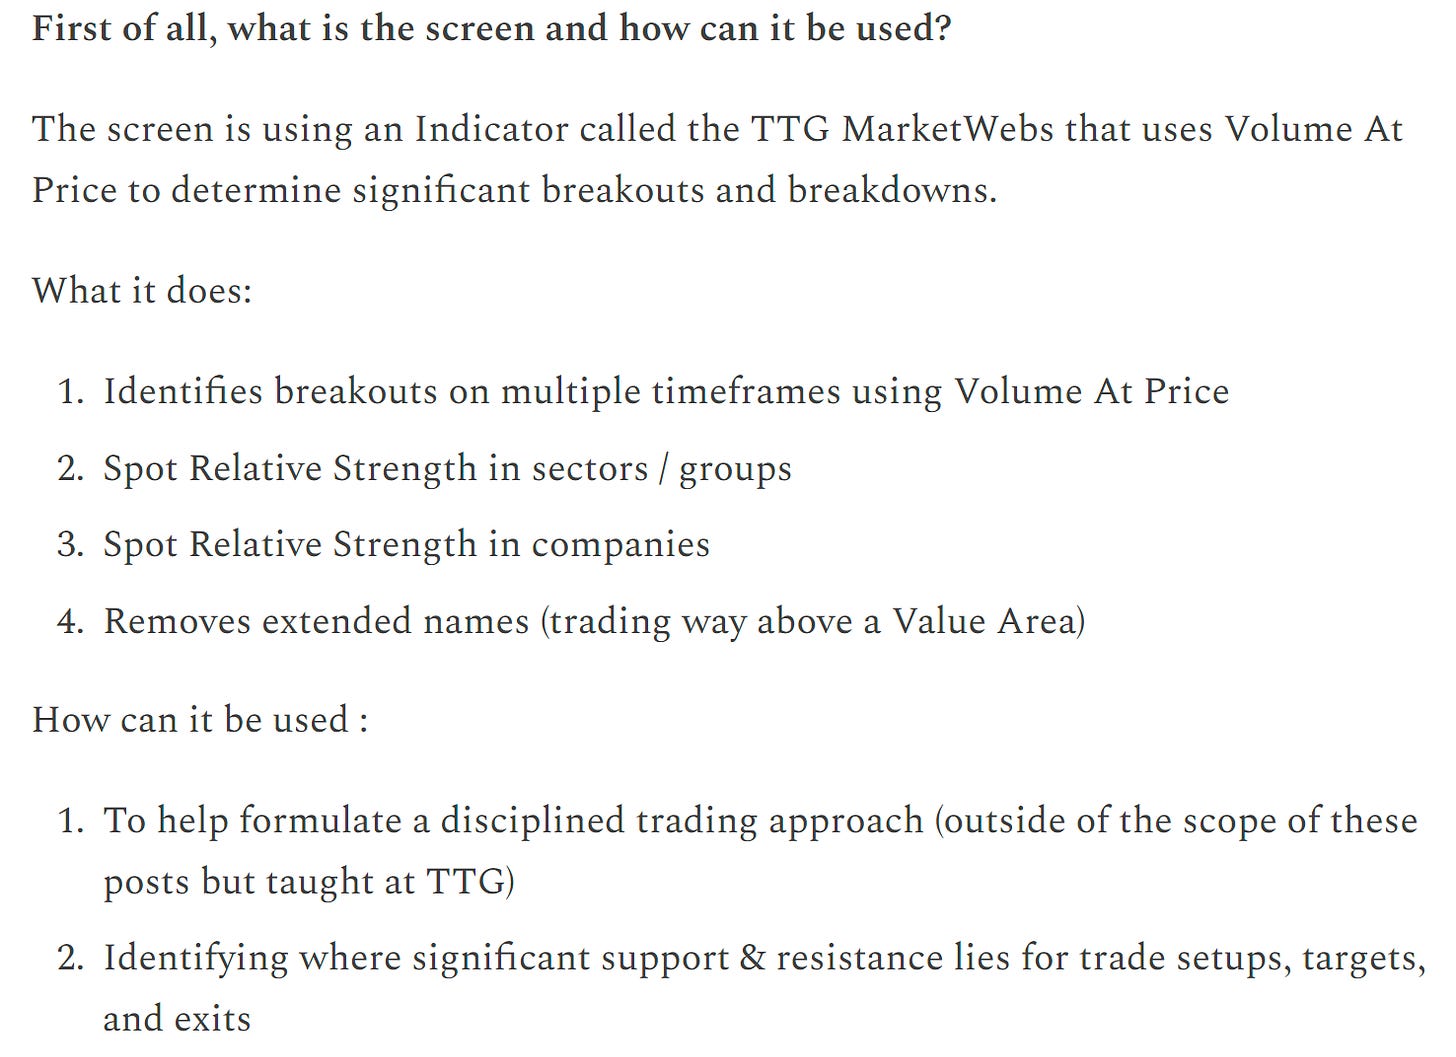
At TTG, I use Volume At Price in my chart analysis and I use the MarketWebs Indicator to provide Value Areas which indicate significant support & resistance levels. Learn More Here about Volume At Price and the MarketWebs.
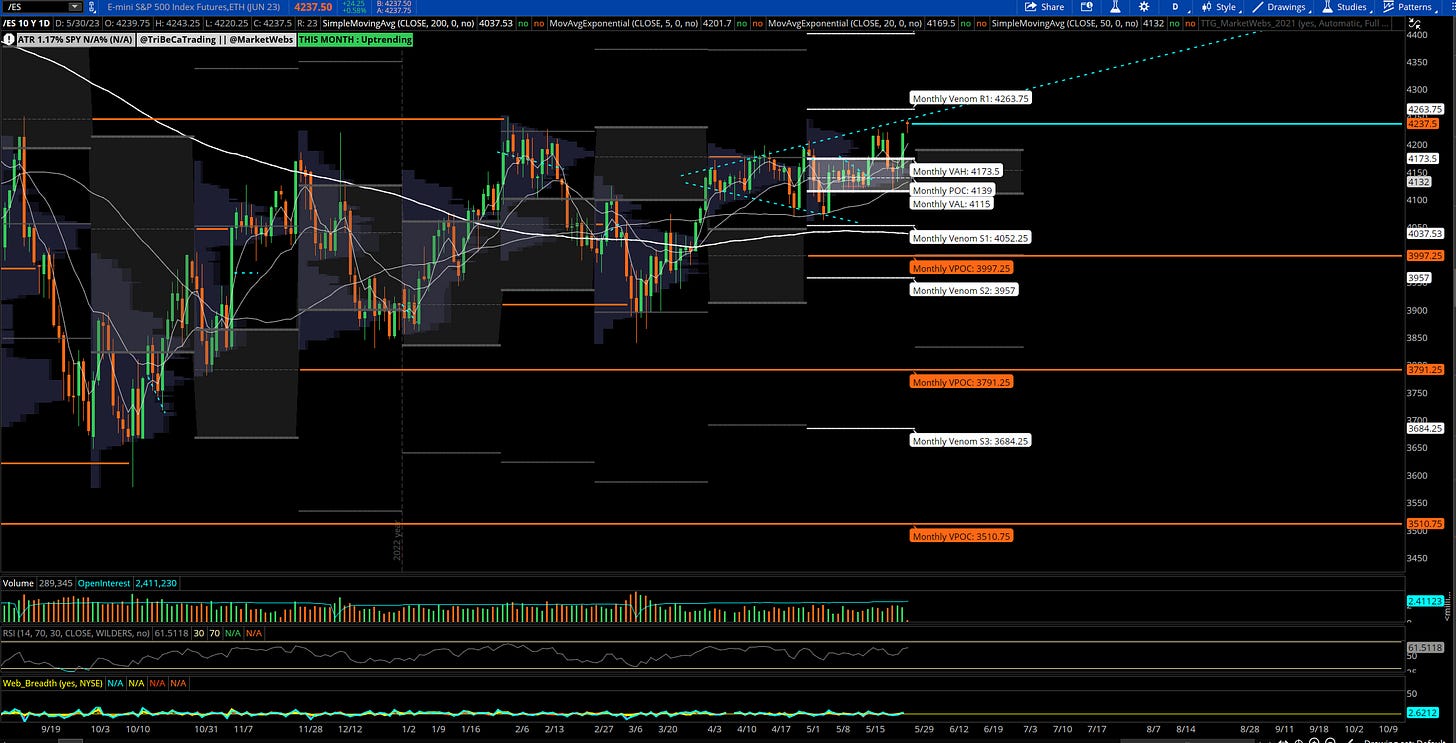
$ES_F - S&P futures - Daily chart: Price extending higher after a 3d weekend and above its May Value Area, following along a trendline I have added
US Dollar -0.3% / 30yr Bonds +1.2% / Crude -1.0% & Nat Gas -2.7% Copper flat / Cryptos are higher, BTC +5%
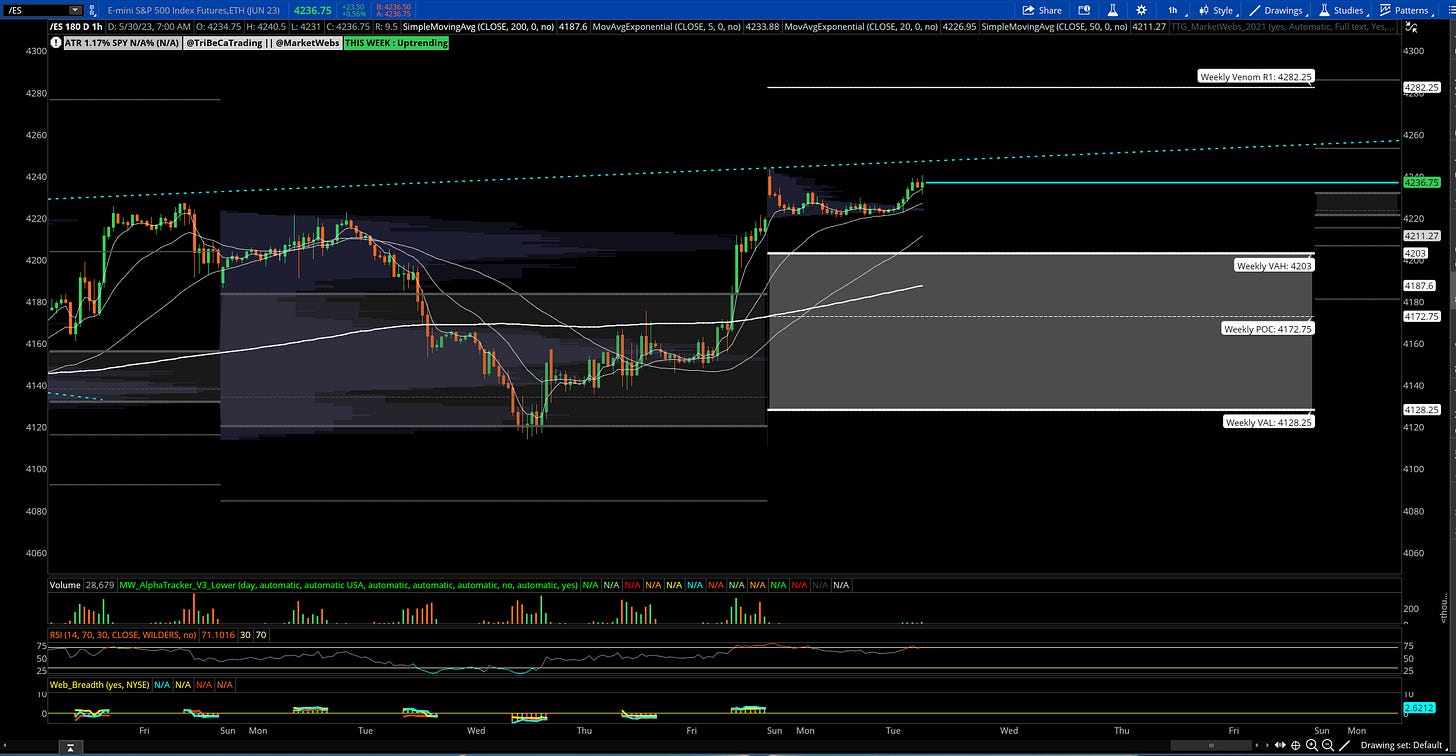
1hr chart: Price starts the week above its Value Area for the week, top of value support 4203
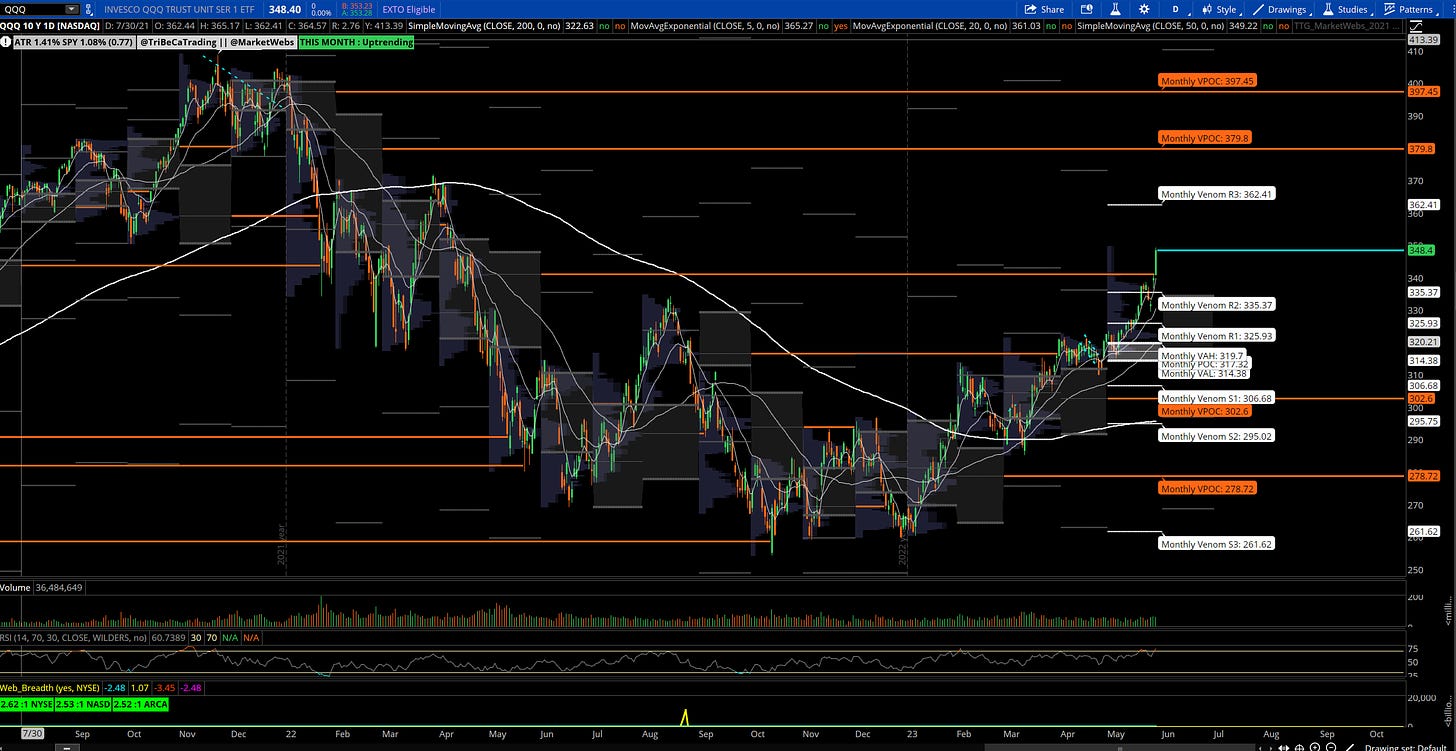
QQQ - NDX - Daily Chart: Price tacking on more gains, +1.4% & extending above the last VPOC take out
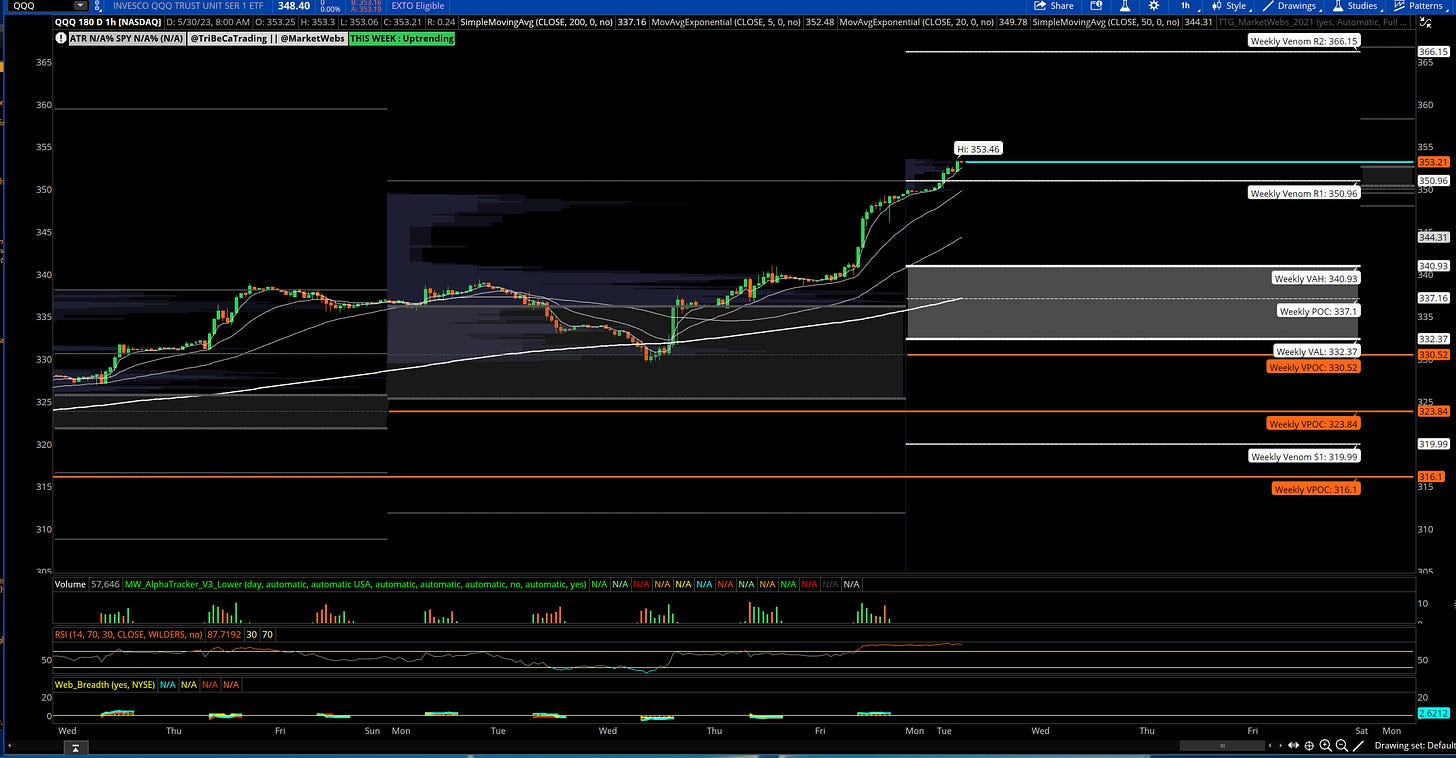
1hr chart: Price decently above its Value Area for the week
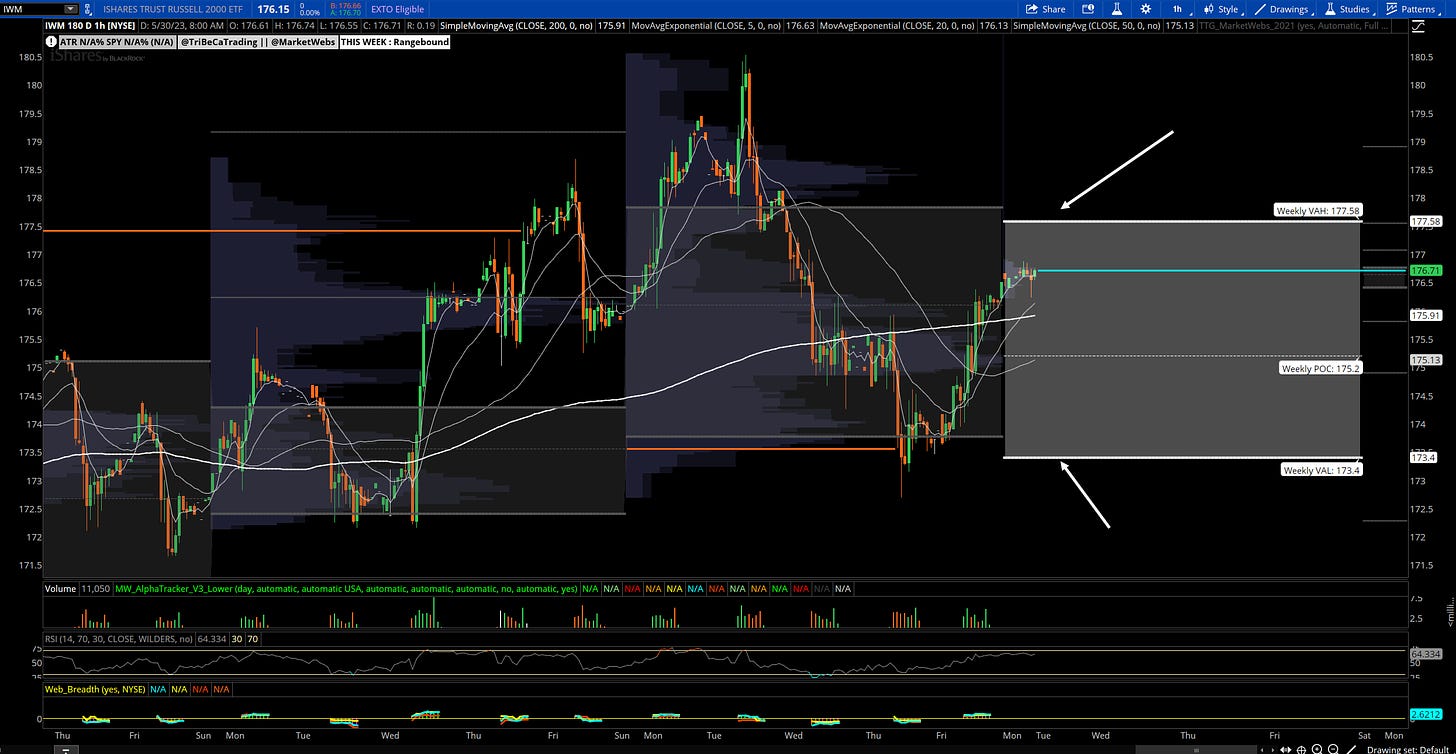
IWM- Russell Small Cap ETF- Daily Chart: Price up this morning but underperforming once again the other indices and remains inside its Value Area for the month of May , support $174.32
1hr chart: $ZB_F - Price starts the week inside its Value Area for the week, resistance $177.58
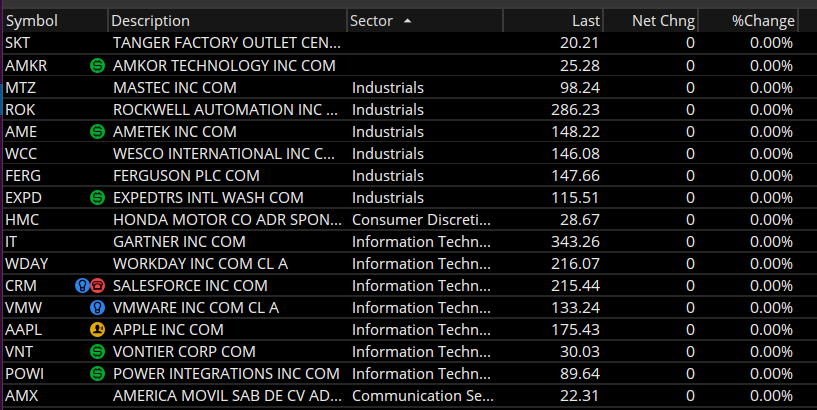
Here is today’s TTG Proprietary Stock Screen “Out of the Box” using Volume At Price
Remember, I am only showing a few setups from the list here and review more in the TTG Trading Room. I provide a more detailed watchlist every weekend to start the week at TTG.
Charts
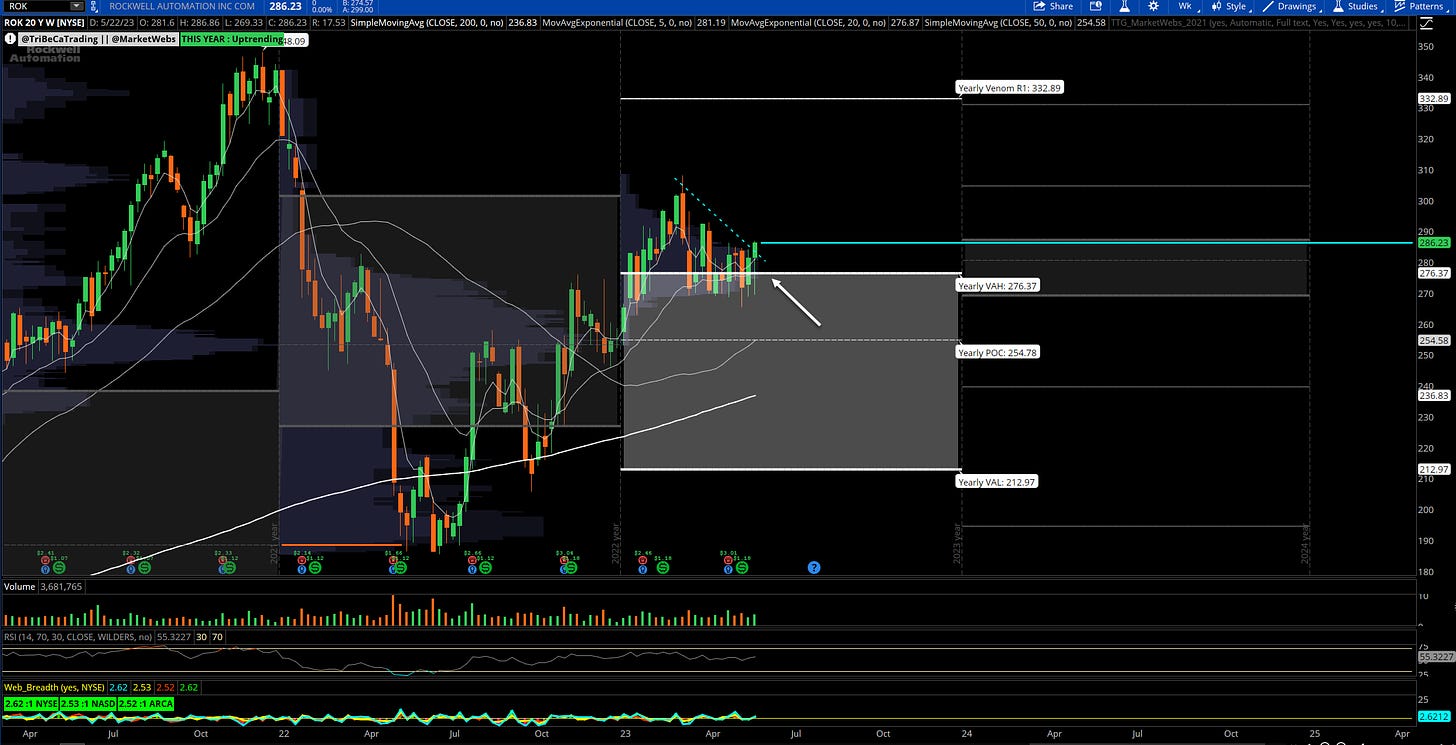
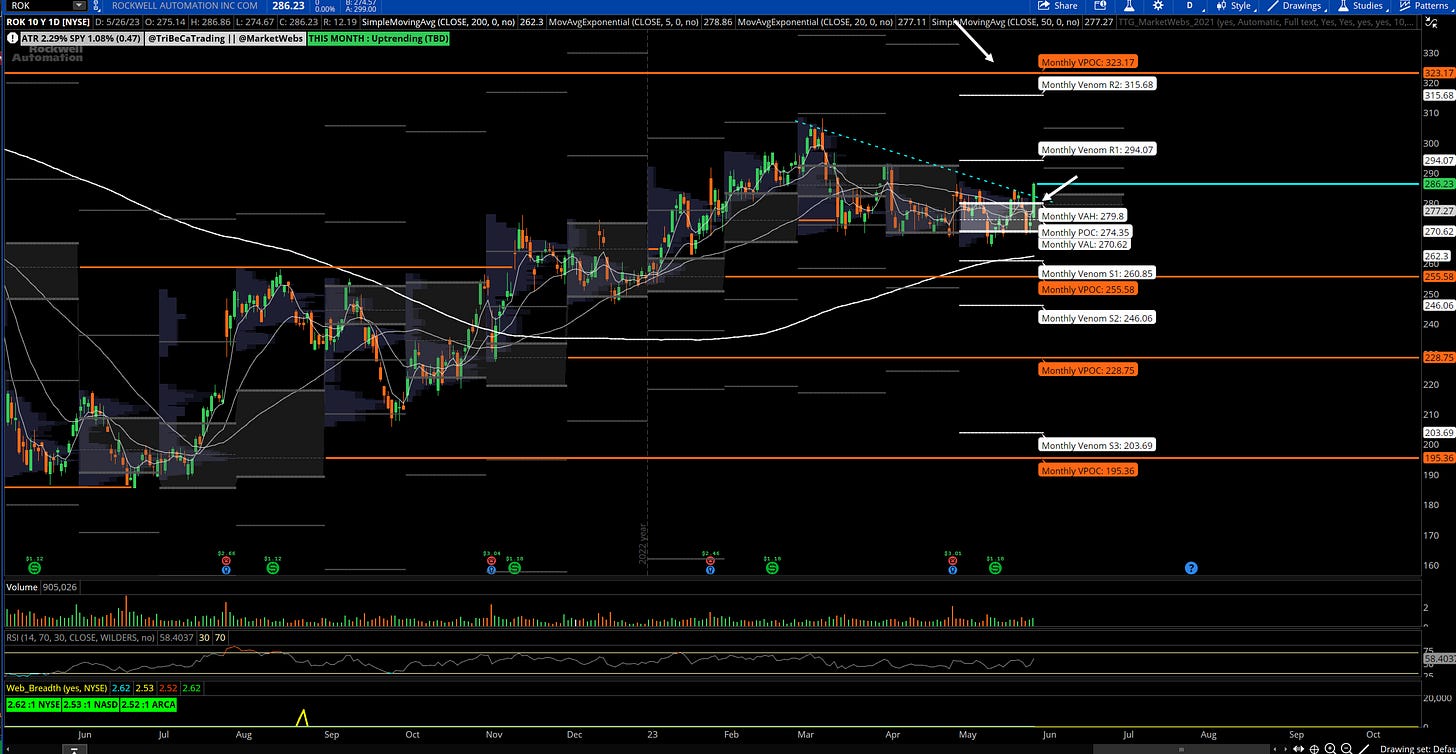
ROK Weekly & Daily chart
Rockwell Automation, Inc. produces industrial automation products. The Company offers products such as control systems, motor control devices, sensors, and industrial control panels. Rockwell Automation markets its products worldwide.(Bloomberg)
-suggested stop price $279 using the TTG MarketWebs
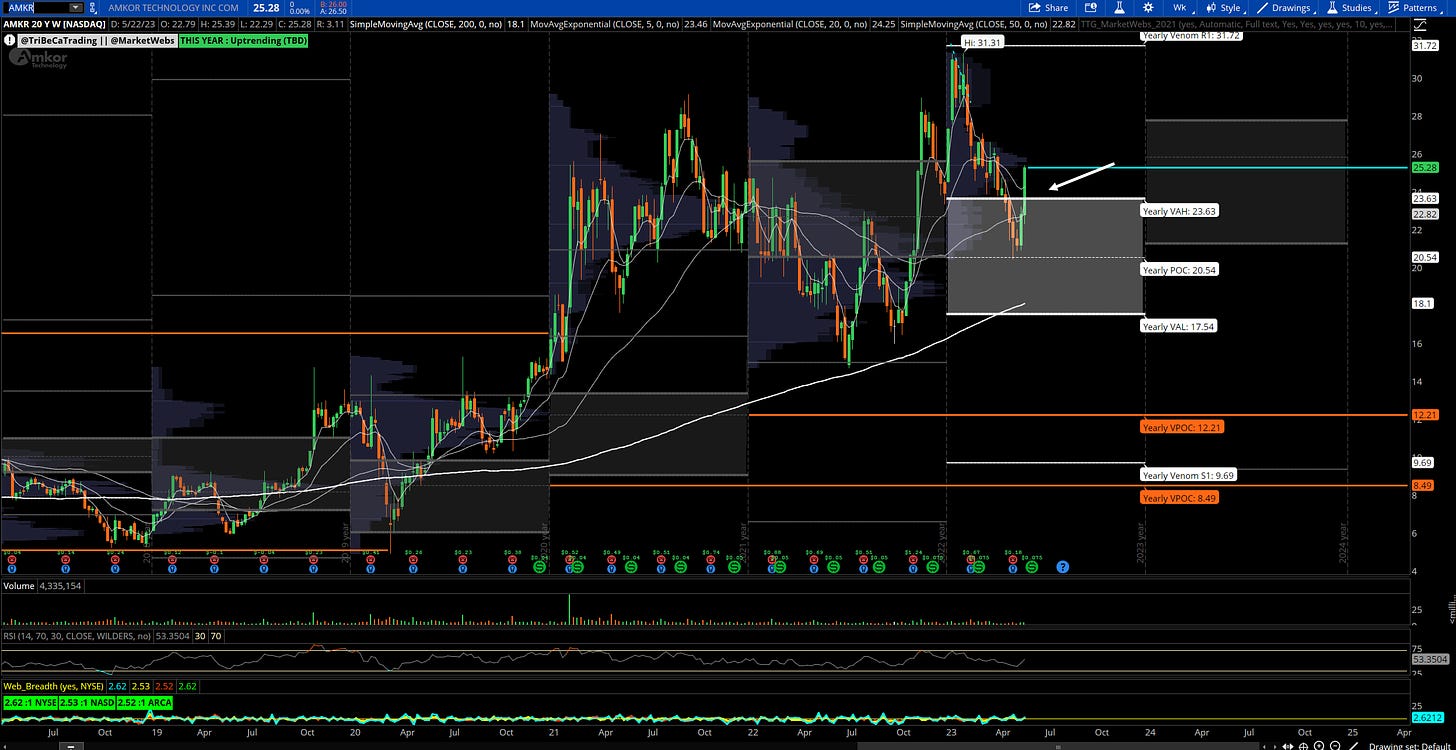
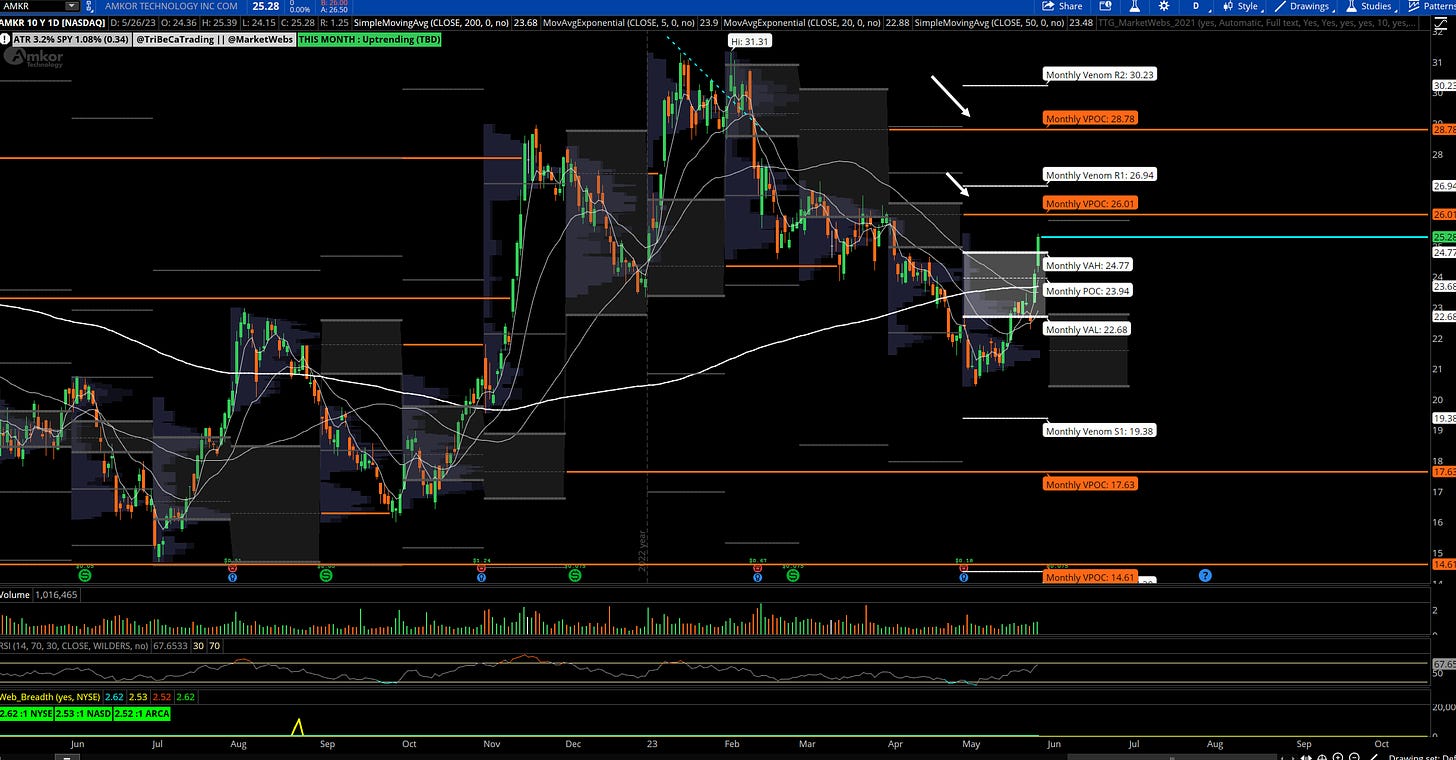
2. AMKR Weekly & Daily chart
Amkor Technology, Inc. provides semiconductor packaging and test services. The Company offers deep submicron wafer fabrication, wafer probe testing, integrated circuit packaging assembly and design, final testing, reliability testing, burn-in, and electrical characterization. (Bloomberg)
-suggested stop price $23 using the TTG MarketWebs
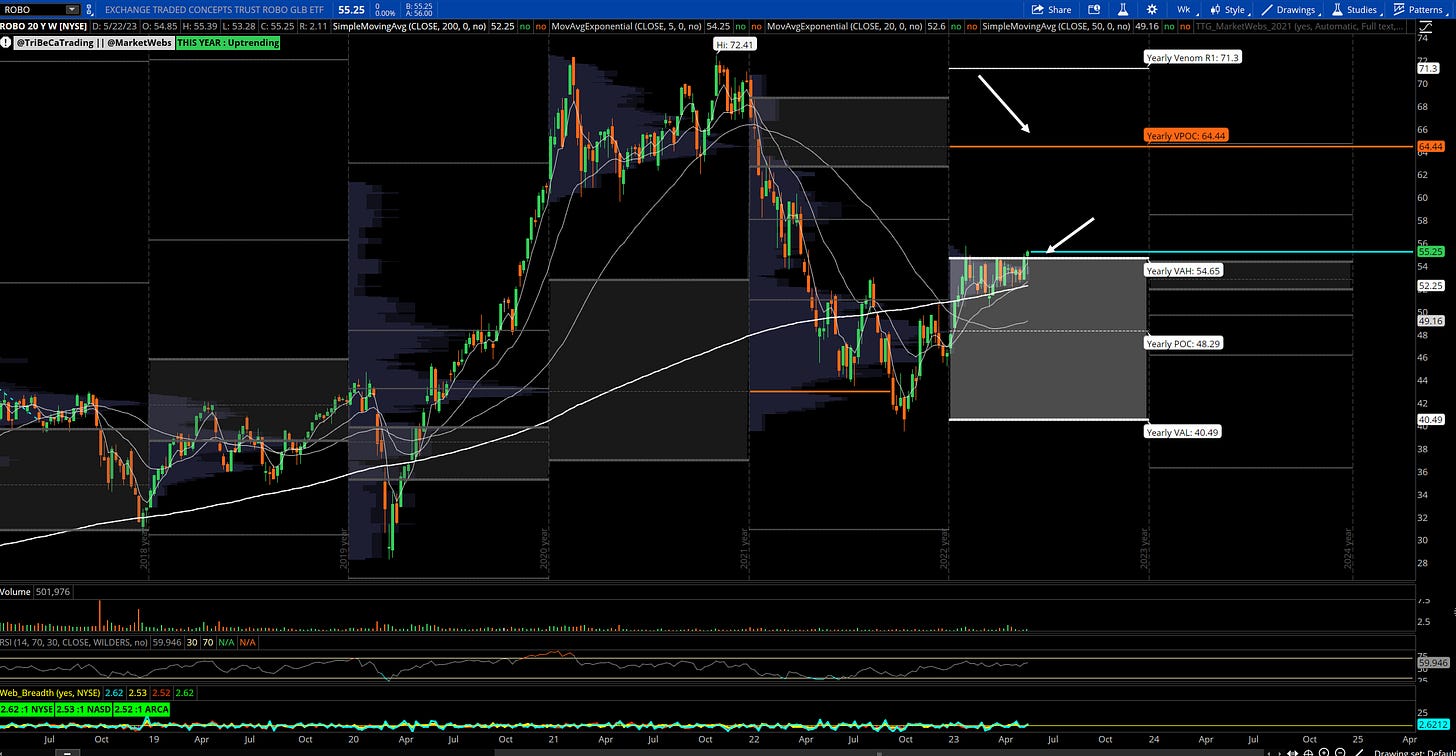
3. ROBO Weekly & Daily chart
Robo Global Robotics & Automation Index ETF is an exchange-traded fund incorporated in the USA. The ETF seeks to track the performance of the ROBO Global Robotics and Automation Index. The ETF weights the holdings using a multi factor methodology that primarily holds US based information technology and industrial companies.
-really like the look of the ROBO ETF technically & this ETF has over 55% of the ETF that is International exposure so in my opinion, a great way to get exposure in Robotics and AI names outside the US.
-suggested stop price $54 using the TTG MarketWebs
Remember, this is just one type of screen / setup that I focus on in my analysis!
Copyright © Tribeca Trade Group. All of the information in this newsletter is for entertainment and educational purposes only and is not to be construed as investment or trading advice. None of the information in this newsletter is guaranteed to be accurate, complete, useful or timely. IMPORTANT NOTICES AND DISCLAIMERS TriBeCa Trade Group is not an investment advisor and is not registered with the U.S. Securities and Exchange Commission or the Financial Industry Regulatory Authority. Further, owners, employees, agents or representatives of TriBeCa Trade Group are not acting as investment advisors and might not be registered with the U.S. Securities Authority


