TTG Index Charts & Out of the Box Stock Screen 8/29/23 $CNQ $URA
Out of the Box MarketWebs Screen
US Dollar +0.1% / 30yr Bonds -0.1%/ Crude +0.7% & Nat Gas -0.5% / Copper +0.2% / Cryptos are ~ flat
Index Updates
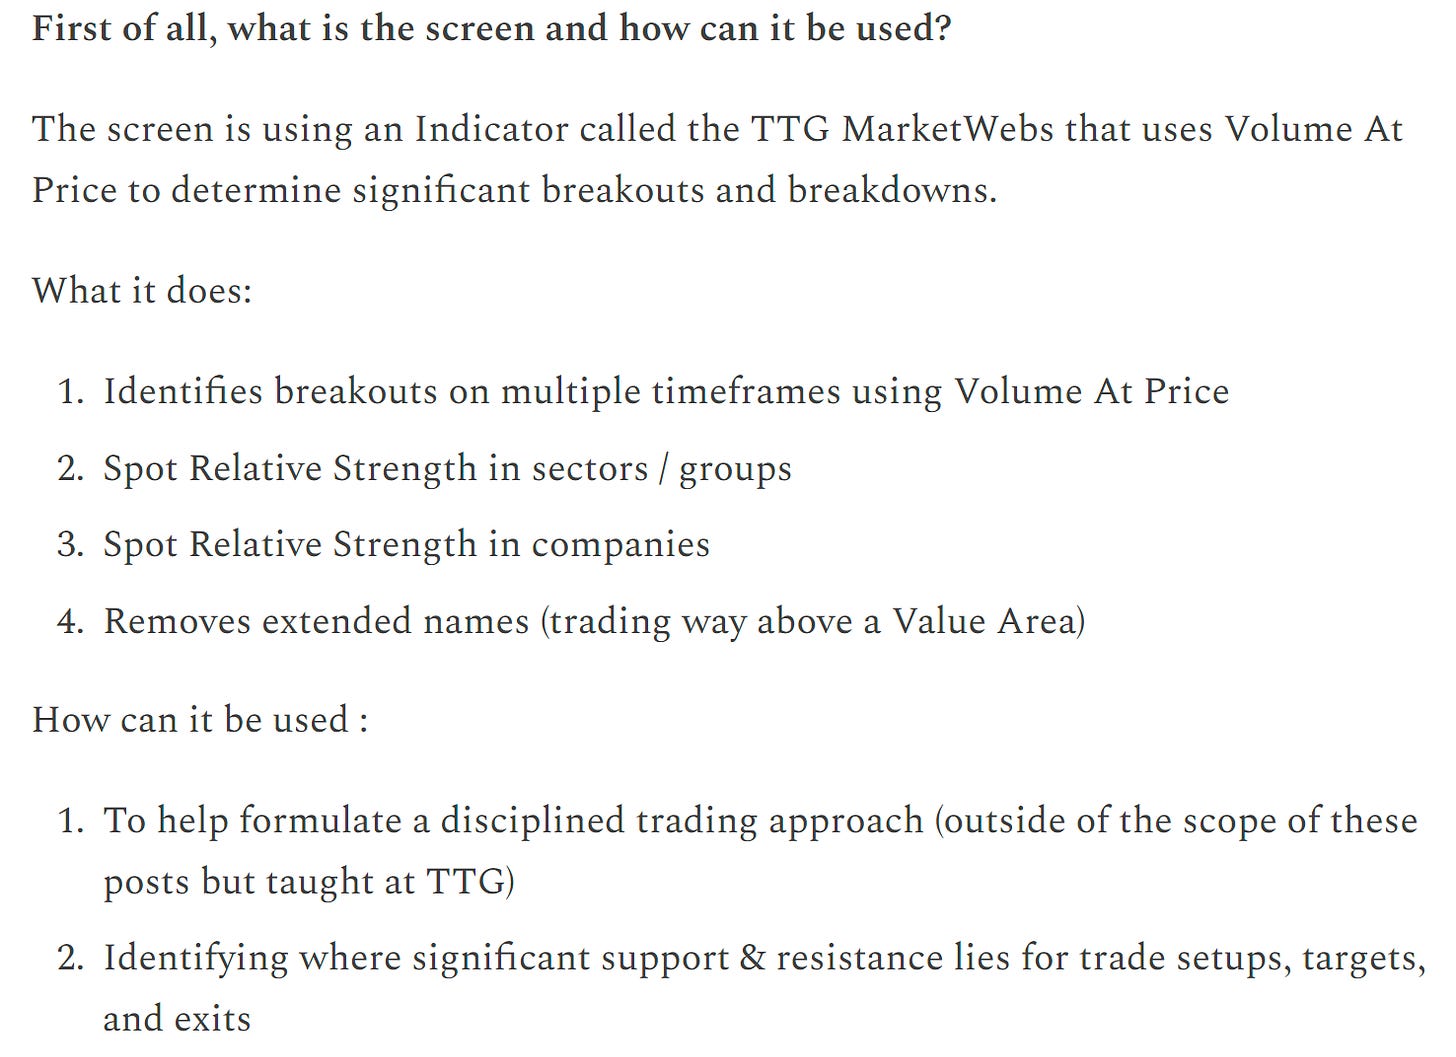
At TTG, I use Volume At Price in my chart analysis and I use the MarketWebs Indicator to provide Value Areas which indicate significant support & resistance levels. Learn More Here about Volume At Price and the MarketWebs.
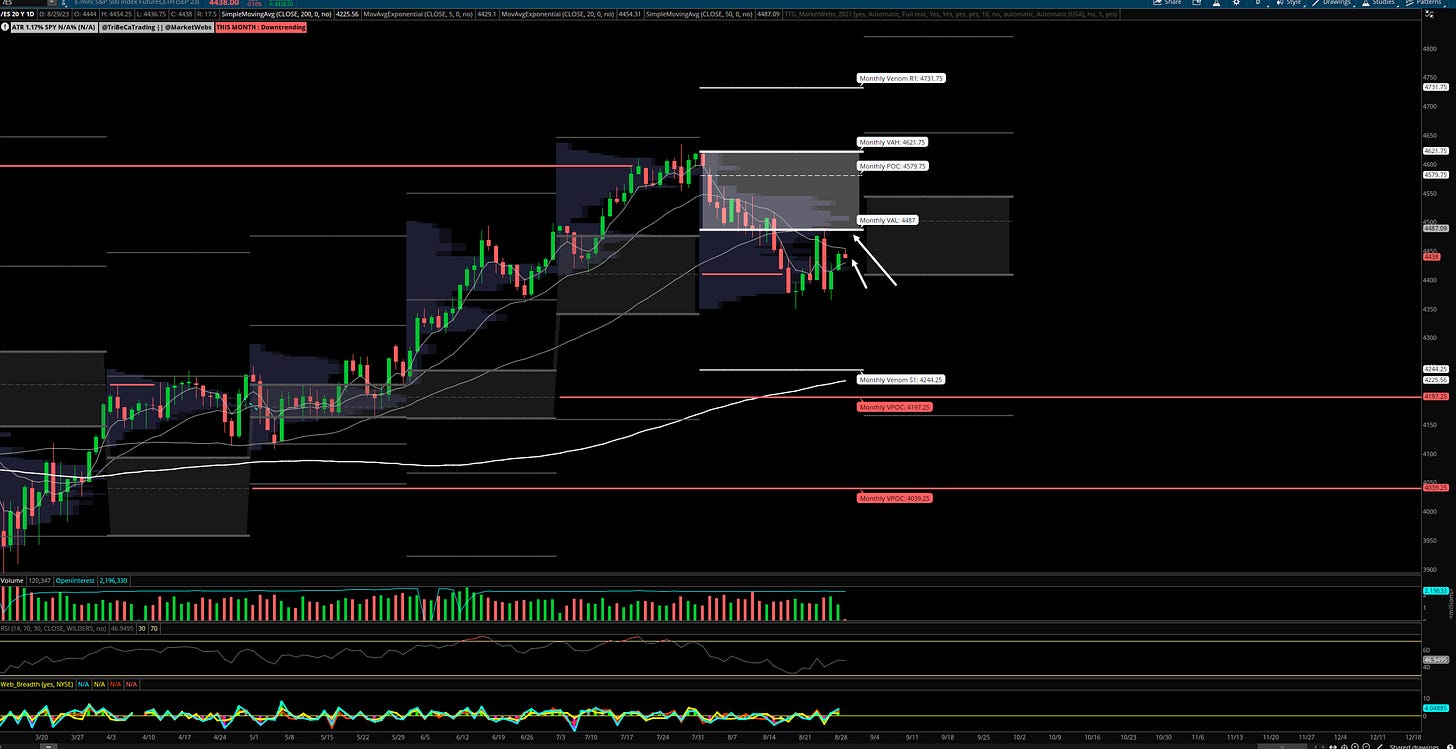
$ES_F - S&P futures - Daily chart: Price carving out a higher low but struggling a bit with overhead supply, 20d MA and further bottom of August Value Area, upside level to watch (resistance 4487)
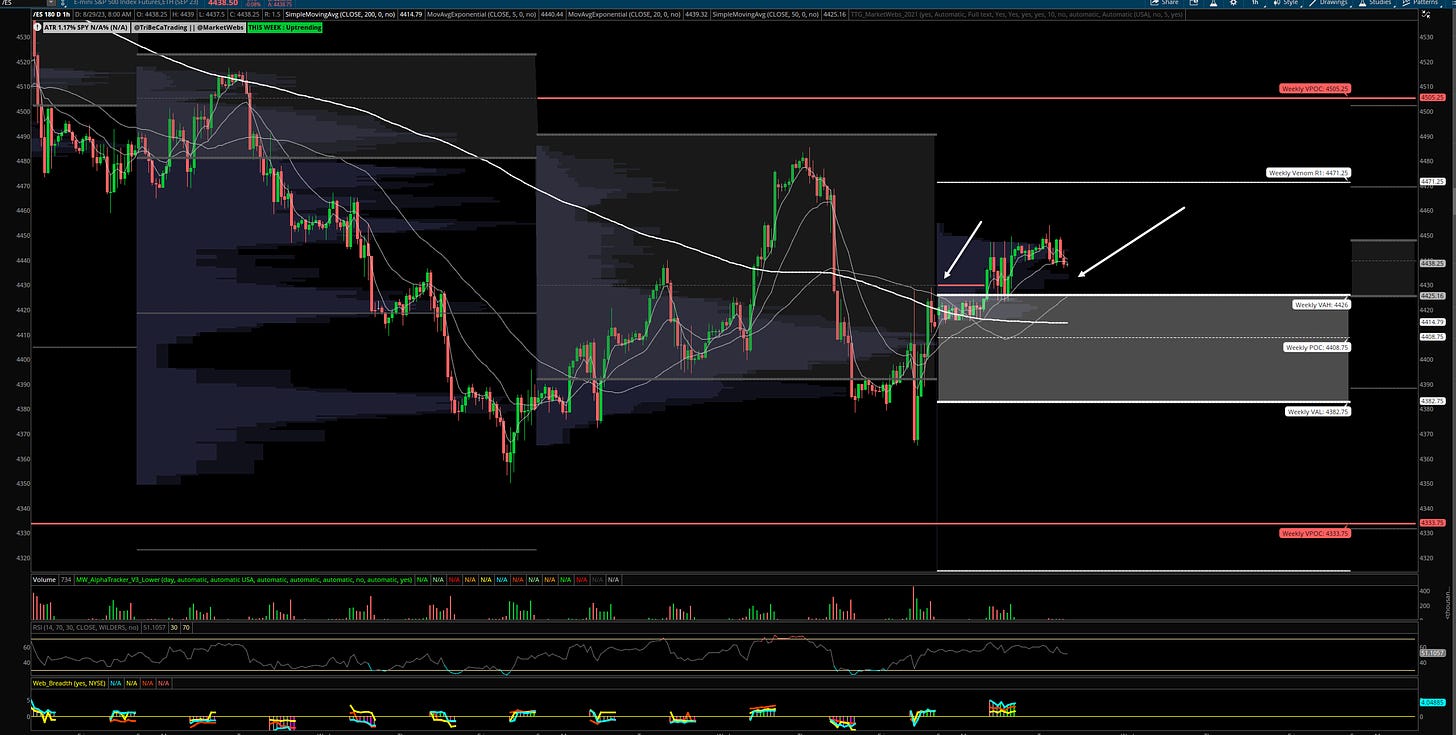
1hr chart: Price currently above its Value Area for the week and took out a VPOC (red line) yesterday. Let's see if price can begin to trend above that Value Area. Support is 4426.
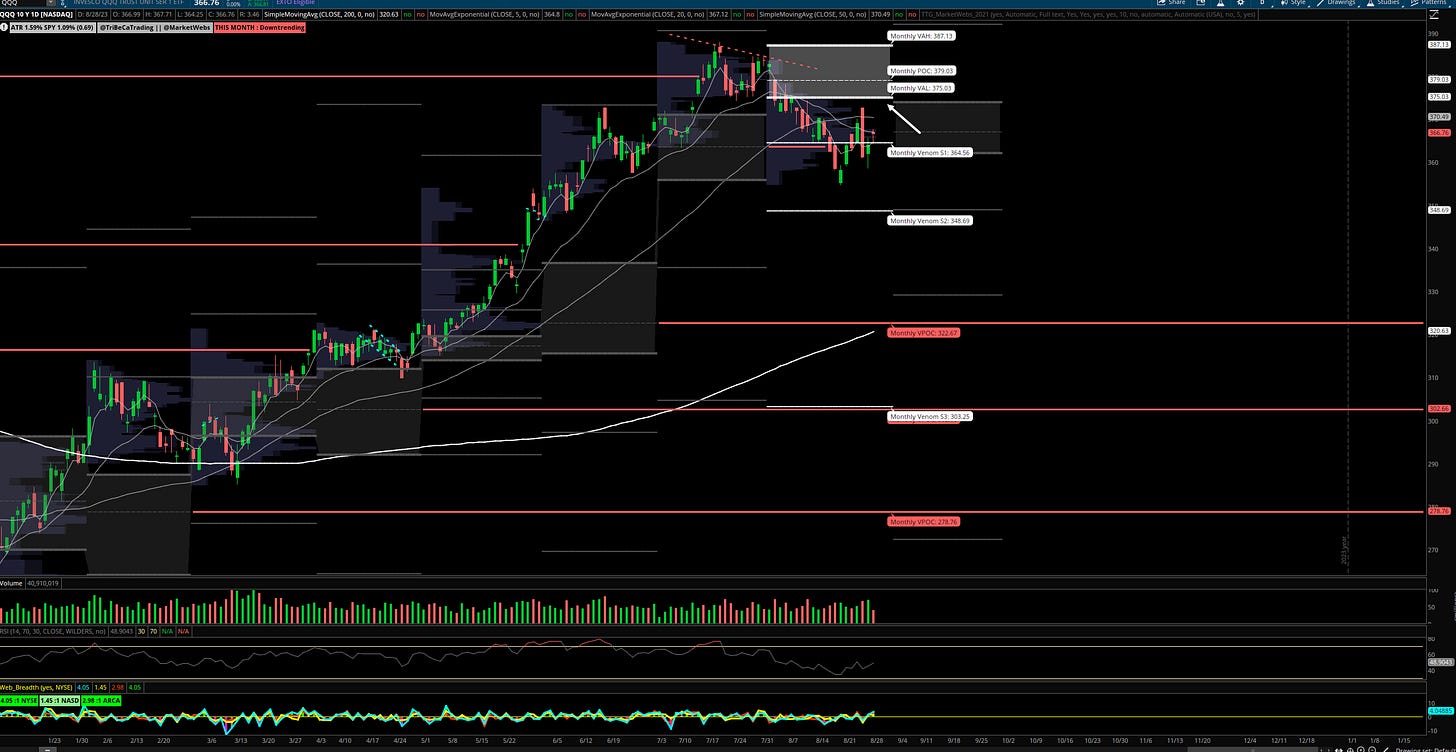
QQQ - NDX 100 ETF - Daily chart: Similar to the S&P, price is trying to put in a higher low but overhead resistance at bottom of August Value Area remains, watch $375.03 and the 20d & 50d MA (Moving Averages)
1hr chart: Price just above its Value Area for the week, support to watch $366.05
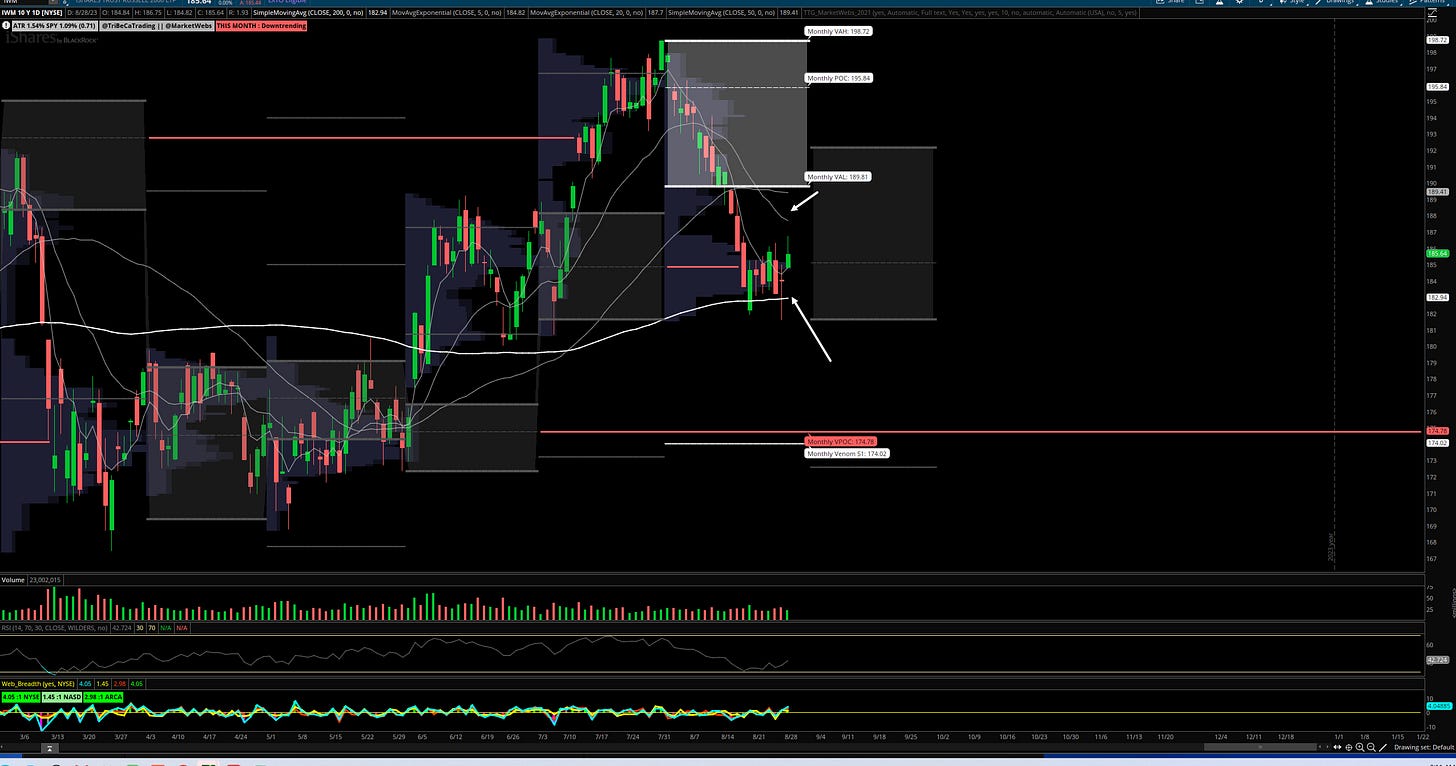
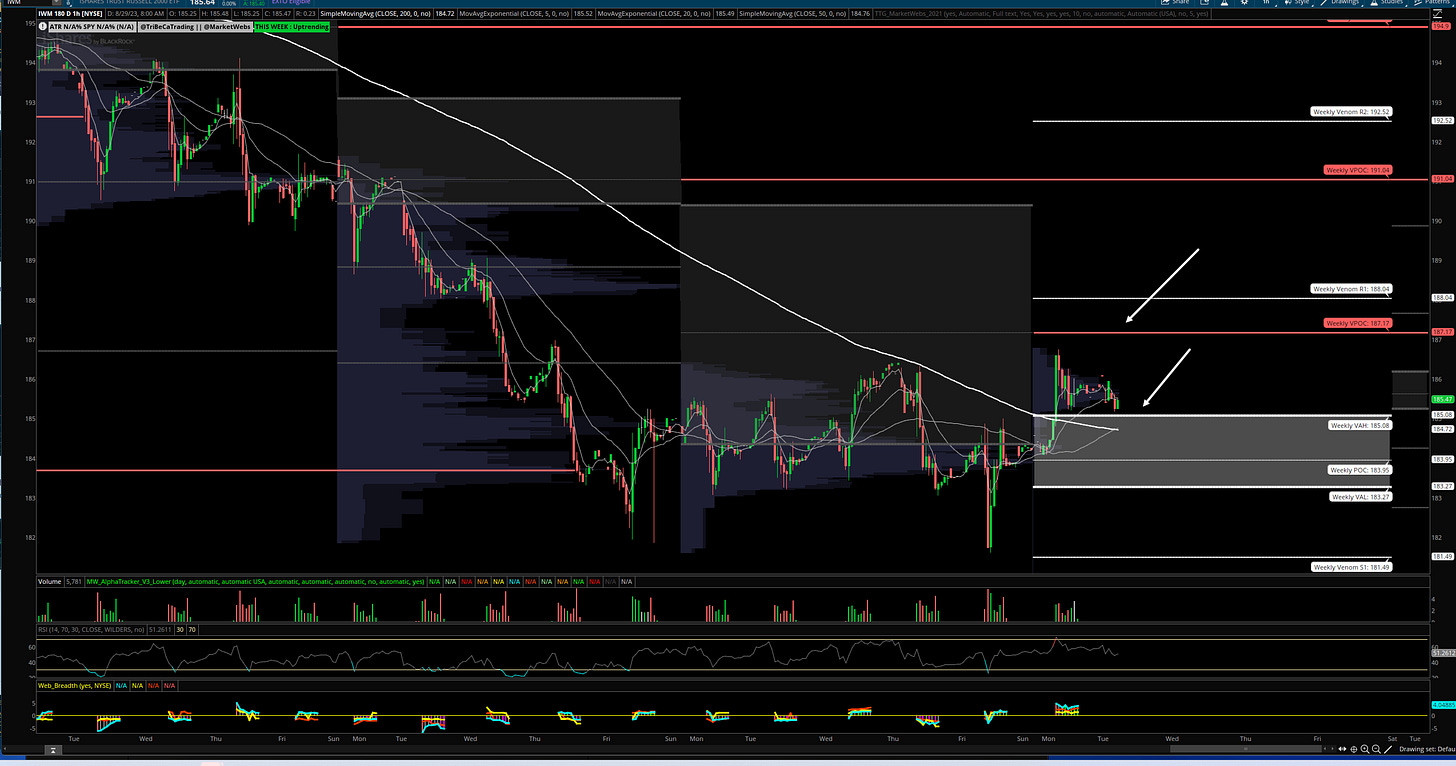
IWM- Russell Small Cap ETF- Daily Chart: Price trying to build off its bounce at 200d MA. Note overhead areas to watch are 20d and 50d MAs.
1hr chart: Price just above its Value Area for the week, support to watch is $185.08 and upside VPOC (red line) to target is $187.17
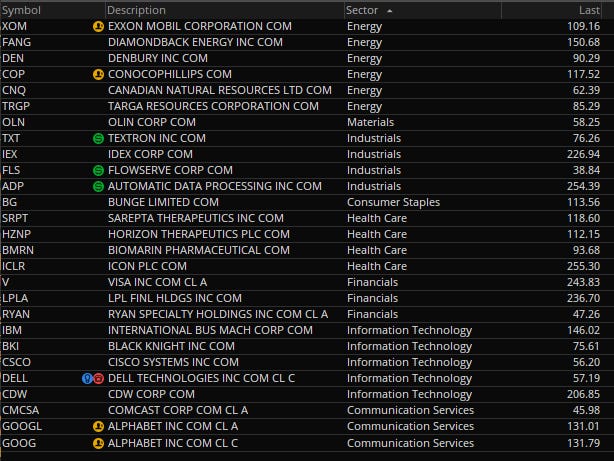
Here is today’s TTG Proprietary Stock Screen “Out of the Box” using Volume At Price
Remember, I am only showing a few setups from the list here and review more in the TTG Trading Room. I provide a more detailed watchlist every weekend to start the week at TTG.
Charts
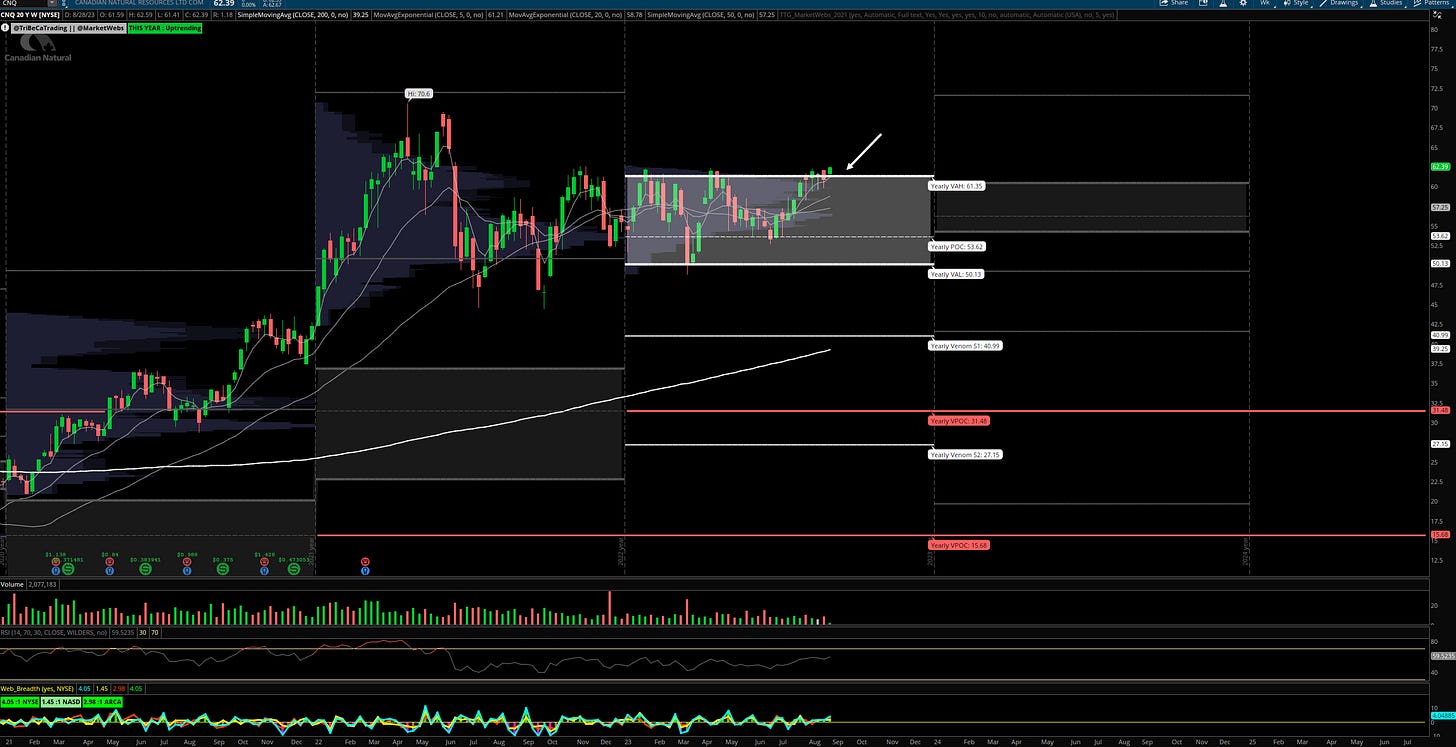
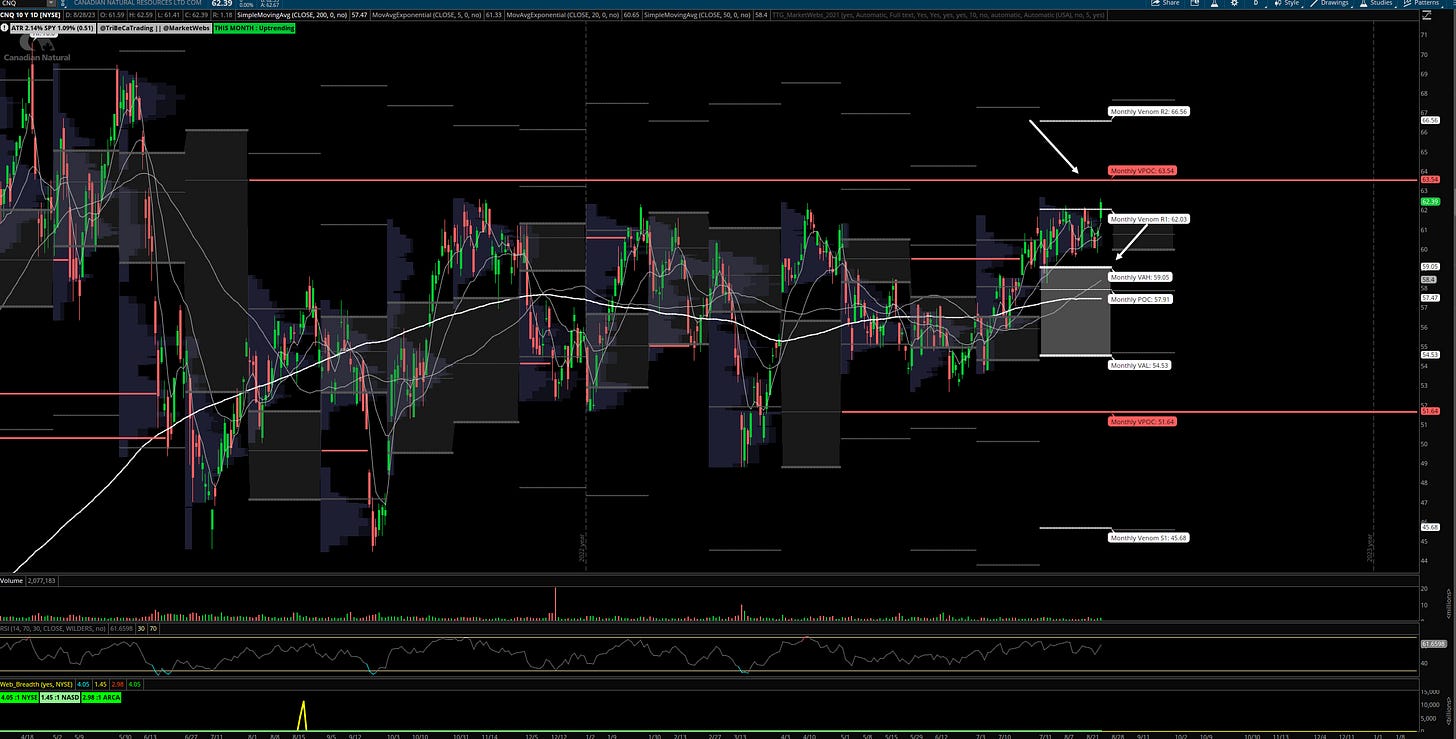
CNQ Weekly & Daily chart
Canadian Natural Resources Ltd. acquires, explores for, develops, and produces natural gas, crude oil, and related products. The Company operates in the Canadian provinces of Alberta, northeastern British Columbia and Saskatchewan. Canadian Natural also operates in areas which have access for exploration activities and where pipeline systems already exist. (Bloomberg)
-suggested stop price $59 using the TTG MarketWebs. Note, price will have to get through that $63.54 VPOC (red line) on Daily Chart
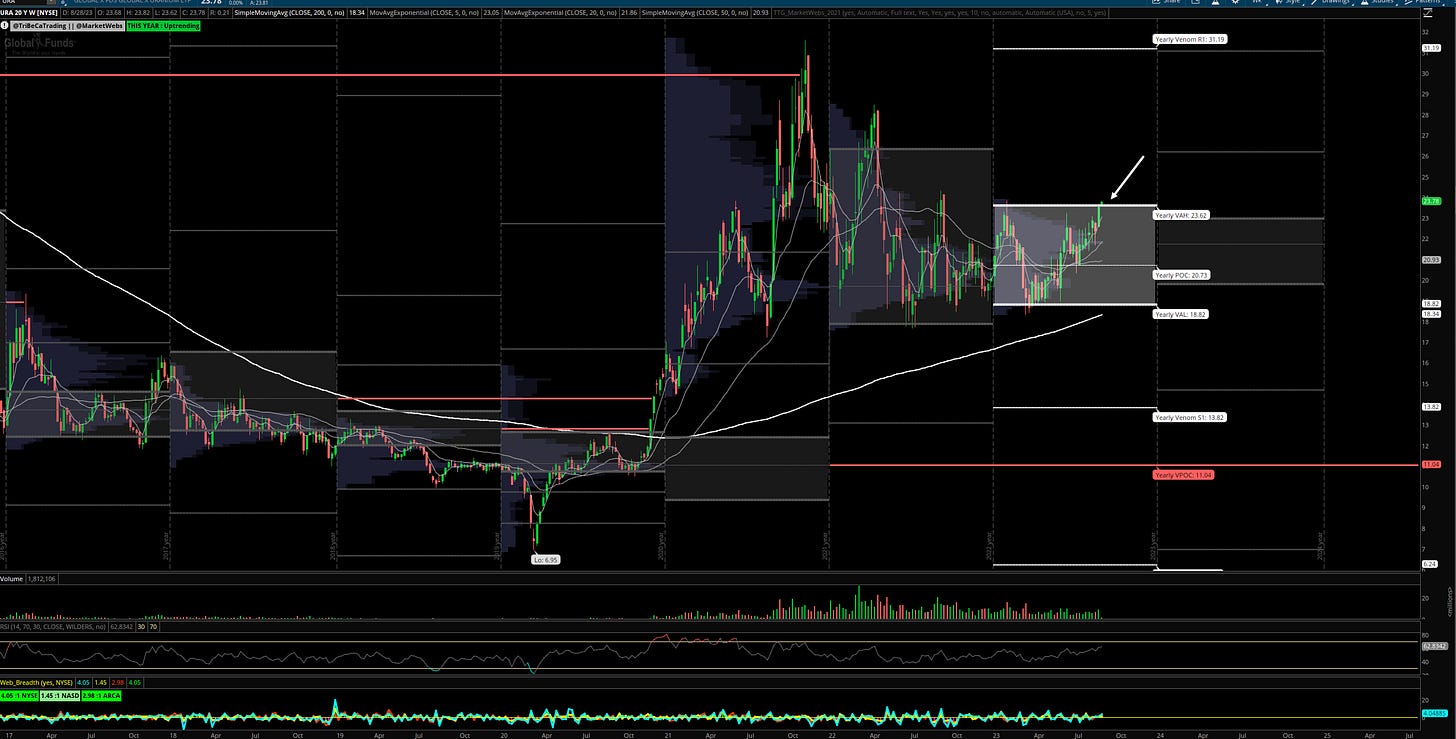
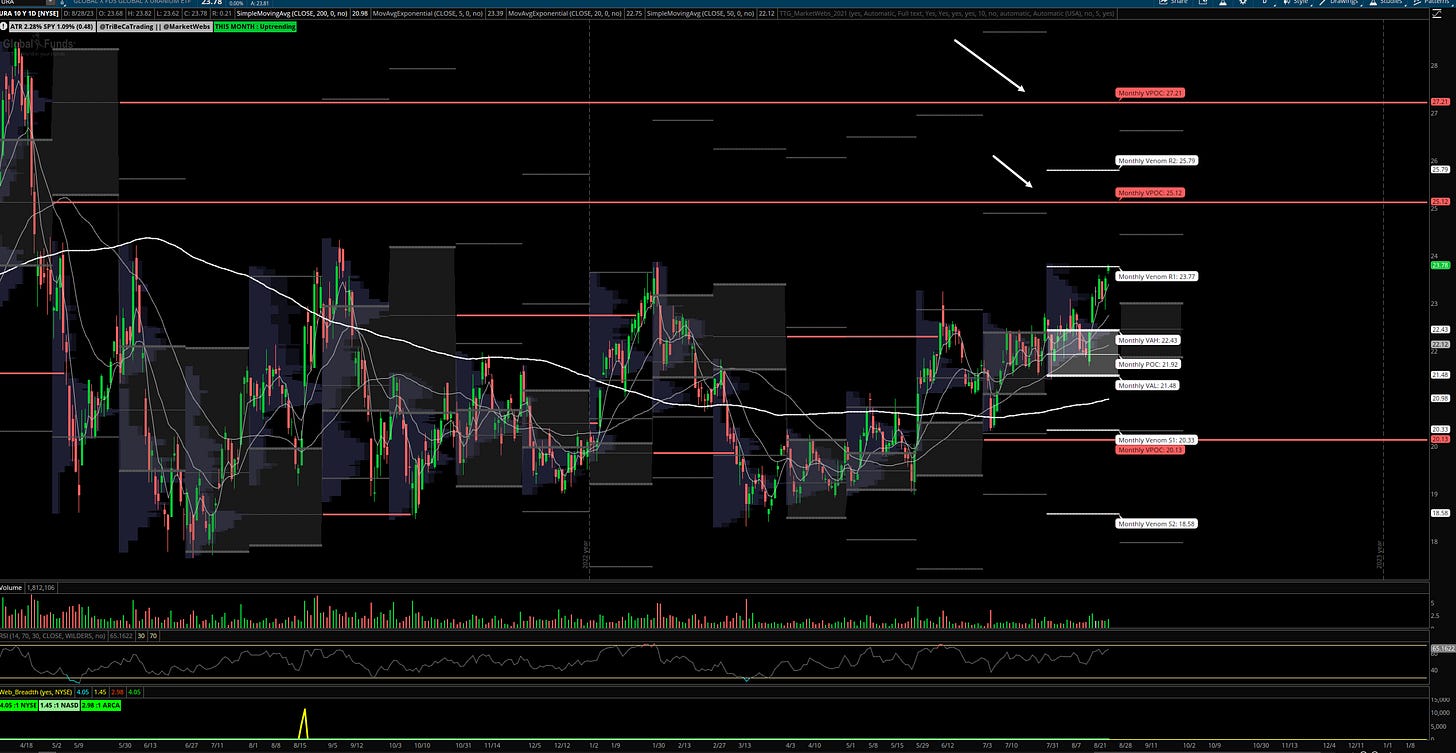
URA Weekly & Daily chart
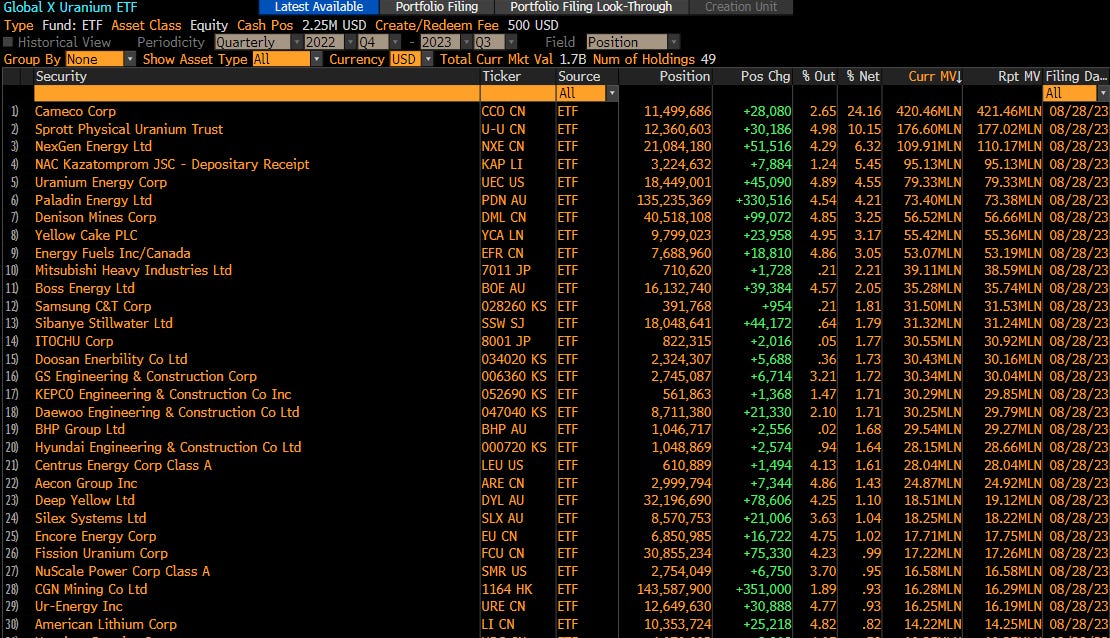
Global X Uranium ETF is an ETF that seeks to track the performance of the Solactive Global Uranium & Nuclear Components Total Return Index. The Fund offers exposure to a broad range of companies involved in uranium mining and the production of nuclear components, including those in extraction, refining, exploration, or equipment manufacturing for the uranium and nuclear industries. (Bloomberg)
Top Holdings:
-suggested stop price $22 using the TTG MarketWebs & first upside price target $25.12
Copyright © Tribeca Trade Group. All of the information in this newsletter is for entertainment and educational purposes only and is not to be construed as investment or trading advice. None of the information in this newsletter is guaranteed to be accurate, complete, useful or timely. IMPORTANT NOTICES AND DISCLAIMERS TriBeCa Trade Group is not an investment advisor and is not registered with the U.S. Securities and Exchange Commission or the Financial Industry Regulatory Authority. Further, owners, employees, agents or representatives of TriBeCa Trade Group are not acting as investment advisors and might not be registered with the U.S. Securities Authority


